Size effect on plain concrete is well known and is the reason why fracture develops at lower values of the nominal strength when the size of a concrete specimen increases while keeping the same proportions. When fracture in plain concrete is numerically reproduced, the size effect can be correctly captured by means of a cohesive zone formulation that uses a well-characterised softening diagram.
1. Overview
The size effect on plain concrete specimens is well known and can be correctly captured when performing numerical simulations by using a well characterised softening function. Nevertheless, in the case of polyolefin-fibre-reinforced concrete (PFRC), this is not directly applicable, since using the same softening diagram cannot capture the material behaviour on elements with different sizes because it does not take into account the changes of the orientation factor of the fibres with the size of the specimen. In previous works, the use of a trilinear softening diagram proved to be highly convenient for reproducing fracture of PFRC elements, but only if it is previously adapted for each specimen size. In this work, a predictive methodology is used to reproduce fracture of PFRC specimens of various sizes under three-point bending tests. Fracture is reproduced by means of a well-known embedded cohesive model, with a trilinear softening function that is defined specifically for each specimen size. The fundamental point of these softening functions is that they are defined a priori by using empirical expressions proposed in past works, based on an extensive experimental background. Therefore, the numerical results are obtained in a predictive manner and then compared with a previous experimental campaign in which PFRC notched specimens of different sizes were tested with a three-point bending test setup, showing that this approach properly captures the size effect, although some values of the fundamental points in the trilinear diagram could be defined more accurately.
2. Fibres as Reinforcement in Concrete
In the case of plastic limit analysis or elasticity assessed up to a strength limit, results are independent of the specimen size, but in the case of elements made of quasi-brittle materials such as concrete that are evaluated beyond the proportionality limit, the nominal strength is dependent on the specimen size.
Size effect on plain concrete is well known and is the reason why fracture develops at lower values of the nominal strength when the size of a concrete specimen increases while keeping the same proportions [
1]. When fracture in plain concrete is numerically reproduced, the size effect can be correctly captured by means of a cohesive zone formulation that uses a well-characterised softening diagram [
2,
3,
4]. Inded, as Bažant states, the cohesive crack model proposed by Hillerborg can be considered as the most realistic among simple models when quasi-brittle fractures is studied [
5].
The use of fibres as reinforcement in concrete has been studied for decades and has been traditionally developed by using steel fibres [
6,
7] but has been boosted in recent years, and the range of fibres used for this purpose has increased [
8,
9,
10,
11], with polyolefin fibres being one of the most recent types. PFRC is experiencing great development in recent years, due to its good mechanical behaviour and the fact that it reduces and, in some cases, even eliminates some of the problems observed in steel-fibre-reinforced concrete (SFRC) such as corrosion, sensitivity to magnetic fields, or wear and tear of machinery related to its production (concrete pumps and mixers, for example), making PFRC particularly suitable for some uses. The effect of these fibres on the properties of PFRC has been studied in depth during the last years for traditional vibrated concrete [
12], self-compacting concrete [
13], and in combination with steel fibres [
14]. Many aspects of PFRC are already studied, such as the fibre distribution depending on the production process [
15] or how it affects fracture in mode I [
16] and mode II [
17]. Although this material is starting to count with initial examples of use as a structural material [
18,
19], one of the reasons why PFRC is still not becoming as widespread as it could is probably the scarce experience with it and the uncertainty on its behaviour in real engineering works under certain situations. One of the aspects that must be clarified is the size effect; this is of paramount importance if the material properties measured at a laboratory scale are to be used for designing larger structures.
There is not much information about the size effect in fibre-reinforced concrete (FRC), especially in the case of PFRC, given that it is a relatively recent material. In the case of SFRC, some studies can be found [
20,
21], and in the case of PFRC, an experimental campaign has been recently carried out [
22], which has shown that the nominal strength at the limit of proportionality is governed by the matrix (concrete), and the post-cracking residual strength is governed by the fibres.
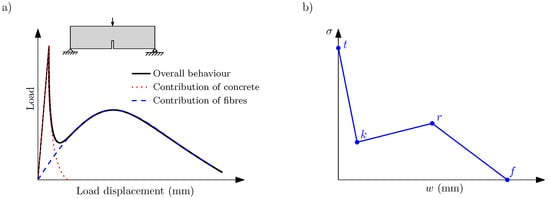
In previous works, the use of a cohesive zone formulation fed with a trilinear softening curve has proven to be very convenient for reproducing the fracture process in FRC [
23], but it must be adapted depending on several factors such as the fibre length, the fibre proportion [
16], and the specimen size [
24]. This trilinear softening diagram describes the contribution of matrix and fibres in the fracture process which, due to the different elastic moduli of both materials, begin to significantly work at different stages of load transmission. Considering the trilinear diagram shown in
Figure 1, the initial point
t identifies the fracture of the concrete matrix,
k the point at which the contribution of fibres starts to predominate over the contribution of the matrix,
r the maximum residual contribution of fibres, and
f the eventual failure of the material.
Figure 1. (a) Load–displacement diagram obtained in a three-point bending test with a PFRC specimen; (b) trilinear softening diagram.
In [
16], some parameters of the PFRC mix were identified, and some expressions were also proposed to define the fundamental points of the trilinear diagram (
k and
r points). In addition to this, in [
25] the length and orientation of fibres were observed as key parameters to define the trilinear diagram, also identifying a higher threshold of the PFRC behaviour obtained testing specimens with long fibres oriented in the optimum direction.
From the numerical point of view, there exist many approaches and models that help to simulate fracture. In many cases, these models are calibrated using the experimental results of the test simulated, but this does not guarantee that the parameters represent any other case different from the one under study. From this point of view, the most interesting approach consists of finding models that can reproduce fracture in a predictive way, that is, a model that is fed with parameters obtained by experimental tests that are different from the loading case that wants to be simulated. This type of model is considered less biased and more representative of the material than a specific loading case.
3. Conclusions
The complete fracture behaviour of PFRC specimens can be numerically simulated by using a predictive trilinear cohesive crack model, which can be defined a priori by means of empirical expressions obtained with lab tests different from those simulated. This diagram is defined by four points, with coordinates that depend on PFRC mechanical characteristics, i.e., the tensile strength of the matrix, the proportion of fibres, and the orientation factor. Abscissa values wrwr and wf are fixed based on experimental results obtained in previous literature. It is still an unsolved challenge to obtain specific expressions to estimate wr and wf.
The following comments can be added to this main conclusion:
Tw
-
The softening diagrams are not equal for all specimen sizes and should be adjusted for each of them. This is mainly due to a different orientation factor that varies with the size of the specimen.
-
The maximum residual loads obtained for each size present a linear trend on the load–displacement diagram, which does not agree completely with the experimental observations, although the load–displacement and load–CMOD curves properly agree with the experimental envelopes for the three studied sizes.
-
Modifying rwr and wf wf affects the maximum residual load on the load–displacement diagram and modifies the last part of this diagram but cannot capture the nonlinear trend of the residual load among specimen sizes.
This entry is adapted from the peer-reviewed paper 10.3390/ma14143795