Spent oil bleaching earth (SOBE) is a waste product obtained in the refining process of oil. It is estimated that 120 million tons of oil are processed with bleaching earth worldwide, generating 2.5 million tons of spent bleaching earth as residue. Moreover, the serious fire and contamination risks that arise during storage and disposal of spent bleaching earth require appropriate technical solutions. The current treatment of SOBE residue is not in line with the new circular economy policies promoted by the European Union, since in most cases it is disposed of in landfills. New technologies that allow oil recovery and treatment of the earths, aiming to convert them into useful products are then needed.
- spent bleaching earth
- geopolymers
- activating solution
- activator modulus
- compressive strength
- microstructure
1. Introduction
2. Results and Discussion
2.1. Reaction Degree
| Sample | G-SOBE-1:1 | G-SOBE-1:2 | G-SOBE-1:3 | G-SOBE-1:4 |
|---|---|---|---|---|
| Reaction degree (%) | 52.5 | 47.3 | 45.7 | 43.5 |
2.2. Mineralogy of Geopolymer Binders
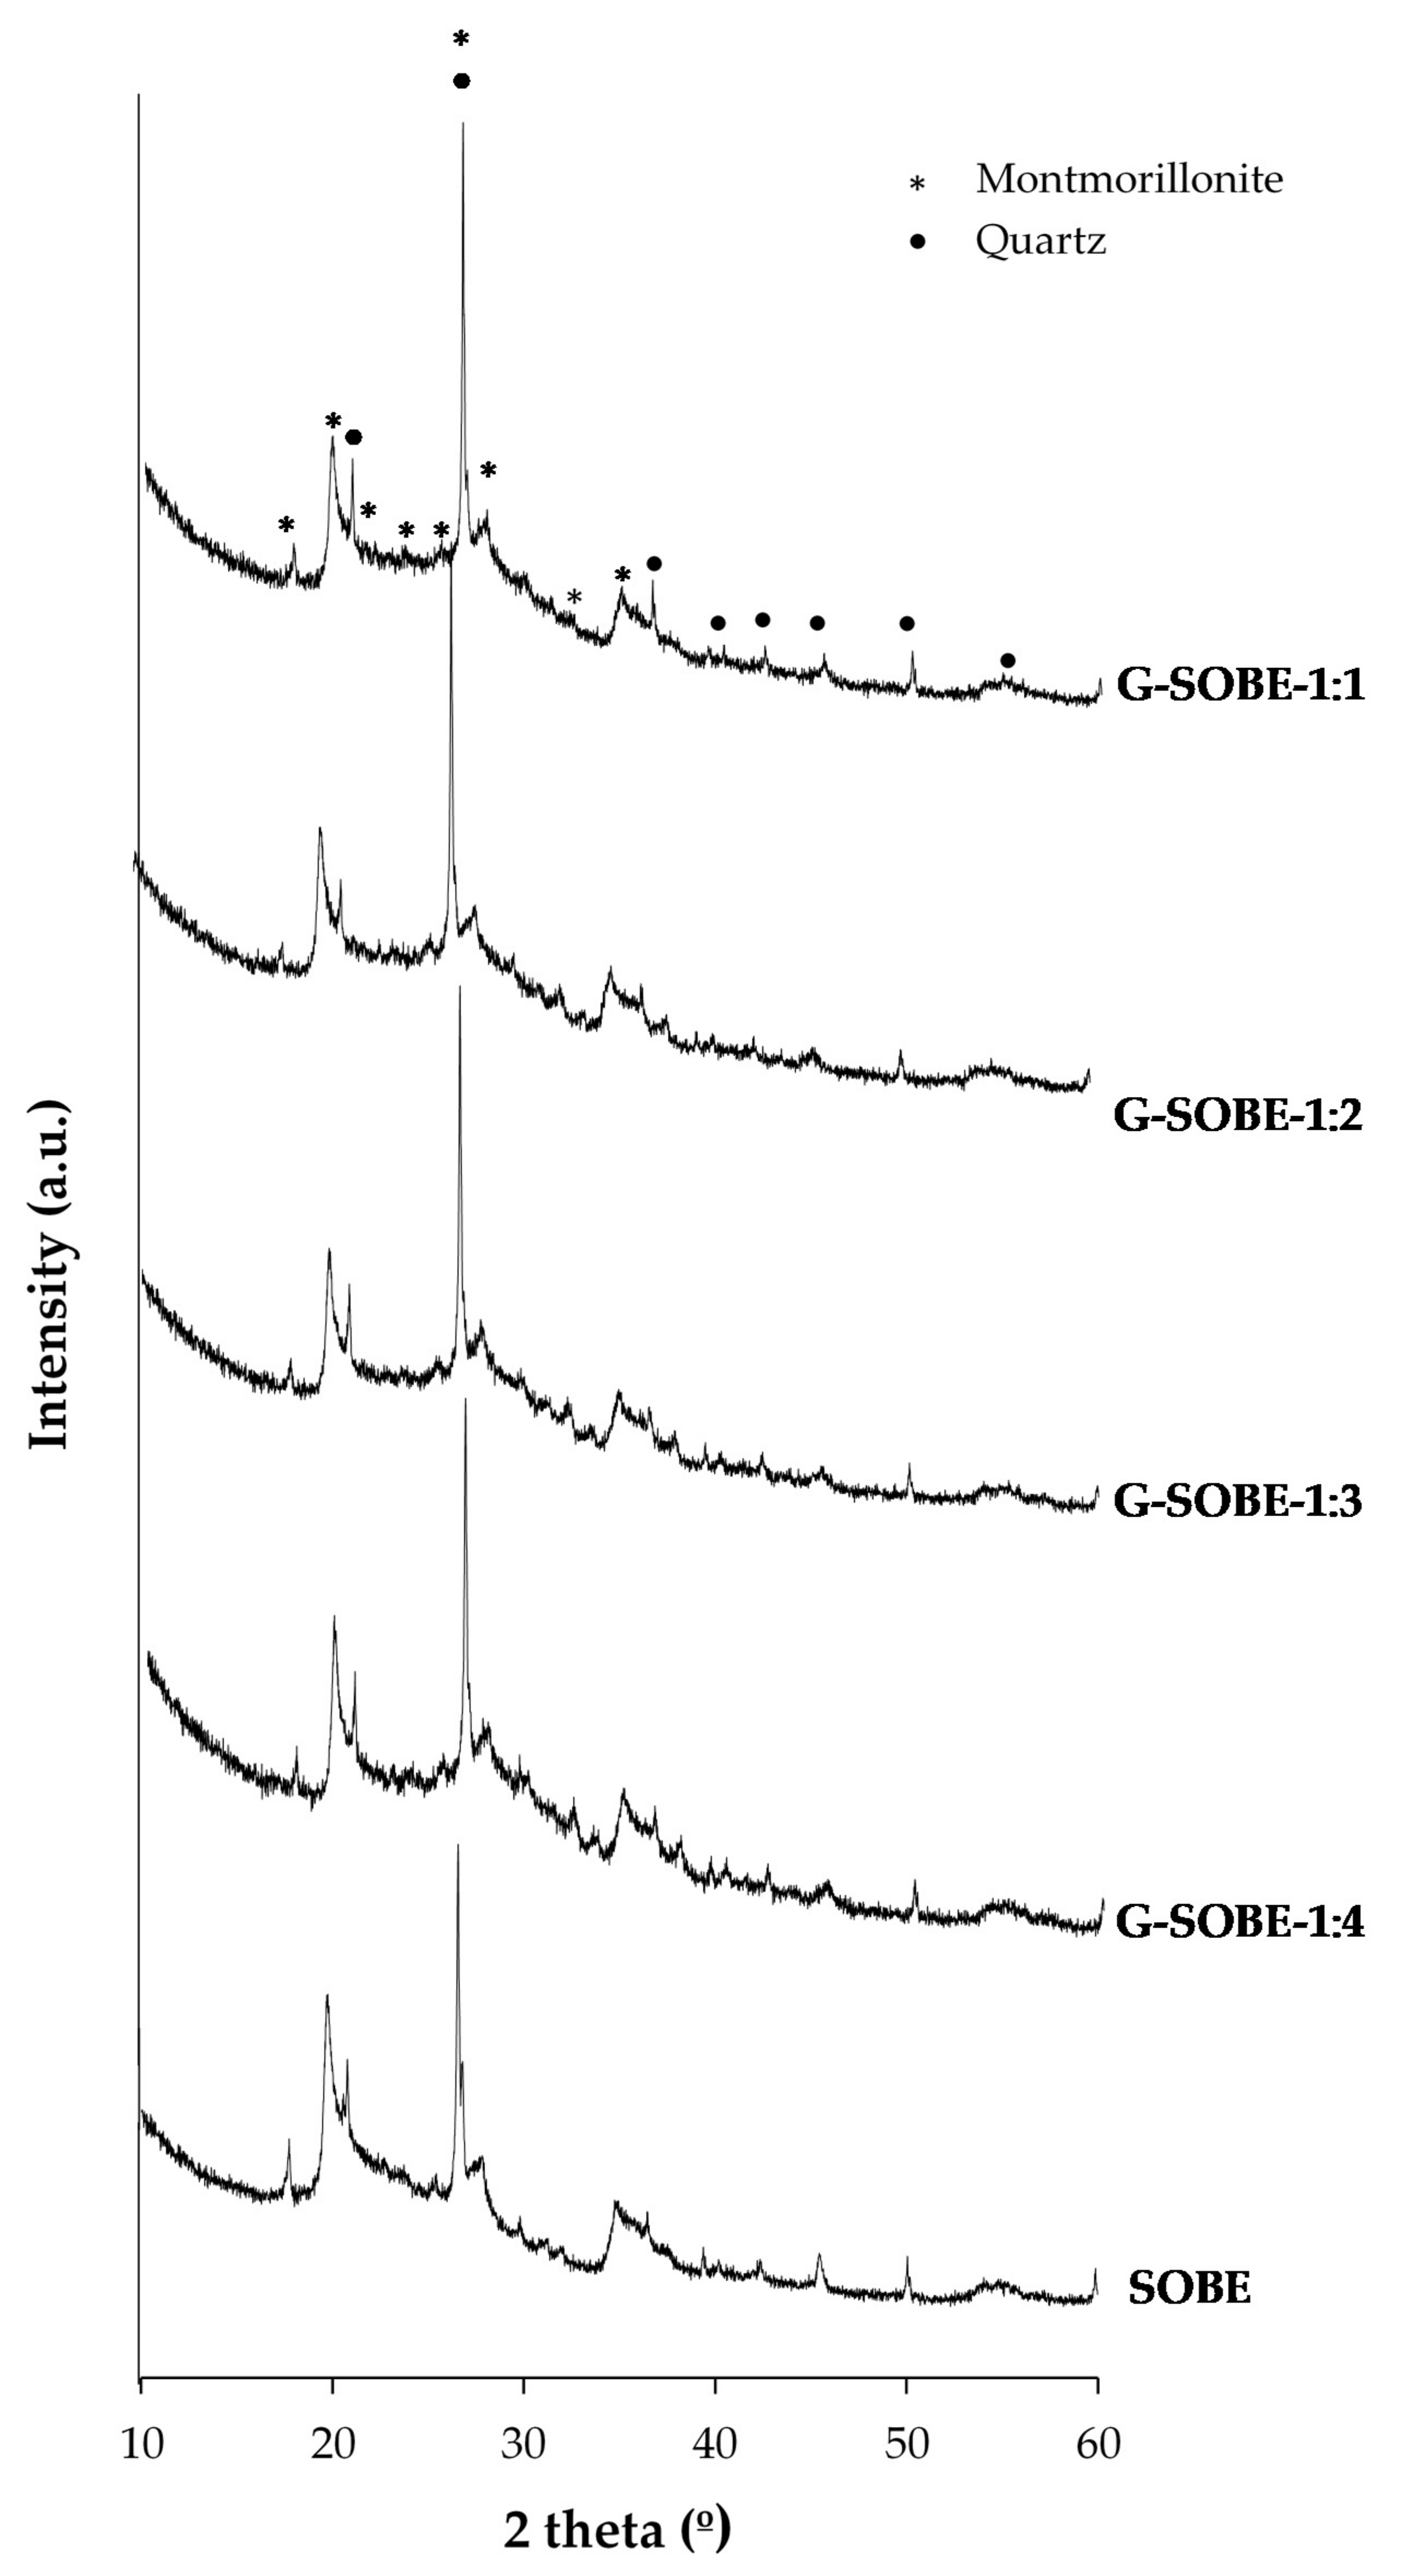 Figure 5. XRD of raw material and geopolymer cements as function of Na2SiO2/NaOH mass ratio of activating solution.
| Phase Composition (wt%) | ||
|---|---|---|
| Sample | Montmorillonite | α-Quartz |
| Raw material | 82.4 ± 0.2 | 17.6 ± 0.3 |
| G-SOBE-1:1 | 81.8 ± 0.2 | 18.2 ± 0.2 |
| G-SOBE-1:2 | 81.3 ± 0.2 | 18.7 ± 0.3 |
| G-SOBE-1:3 | 81.7 ± 0.2 | 18.3 ± 0.5 |
| G-SOBE-1:4 | 80.5 ± 0.2 | 19.5 ± 0.3 |
2.3. Bulk Density, Total Porosity and Water Absorption of Geopolymer Binders
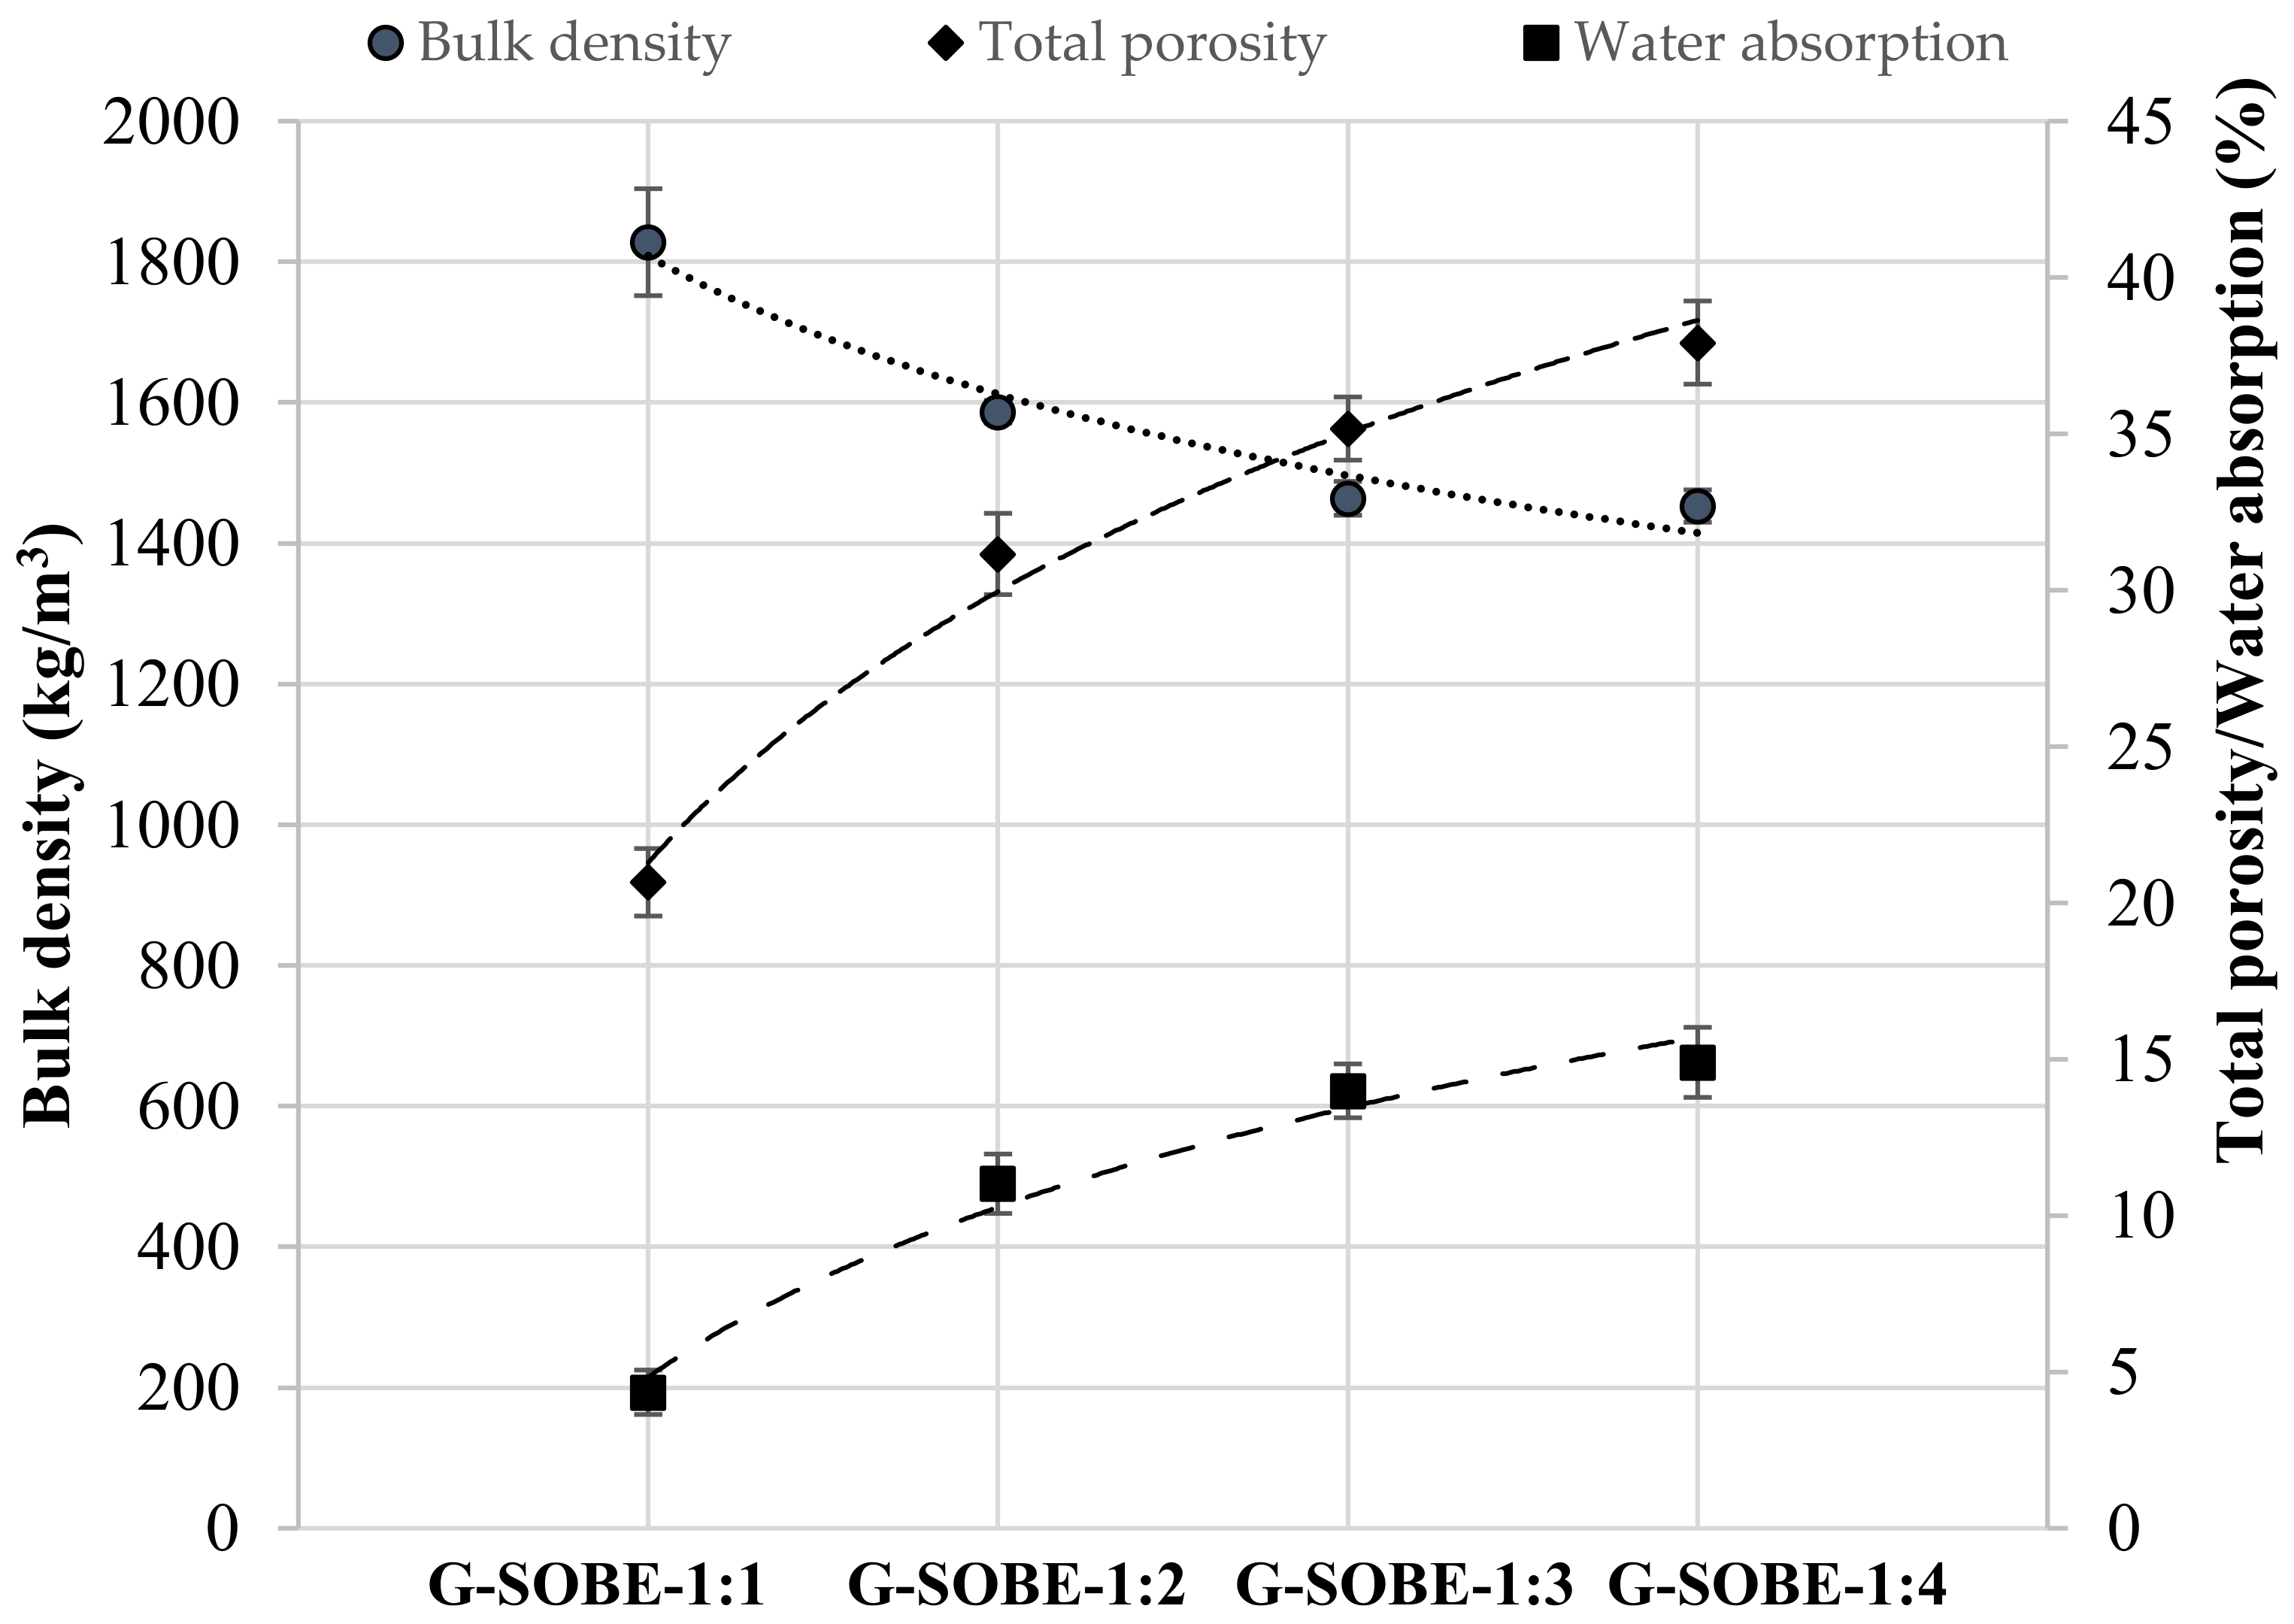 Figure 6. Bulk density, total porosity and water absorption of geopolymers after 28 days of curing as functions of the Na2SiO3/NaOH mass ratio.
2.4. Compressive and Flexural Strength of Geopolymer Binders
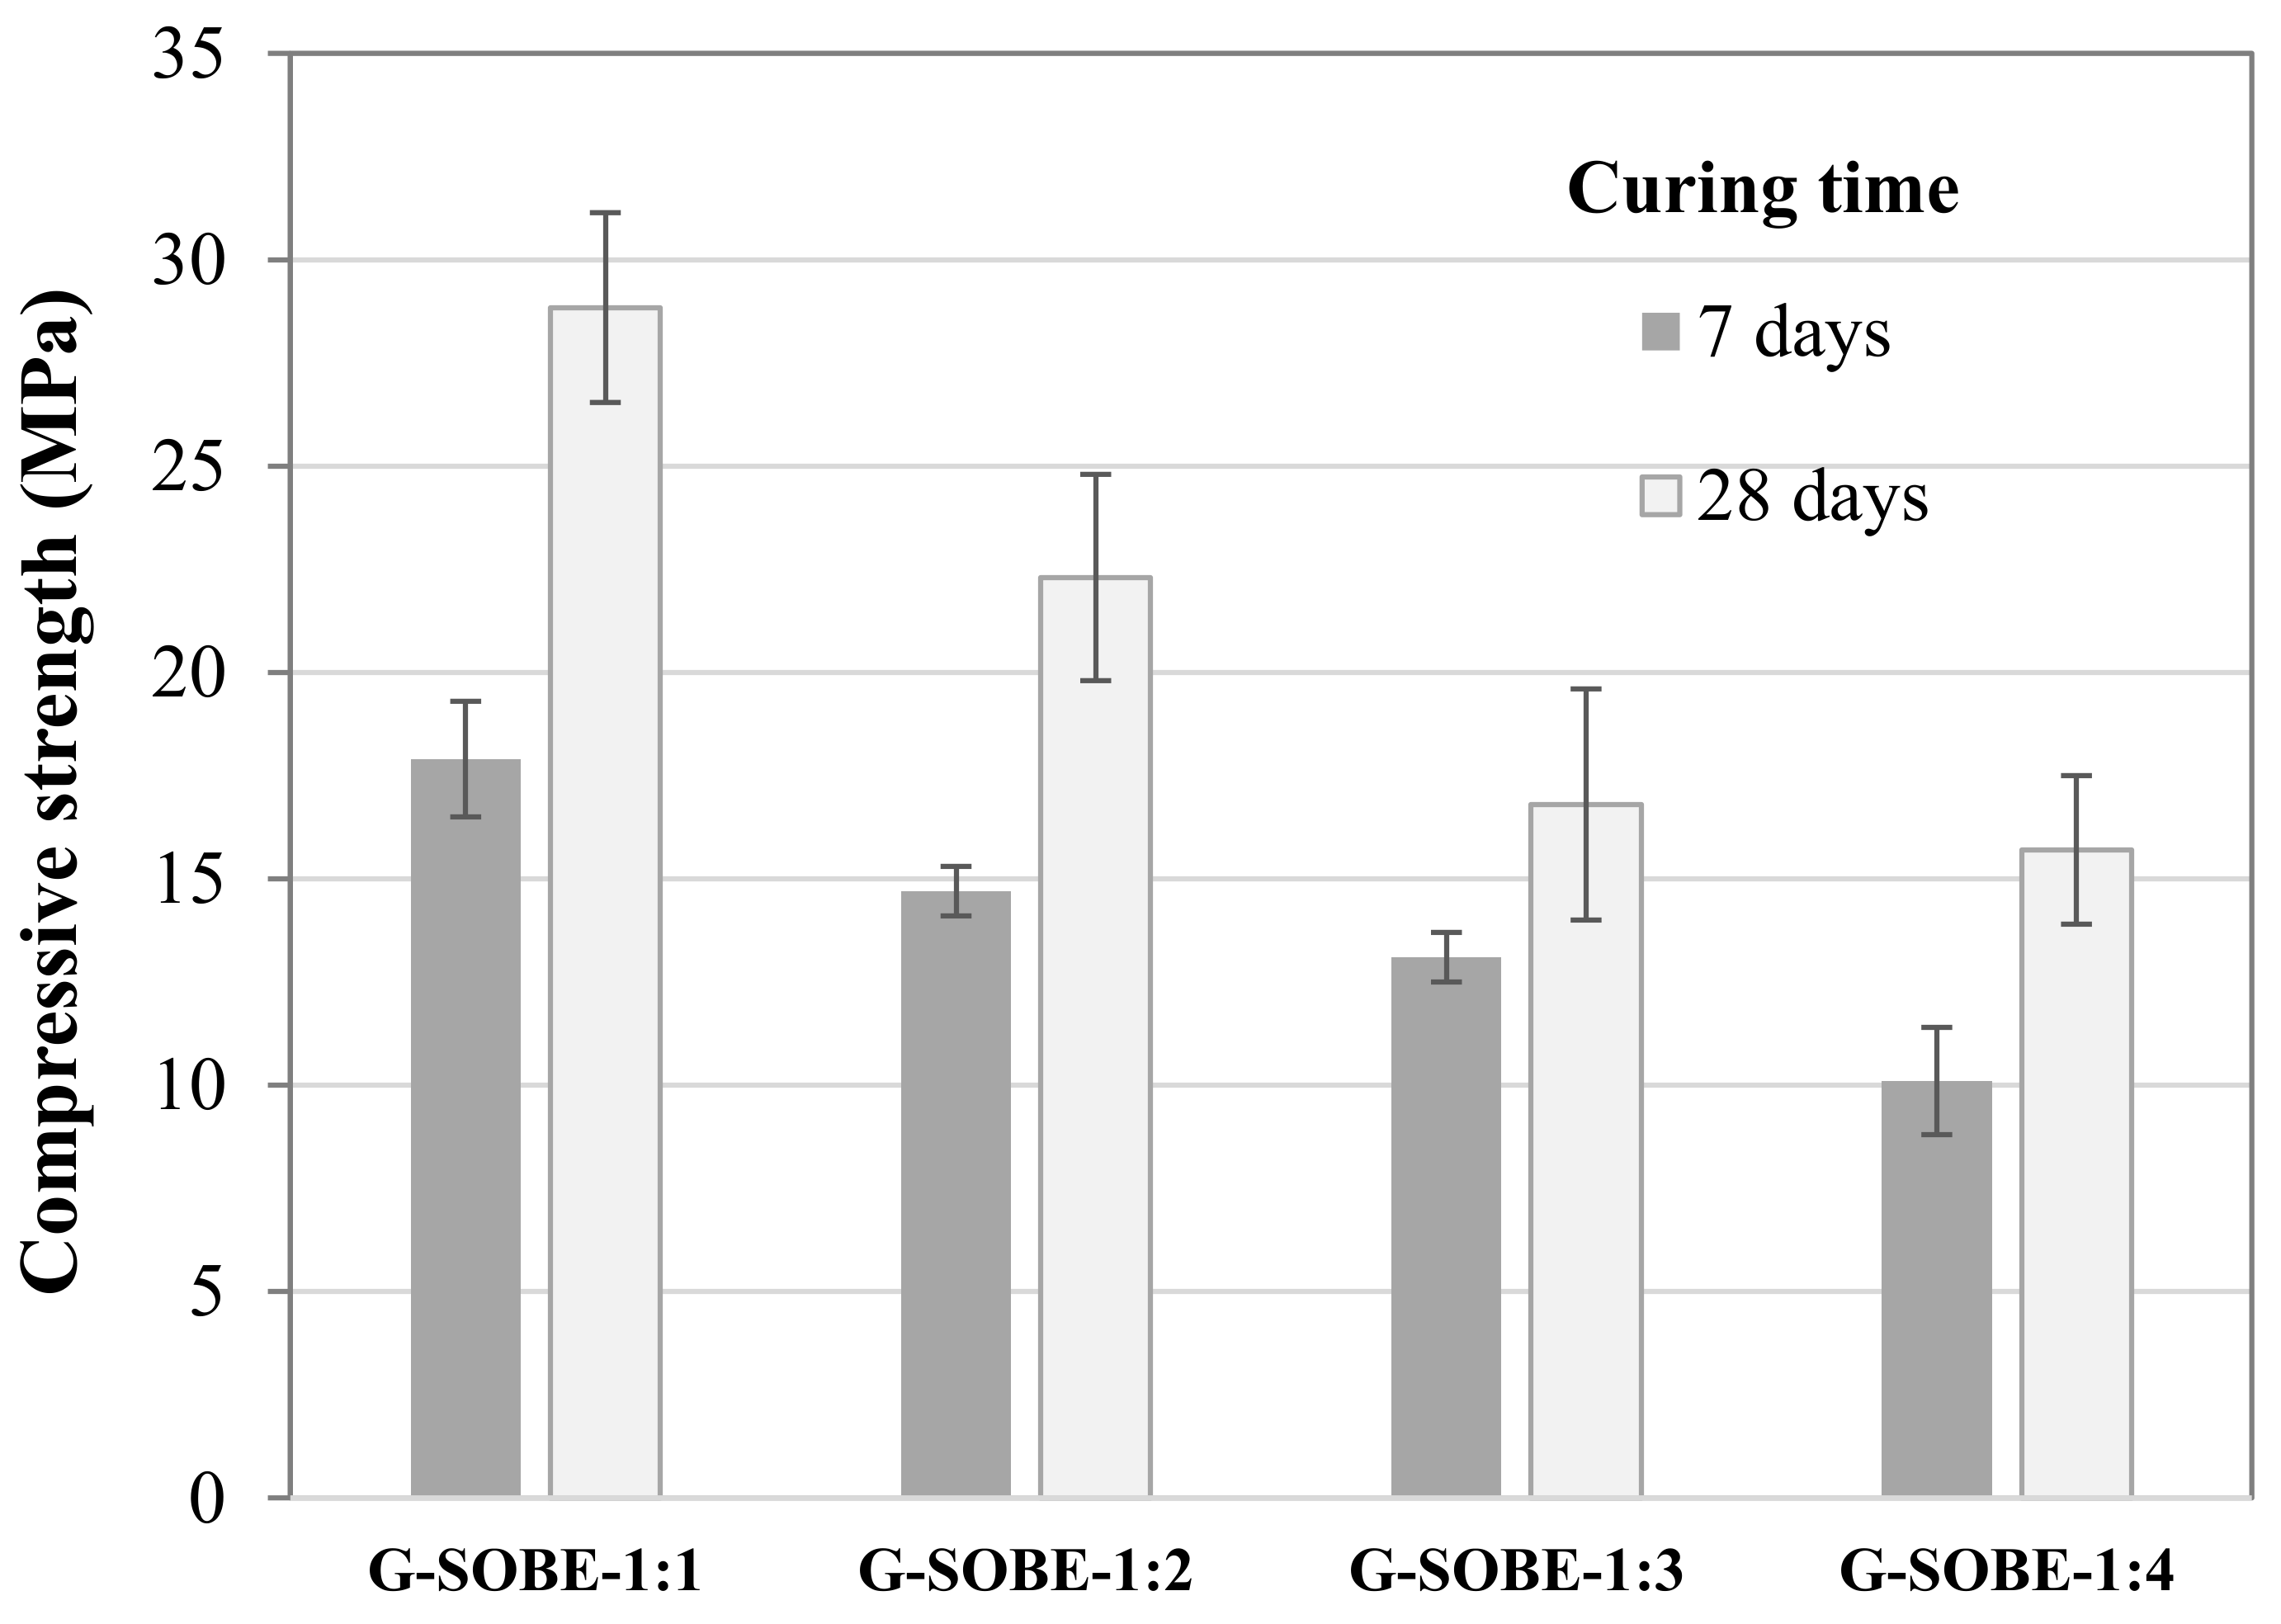 Figure 7. Compressive strength of samples cured for 7 and 28 days.
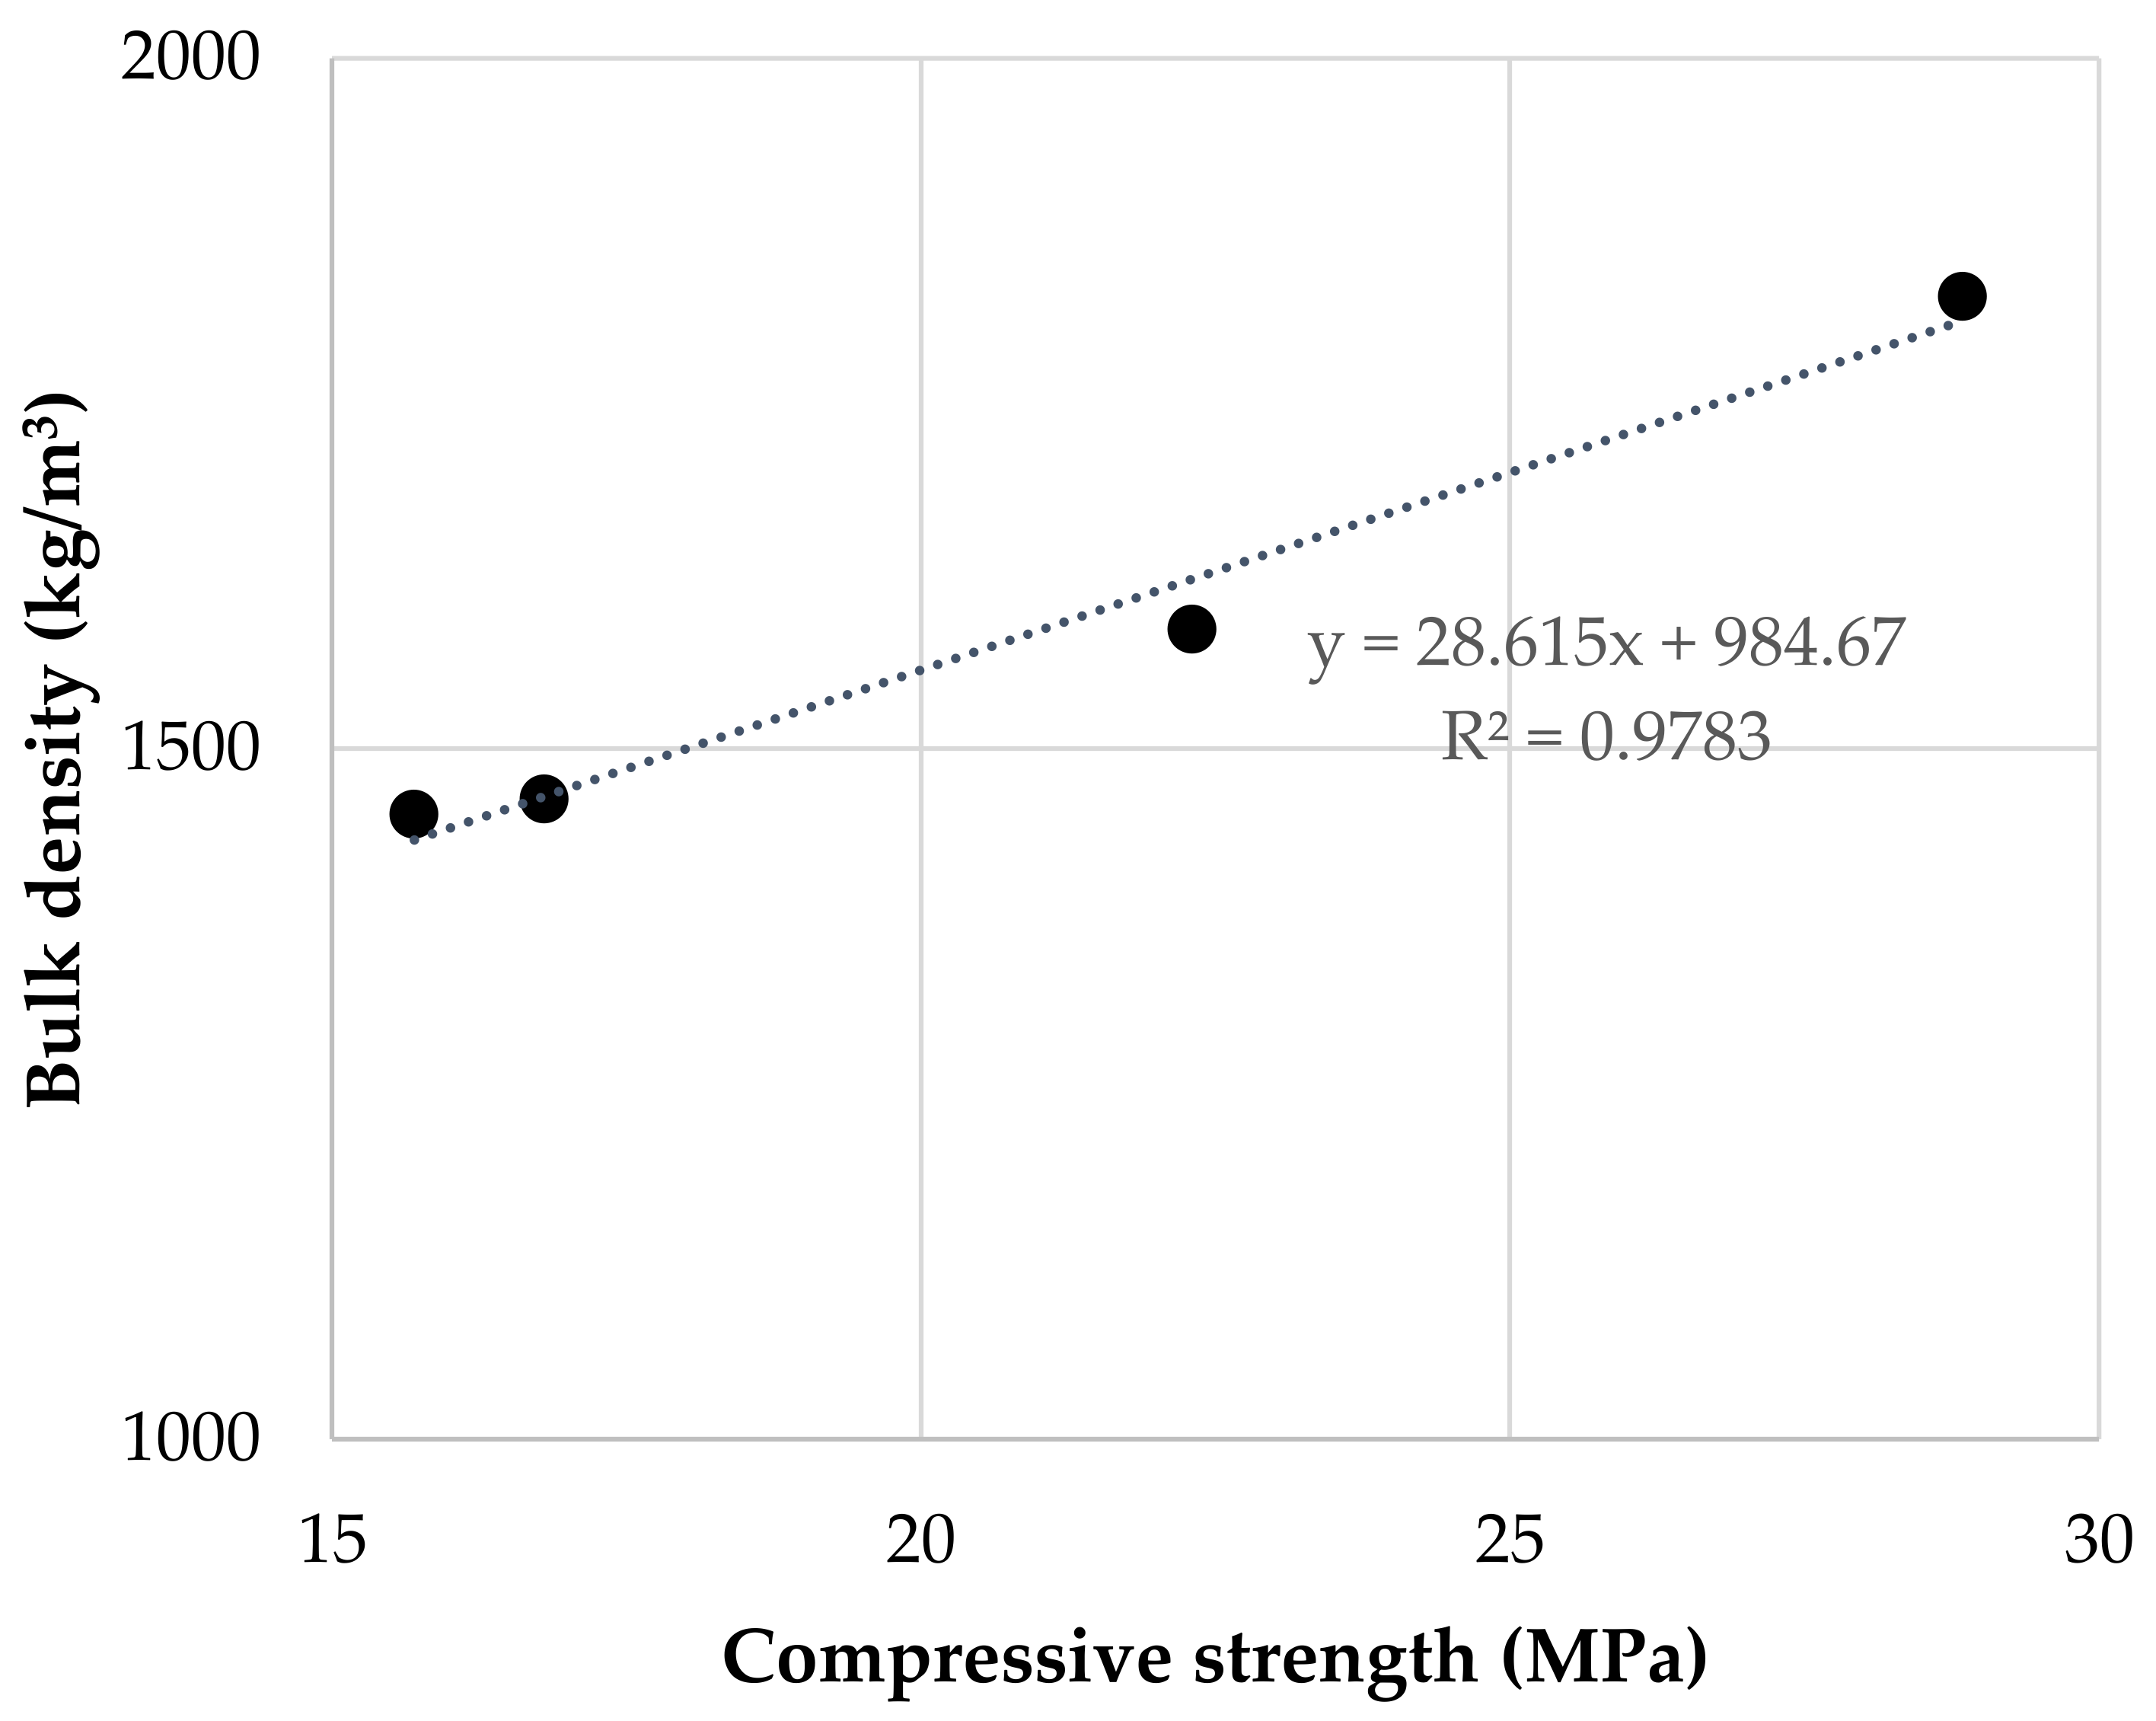 Figure 8. Relationship between bulk density and compressive strength of geopolymers cured for 28 days.
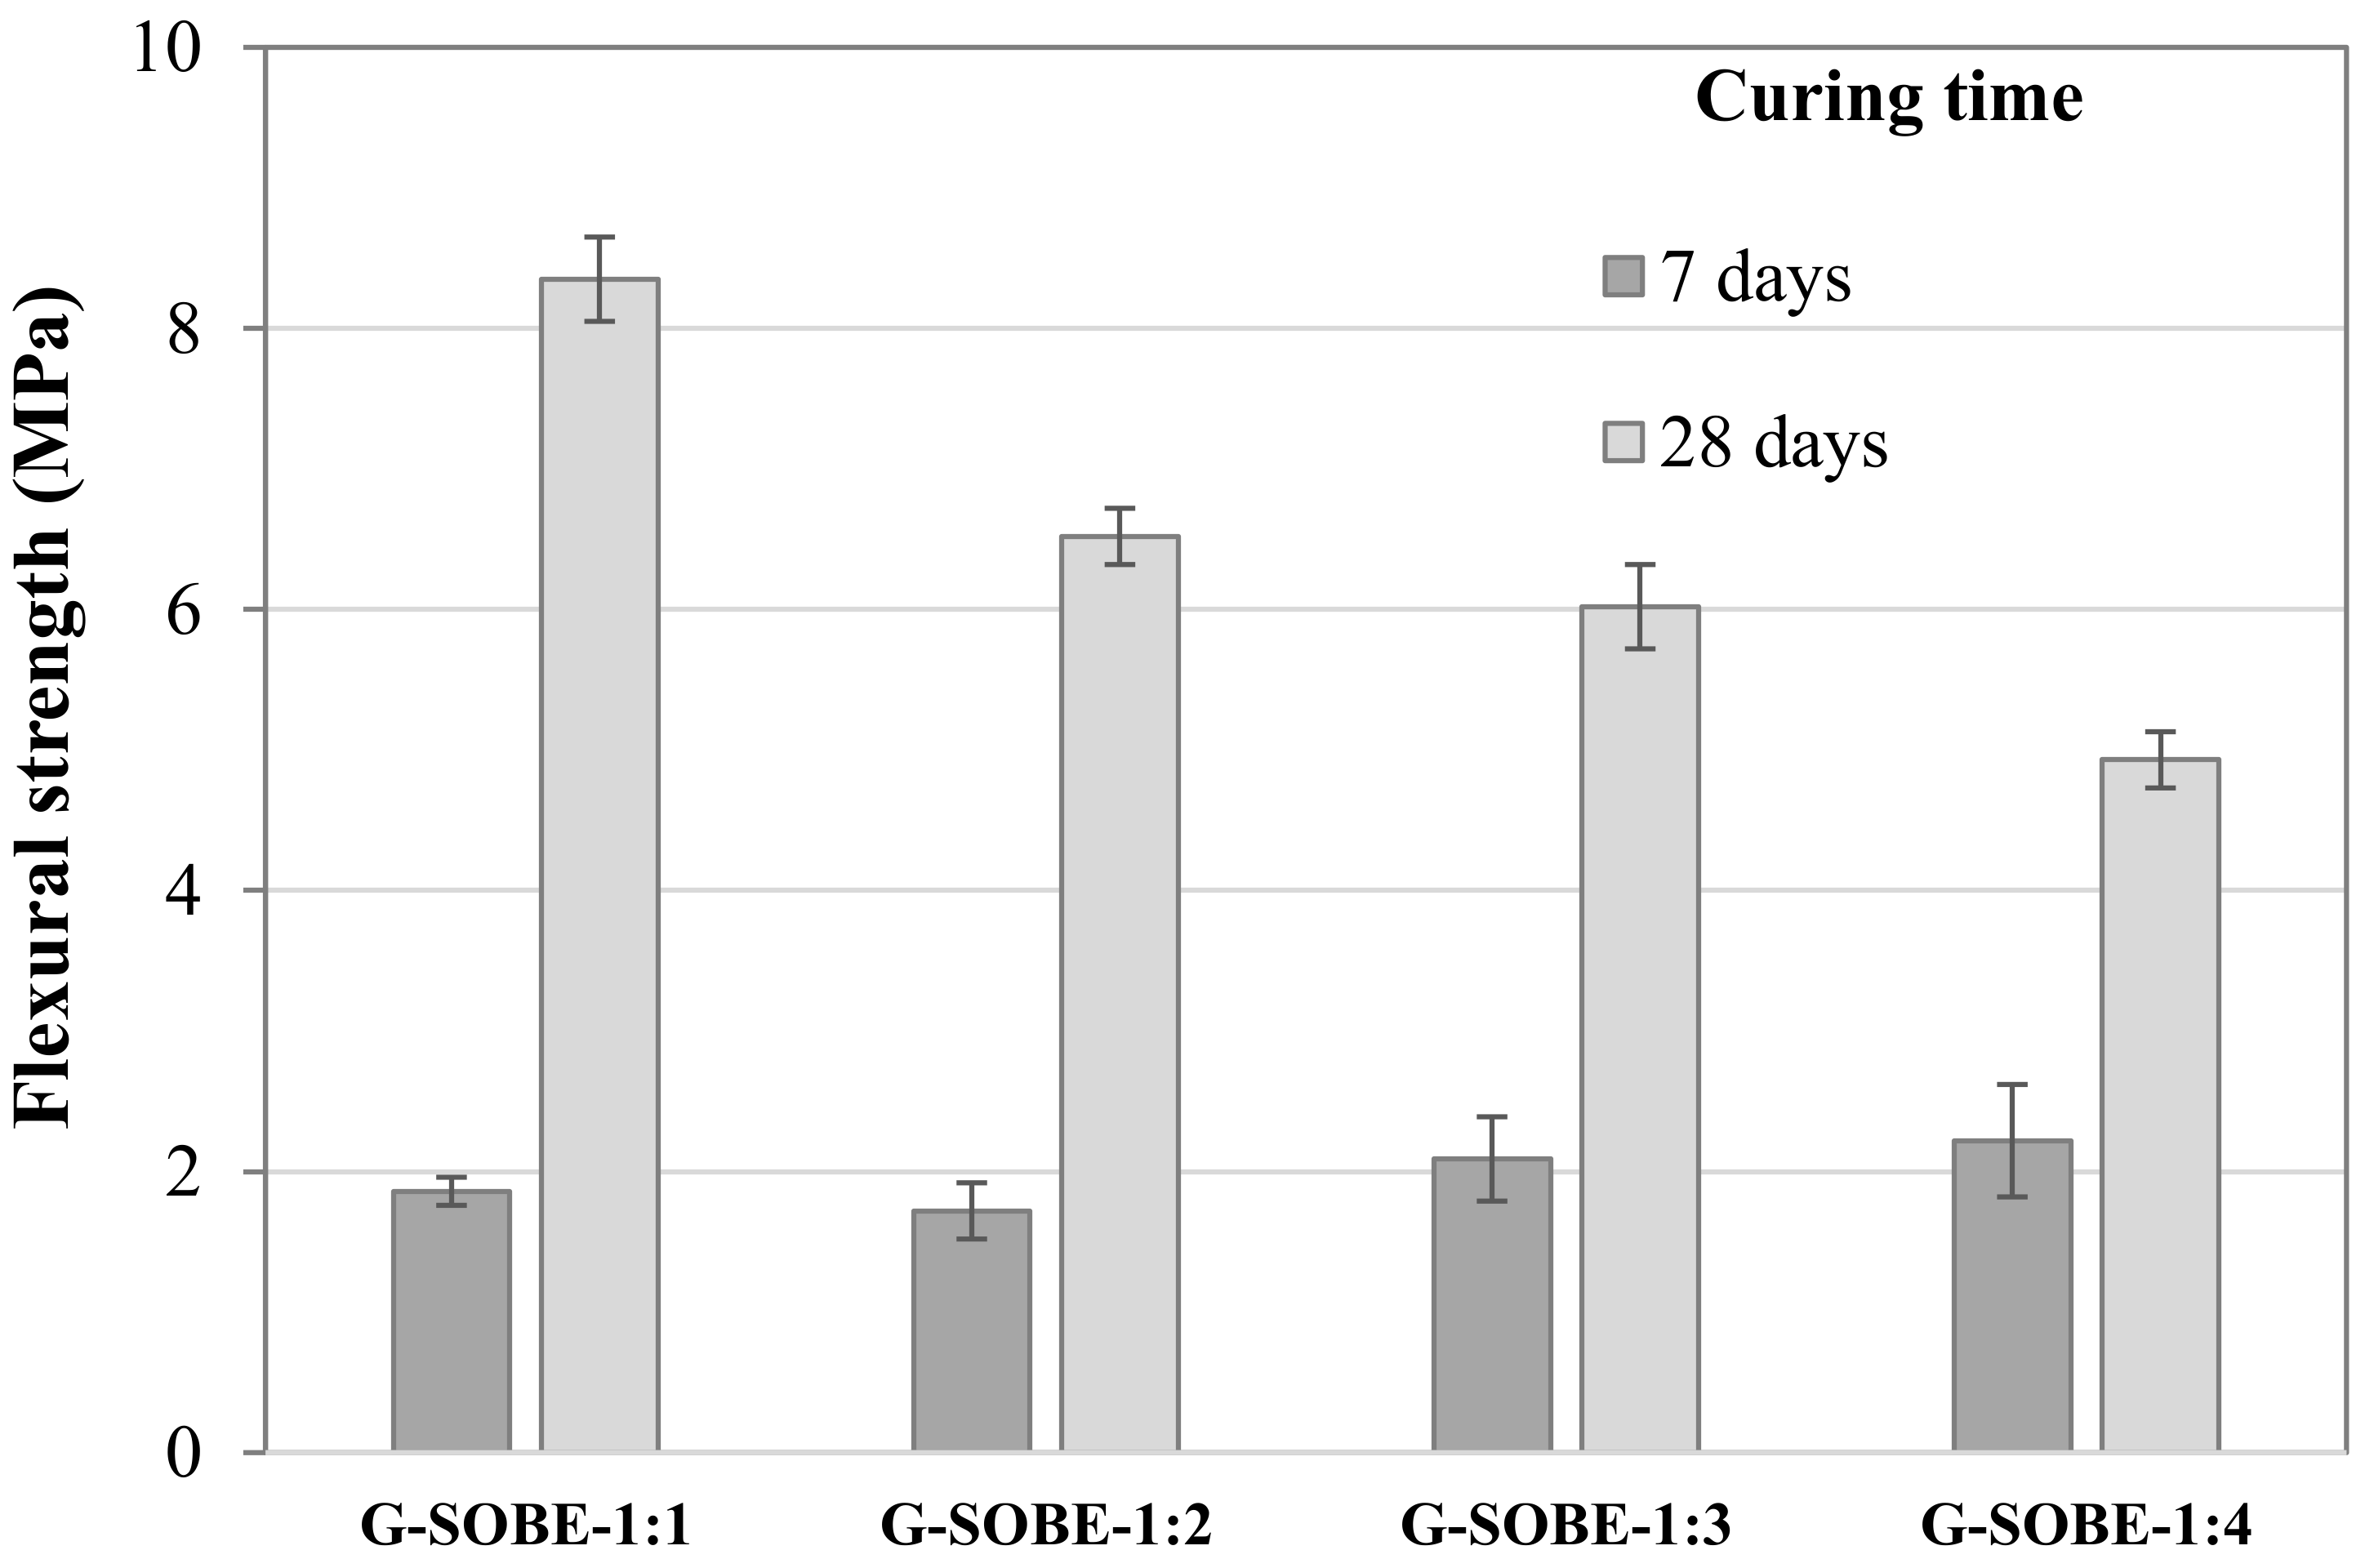 Figure 9. Flexural strength of samples cured for 7 and 28 days.
2.5. Thermal Conductivity
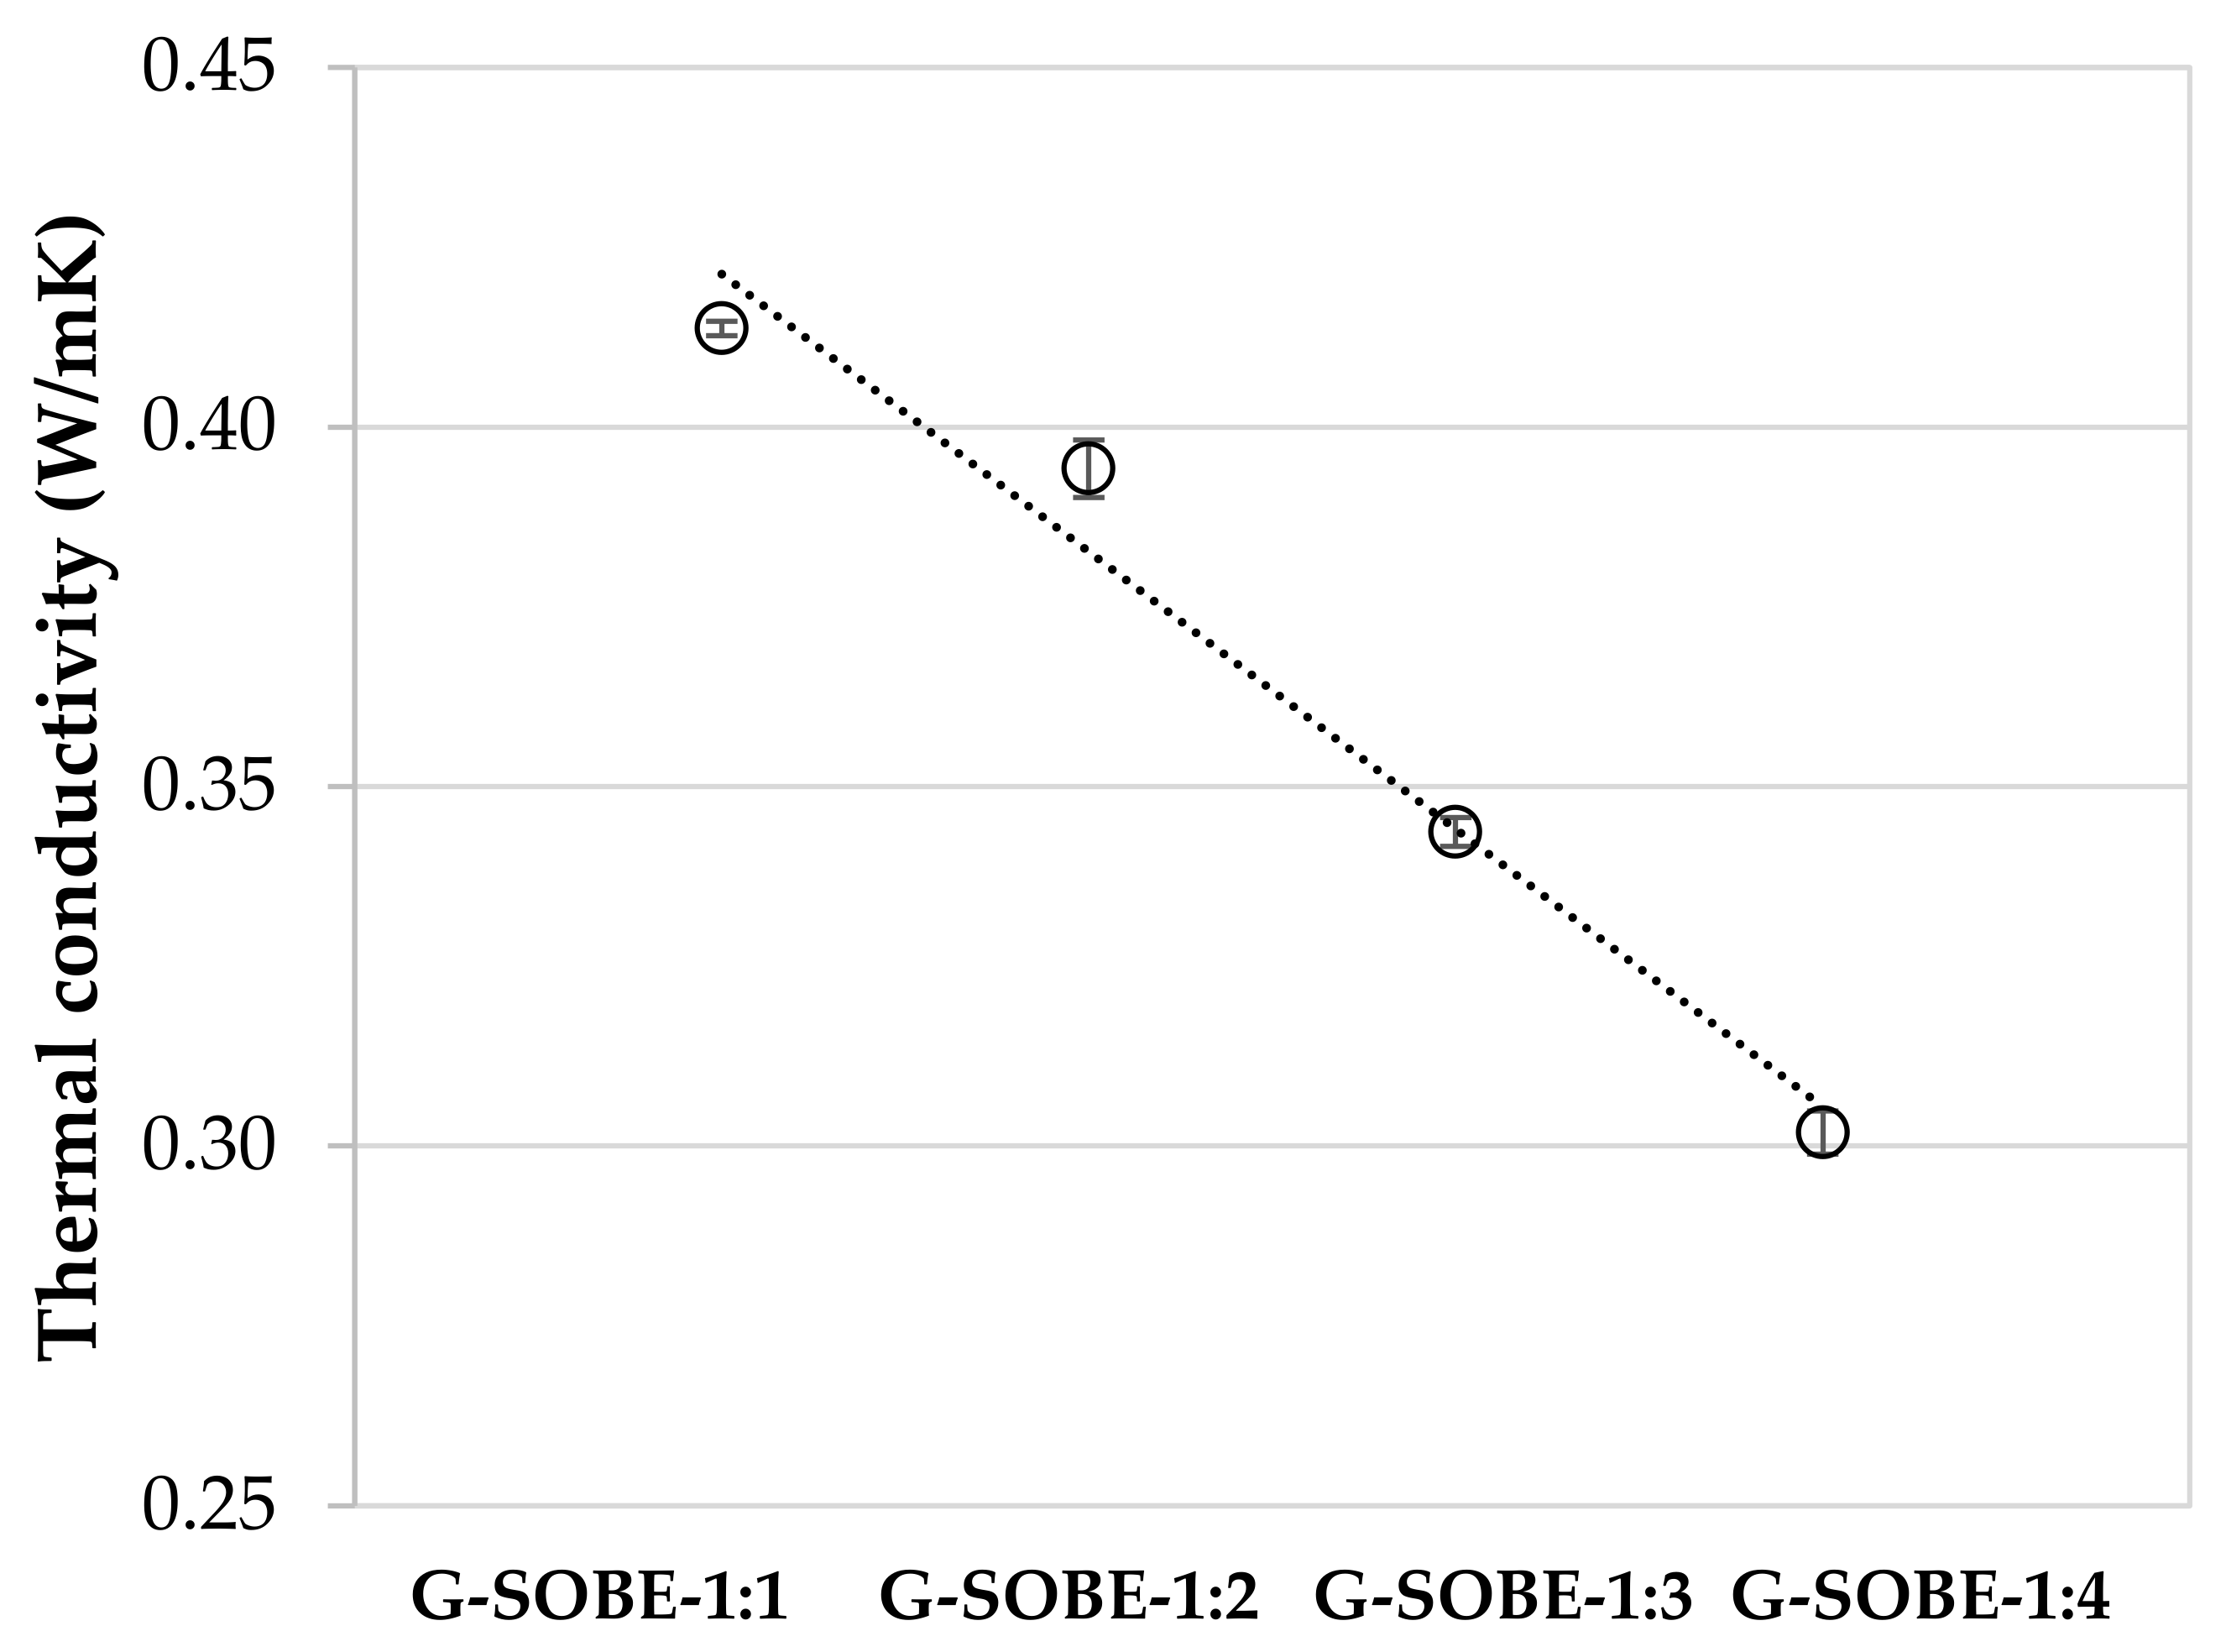 Figure 10. Thermal conductivity of samples cured for 28 days.
2.6. Microstructure of Geopolymer Binders
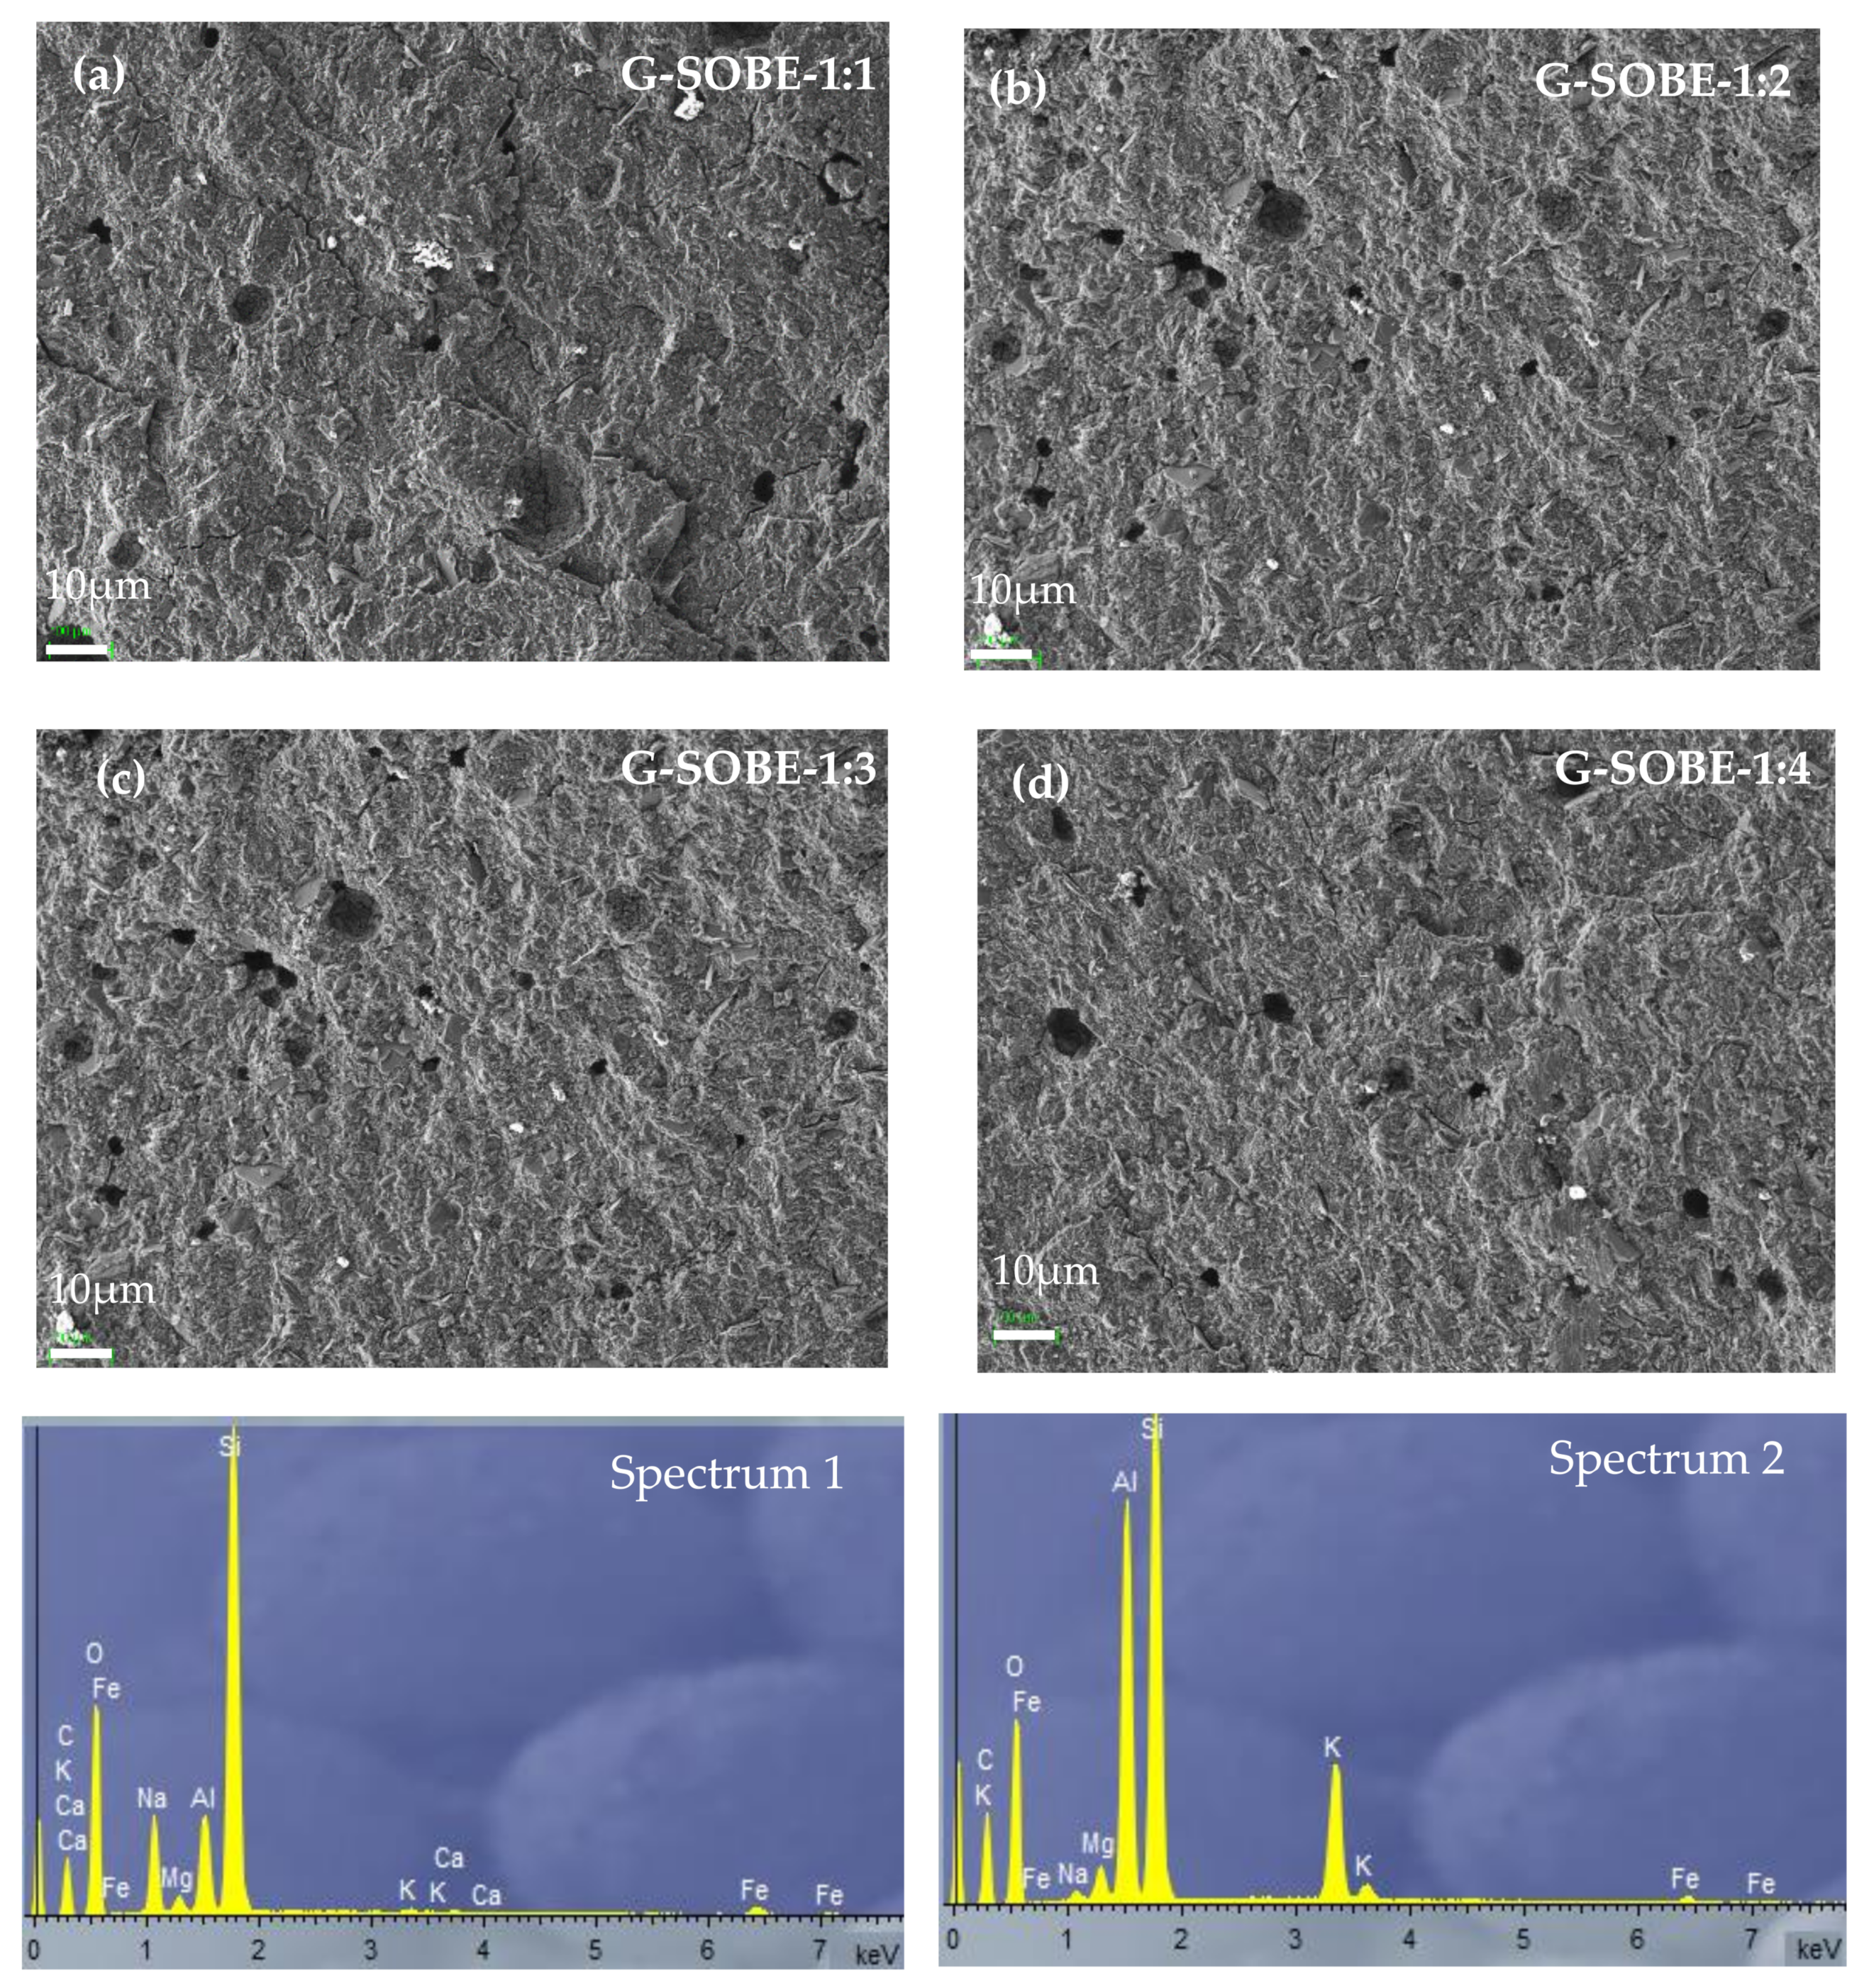 Figure 11. SEM micrographs (220× magnification) of geopolymers cured for 28 days. (a) G-SOBE-1:1; (b) G-SOBE-1:2; (c) G-SOBE-1:3; and (d) G-SOBE-1:4.
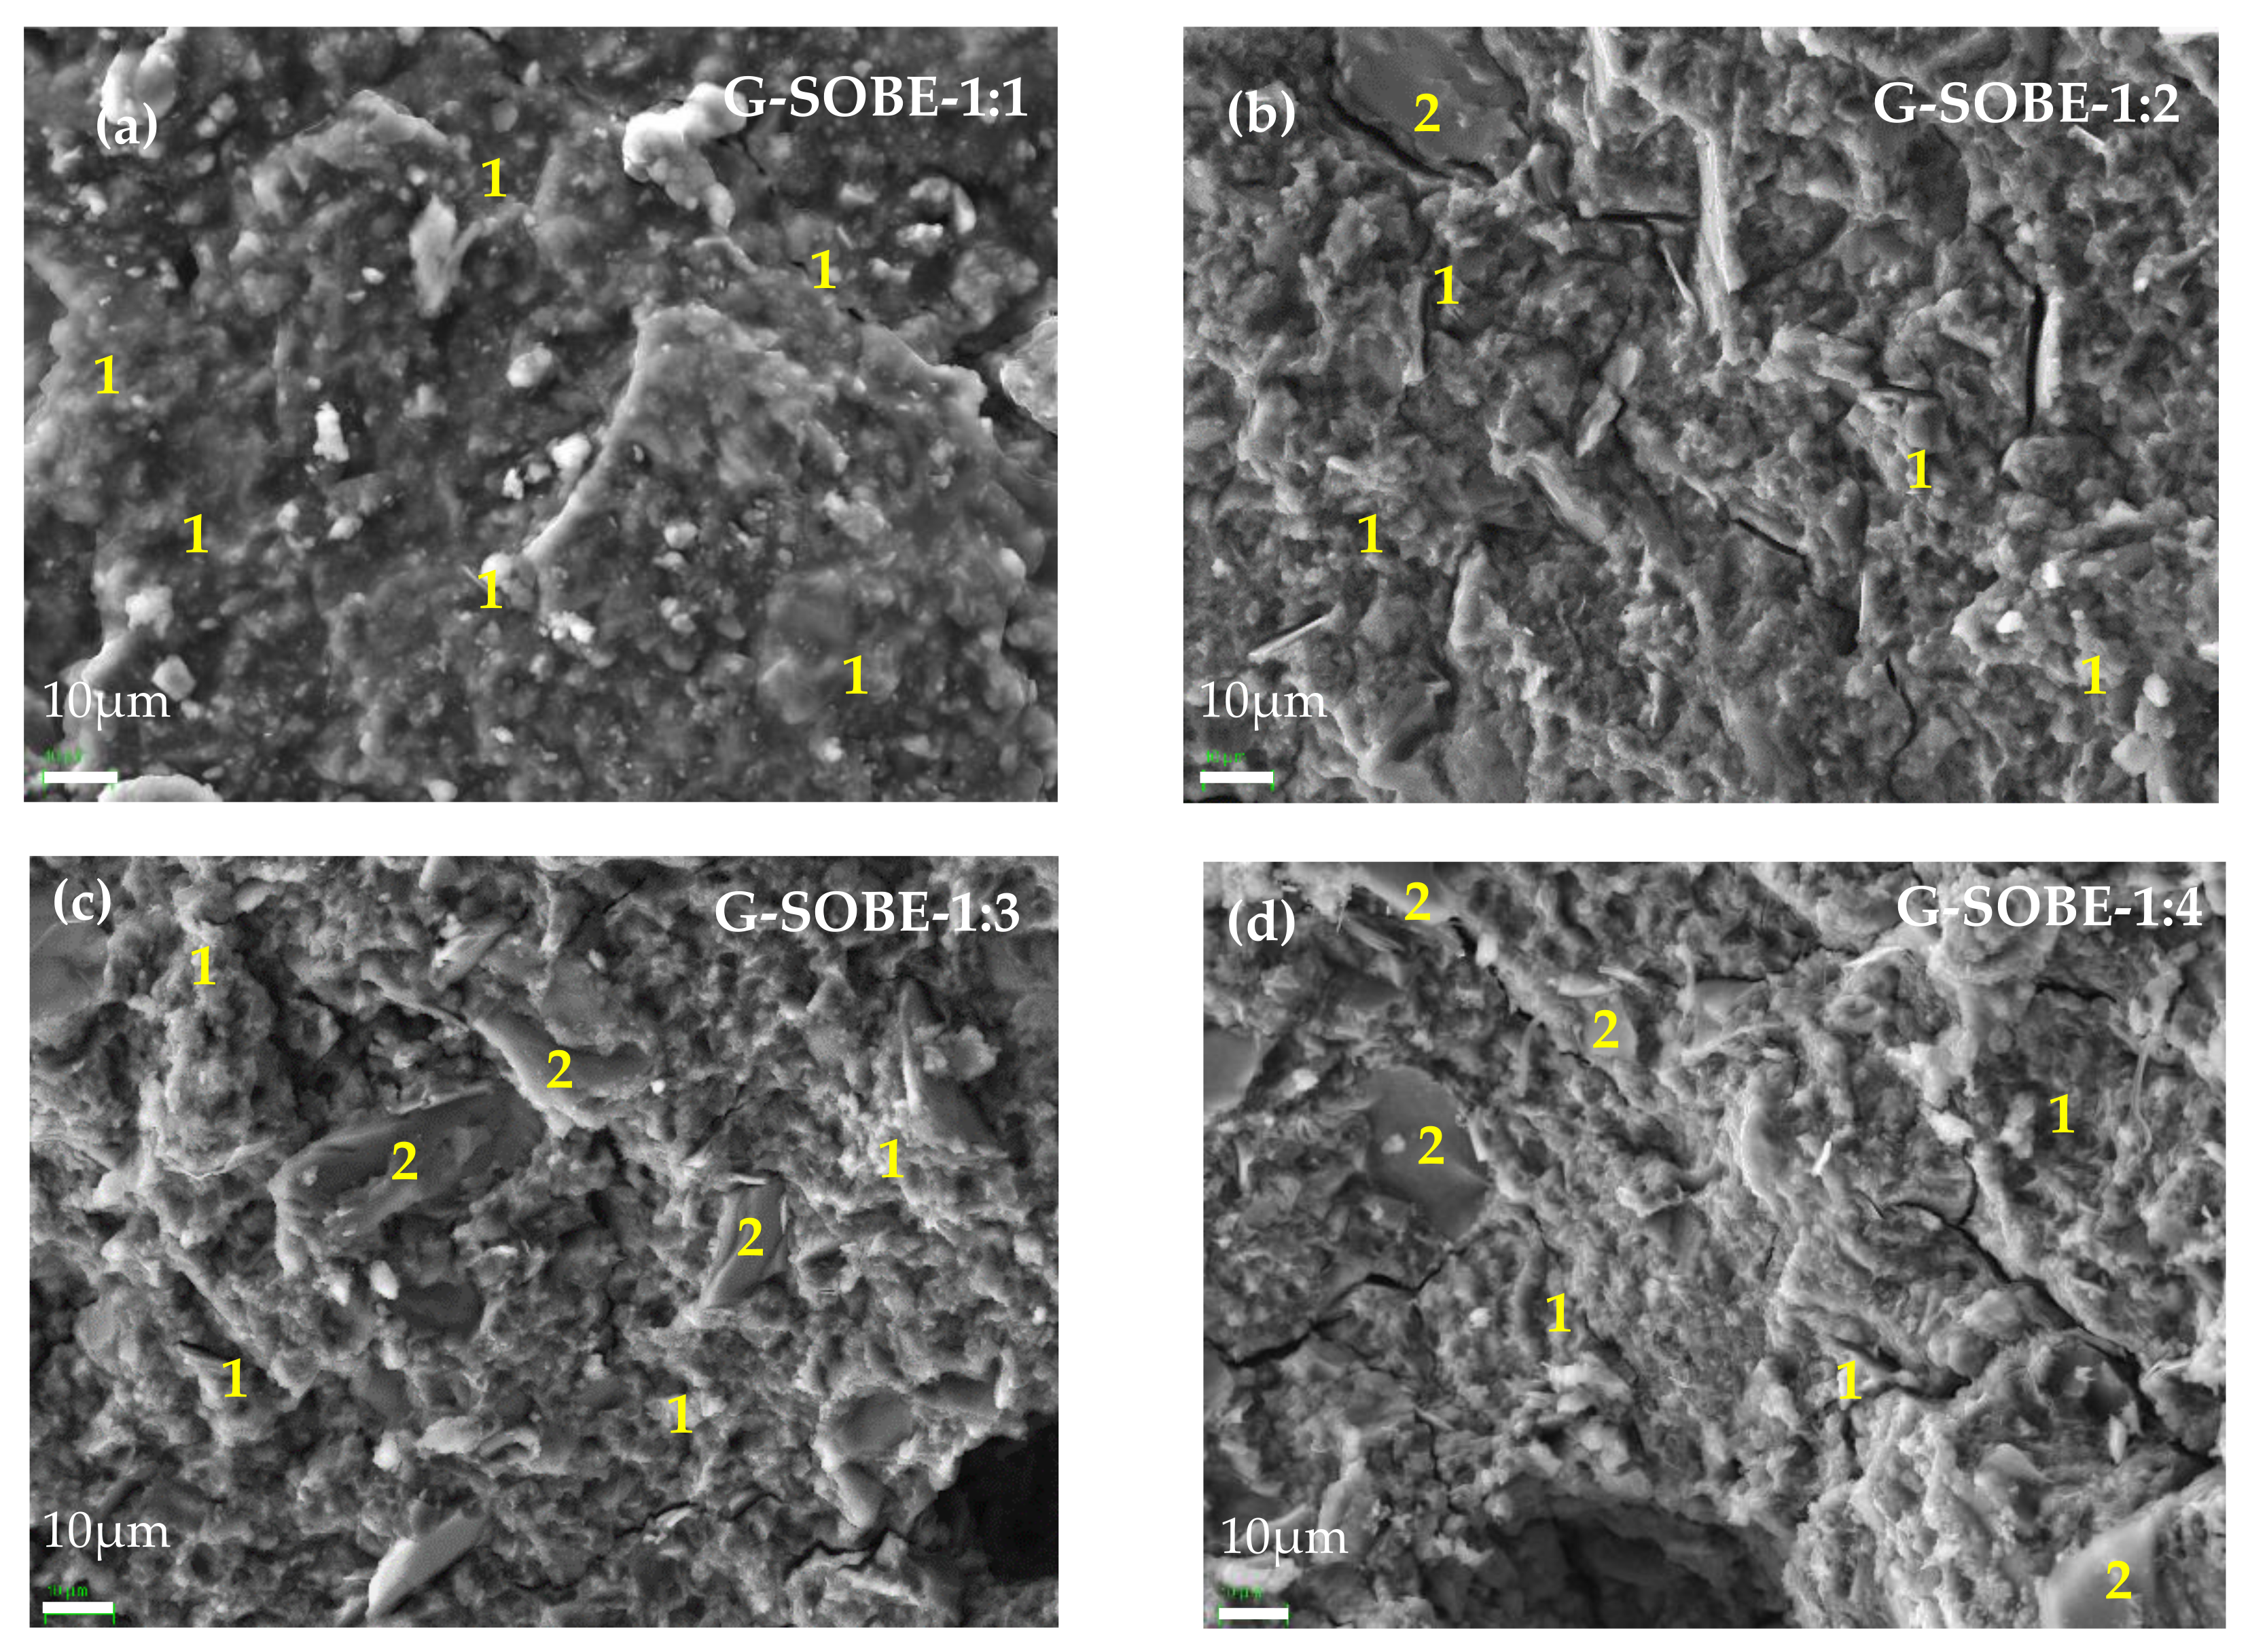 Figure 12. SEM/EDS micrographs (2000× magnification) of geopolymers cured for 28 days. (a) G-SOBE-1:1; (b) G-SOBE-1:2; (c) G-SOBE-1:3; and (d) G-SOBE-1:4.
3. Conclusions
This entry is adapted from the peer-reviewed paper 10.3390/su13137501
References
- Tang, J.; Mu, B.; Zheng, M.; Wang, A. One-Step Calcination of the Spent Bleaching Earth for the Efficient Removal of Heavy Metal Ions. ACS Sustain. Chem. Eng. 2015, 3, 1125–1135.
- Tang, J.; Mu, B.; Wang, W.; Zheng, M.; Wang, A. Fabrication of manganese dioxide/carbon/attapulgite composites derived from spent bleaching earth for adsorption of Pb(ii) and Brilliant green. RSC Adv. 2016, 6, 36534–36543.
- Tang, J.; Mu, B.; Zong, L.; Zheng, M.; Wang, A. Facile and green fabrication of magnetically recyclable carboxyl-functionalized attapulgite/carbon nanocomposites derived from spent bleaching earth for wastewater treatment. Chem. Eng. J. 2017, 322, 102–114.
- Mana, M.; Ouali, M.S.; Lindheimer, M.; de Menorval, L.C. Removal of lead from aqueous solutions with a treated spent bleaching earth. J. Hazard. Mater. 2008, 159, 358–364.
- Kheang Loh, S.; James, S.; Ngatiman, M.; Yein Cheong, K.; May Choo, Y.; Soon Lim, W. Enhancement of palm oil refinery waste—Spent bleaching earth (SBE) into bio organic fertilizer and their effects on crop biomass growth. Ind. Crops Prod. 2013, 49, 775–781.
- Dijkstra, A.J. What to Do with Spent Bleaching Earth? A Review. J. Am. Oil Chem. Soc. 2020, 97, 565–575.
- Srisang, S.; Srisang, N. Recycling spent bleaching earth and oil palm ash to tile production: Impact on properties, utilization, and microstructure. J. Clean. Prod. 2021, 294, 126336.
- Eliche-Quesada, D.; Iglesias, F.A.C. Utilisation of spent filtration earth or spent bleaching earth from the oil refinery industry in clay products. Ceram. Int. 2014, 40, 16677–16687.
- Boey, P.-L.; Ganesan, S.; Maniam, G.P.; Ali, D.M.H. Ultrasound aided in situ transesterification of crude palm oil adsorbed on spent bleaching clay. Energy Convers. Manag. 2011, 52, 2081–2084.
- García-Lodeiro, I.; Fernández-Jiménez, A.; Blanco, M.T.; Palomo, A. FTIR study of the sol-gel synthesis of cementitious gels: C-S-H and N-A-S-H. J. Sol-Gel Sci. Technol. 2008, 45, 63–72.
- Zhang, G.; Ke, Y.; He, J.; Qin, M.; Shen, H.; Lu, S.; Xu, J. Effects of organo-modified montmorillonite on the tribology performance of bismaleimide-based nanocomposites. Mater. Des. 2015, 86, 138–145.
- Anh, H.N.; Ahn, H.; Jo, H.Y.; Kim, G.-Y. Effect of alkaline solutions on bentonite properties. Environ. Earth Sci. 2017, 76, 374.
- Provis, J.L.; Lukey, A.G.C.; Van Deventer, J.S.J. Do Geopolymers Actually Contain Nanocrystalline Zeolites? A Reexamination of Existing Results. Chem. Mater. 2005, 17, 3075–3085.
- Leong, H.Y.; Ong, D.E.L.; Sanjayan, J.G.; Nazari, A. The effect of different Na2O and K2O ratios of alkali activator on compressive strength of fly ash based-geopolymer. Constr. Build. Mater. 2016, 106, 500–511.
- Ibrahim, M.; Johari, M.A.M.; Rahman, M.K.; Maslehuddin, M. Effect of alkaline activators and binder content on the properties of natural pozzolan-based alkali activated concrete. Constr. Build. Mater. 2017, 147, 648–660.
- Toniolo, N.; Rincon, A.; Roether, J.; Ercole, P.; Bernardo, E.; Boccaccini, A. Extensive reuse of soda-lime waste glass in fly ash-based geopolymers. Constr. Build. Mater. 2018, 188, 1077–1084.
- Hanjitsuwan, S.; Hunpratub, S.; Thongbai, P.; Maensiri, S.; Sata, V.; Chindaprasirt, P. Effects of NaOH concentrations on physical and electrical properties of high calcium fly ash geopolymer paste. Cem. Concr. Compos. 2014, 45, 9–14.
- Glid, M.; Sobrados, I.; Ben Rhaiem, H.; Sanz, J.; Amara, A.B.H. Alkaline activation of metakaolinite-silica mixtures: Role of dissolved silica concentration on the formation of geopolymers. Ceram. Int. 2017, 43, 12641–12650.
- Hameed, A.M.; Rawdhan, R.R.; Al-Mishhadani, S.A. Effect of various factors on the manufacturing of geopolymer mortar. Arch. Sci. 2017, 1, 111.
- Xu, H.; Van Deventer, J.S.J. The geopolymerisation of alumino-silicate minerals. Int. J. Miner. Process. 2000, 59, 247–266.
- Hardjito, D.; Wallah, S.E.; Sumajouw, D.M.J.; Rangan, B.V. Fly Ash-Based Geopolymer Concrete. Aust. J. Struct. Eng. 2005, 6, 77–86.
- Huiskes, D.; Keulen, A.; Yu, Q.; Brouwers, H. Design and performance evaluation of ultra-lightweight geopolymer concrete. Mater. Des. 2016, 89, 516–526.
- Yun, T.S.; Jeong, Y.J.; Han, T.-S.; Youm, K.-S. Evaluation of thermal conductivity for thermally insulated concretes. Energy Build. 2013, 61, 125–132.
- Pan, Z.; Feng, K.N.; Gong, K.; Zou, B.; Korayem, A.H.; Sanjayan, J.; Duan, W.H.; Collins, F. Damping and microstructure of fly ash-based geopolymers. J. Mater. Sci. 2012, 48, 3128–3137.
- Albitar, M.; Ali, M.M.; Visintin, P.; Drechsler, M. Durability evaluation of geopolymer and conventional concretes. Constr. Build. Mater. 2017, 136, 374–385.
- Zhang, Z.; Provis, J.L.; Reid, A.; Wang, H. Mechanical, thermal insulation, thermal resistance and acoustic absorption properties of geopolymer foam concrete. Cem. Concr. Compos. 2015, 62, 97–105.
- Rashad, A.M.; Sadek, D.M.; Hassan, H.A. An investigation on blast-furnace stag as fine aggregate in alkali-activated slag mortars subjected to elevated temperatures. J. Clean. Prod. 2016, 112, 1086–1096.
