The Kingdom of Saudi Arabia (KSA) is a leading country worldwide in the prevalence of non-communicable diseases (NCDs), which alone can explain 73% of mortality in the country. In response to the heavy burden of NCDs, the Saudi Food and Drug Authority (SFDA), in collaboration with other government entities, developed a healthy food strategy (HFS) aimed at enhancing healthy lifestyles and reducing the intake of salt, sugar, saturated fatty acids (SSF) and trans fatty acids (TFA). The objectives of the HFS, to facilitate consumers’ identification of SSF and reduce the SSF and TFA content in food items, were addressed in collaboration with key stakeholders in the public and private sectors of the food industry. These reforms included voluntary and mandatory schemes to display nutrition information in food and beverage establishments, display allergens on food menus, encourage the adoption of front of pack nutrient labels (FoPNLs) on food products, ban the use of partially hydrogenated oils and establish limits for sodium composition in breads and selected food products.
1. Introduction
With the unparalleled rise in non-communicable diseases (NCDs) in the twenty-first century, efforts have been put towards generating dietary guidelines, promoting health counseling and enhancing consumers’ personal accountability [
1]. With time, health care and governmental agencies have identified the multifactorial social determinants of obesity, which also involve legal reforms, industrial manufacturing and preparation in food and beverage establishments [
2]. Recognizing their association with an increased risk of cancer, cardiovascular diseases, and overall mortality, sodium, added sugars, saturated fatty acids (SSF) and trans fatty acids (TFA) have been the main nutrients targeted in such policies and interventions [
3,
4,
5,
6]. The focus has been on increasing consumers’ awareness of their health hazards, facilitating their identification by consumers and reducing their content in food items [
2]. The United Kingdom (UK) set an example with an interdisciplinary multicomponent initiative to be followed with a salt-reduction program [
7]. This strategy included awareness campaigns for the public, as well as legal reforms with the industry and food establishments, which ensured gradual and sustainable reductions in sodium content. Despite the trends of increasing sodium consumption worldwide, this program succeeded in reducing sodium intake in the UK by 15% over 7 years [
7].
2. The HFS: Description of the Health Reforms
In 2017, the SFDA moved from setting individual regulations to conceptualizing the HFS, a wider strategy that aimed at improving nutritional and health indicators. While the SFDA took the lead in establishing the whole strategy, it collaborated with key governmental entities (e.g., the ministry of health, ministry of municipality, ministry of environment, water and agriculture, as well as the key ruler) and universities and ensured the buy-in of private entities such as food manufacturers and establishments. Components of HFS reforms included the elimination of industrial TFA and the reduction of the SSF content in food items, the empowerment and education of consumers and the enhancement of public awareness in partnership with food establishments and the food industry. Our research team reviewed HFS-related policies and surveillance reports published by the SFDA. Table 1 and the following section summarize the voluntary and mandatory schemes that were established under the HFS umbrella. The majority of regulations provided a grace period for collaborators between issuance and enforcement. During this time, the SFDA generated guidelines that were relevant to the regulations, implemented educational interventions to raise awareness among consumers and provided workshops for collaborators to discuss and clarify the regulations.
2.1. Display of Nutrition Information and Regulation of Juice Compositions in Food and Beverage Establishments
To empower individuals to make healthy decisions when eating out, the SFDA invited all food establishments in KSA (restaurants, hotels and coffee shops) in 2017 to display caloric information on their menus and to have their meals’ nutrient compositions available for each item in the establishment to answer customers’ inquiries [
34]. To make caloric information relevant to the consumers, menus also included the recommended caloric intake for adults and children. This voluntary approach, which progressed to a mandatory scheme in 2019, provided several options to food establishments to calculate the caloric content of the offered items: analysis in a certified food laboratory, use of a list of approved mobile applications and/or consultation with a licensed dietitian [
34]. The display of caloric content was the legislation that required the largest number of workshops across the KSA, because the food establishments found it challenging to calculate the nutrient composition of their meals. During these workshops, the food industry representatives expressed concern over the cost of the analysis of meals in laboratories. The SFDA, in its turn, developed a free website facilitating the calculation of nutrient composition [
35]. The display of food allergens on food establishment menus, enforced in the same year, aimed to empower consumers suffering from food allergies to make healthy choices and to prevent allergic reactions. This regulation, enforced in 2019, required food establishments to list 14 common food allergens on their menus [
36]. The SFDA also targeted juice shops and outlets with a regulation in 2020 that mandated the display of nutrient labels on juice products. This regulation controlled the preparation and nutrient composition of added sugars in fresh juices, nectars and fruit drinks [
37] (
Table 1).
2.2. Front of Pack and Back of Pack Nutrition Labelling
The difficulty of comprehending information on nutrition labels led many governmental agencies to adopt different types of labels allowing consumers to make quick and informed decisions while shopping [
38]. In 2018, the SFDA invited local and international manufacturers to join a voluntary pledge to apply front of pack nutrition labels (FoPNL) on prepackaged foods [
39,
40]. The recommended FoPNL featured the multiple traffic light (MTL), which uses red, amber and green colors to reflect elevated, moderate and low composition of selected nutrients, respectively [
41]. MTL was used for SSF and total fat content expressed per 100 g or per 100 mL. On the same topic of nutrient labeling, and as previous policies did not mandate the display of TFA, added sugar, total cholesterol and fiber on food products’ nutrition information [
28], a policy enforcing their display on the back of pack label on all food manufacturers was issued as part of the HFS [
42]. During the grace period, when discussing the reforms with the SFDA, food manufacturers were concerned about the lack of time to analyze and display the additional nutrients. The SFDA hence provided several extensions before enforcing this legislation.
2.3. Trans Fatty Acid Regulations
Following up on the TFA limits enforced in 2017, the SFDA decided to ban all partially hydrogenated oils (PHO) for use in food manufacturing. The SFDA signed a voluntary agreement with representatives of the food industry in 2018 [
29]. The SFDA supported the food industry by increasing the supply of healthy fats and oils in the market and by conducting workshops to educate manufacturers on strategies to replace PHO with healthier alternatives. In 2020, with the enforcement of this regulation, the KSA became the first country in the EMR to have a “best practice TFA policy” that imposed the elimination of industrially produced TFA in food products [
6].
2.4. Restricting Sodium Content in Food Items
In 2019, with the aim of reducing sodium content in food items, the SFDA enforced a limit of 1 g/100 g for breads and for ayran (a traditional yogurt drink rich in salt) on manufacturers [
43,
44]. This regulation was followed in 2019 with an invite from the SFDA to food manufacturers to abide by limits for sodium content for 22 processed food items, inspired by limits set by Public Health England [
45,
46]. During educational workshops, small-scale bakeries expressed concerns on how to modify the content of breads without affecting their stability. SFDA supported these manufacturers by providing them with relevant recipes.
2.5. Sin Tax on all SSB
After the implementation of a flat tax on carbonated and power beverages, the GZAT, in collaboration with SFDA and under the umbrella of the HFS, extended the tax to include all SSB including flavored sweetened milk, juices, etc. [
47]. The flat tax, enforced in 2019, involved a 50% tax on all SSB and carbonated beverages compared to a 100% tax on energy drinks.
2.6. Educational Campaigns
Several educational campaigns were launched by the SFDA, as part of the HFS, to promote healthy diets among consumers. Some of these campaigns were implemented in the workplace. The first initiative targeted food establishments in governmental and non-governmental agencies to increase fiber intake and to reduce SSF and TFA intake in the served meals and beverages. This campaign, initiated in 2019, involved a ban on the sale of carbonated beverages and the use of palm and coconut oil in food preparation, encouraged healthy cooking methods, replaced juice drinks with fresh drinks and included labels on sugar and salt packets with the WHO-recommended daily limits for the establishments adopting it. It also encouraged the wider availability of fiber-rich food sources and low-salt alternatives and the inclusion of healthy alternatives for sweets in their menus. Corporate food establishments across the KSA interested in this initiative were invited to sign up with the SFDA and implement it in their corporate restaurants and coffee shops. Another initiative in the workplace was recently launched as a collaboration between the Food and Agriculture Organization (FAO) and the SFDA to celebrate the fruit and vegetable (F&V) year [
48]. This initiative, launched in April 2021, aimed at increasing the awareness of the health benefits of F&V in the workplace and the importance of limiting their waste. It involved sharing nutrition-education material and infographics via email and on screens in the firms. It also promoted the distribution of F&V to the offices and making them available in the areas where breaks are taken. This campaign encouraged corporate food establishments to include more F&V options on their menus, incorporate the logo for the international year for F&V on products produced in the food establishments, such as coffee cups and juices. Funding for these campaigns had to be done by the firms themselves.
Another campaign focused on food establishments providing delivery services. It incorporated a limit for calories, sodium, added sugar and the total fat composition of meals, as well as a reduction in portion sizes. This campaign targeted consumers by designing and distributing a guide for healthy meals allowing them to assess how healthy a meal is by comparing its composition to the WHO recommendations. Establishments that had meals that abided by the set limits were granted the privilege by the SFDA to label the meal as a “Balanced Meal”. In addition to these campaigns, the SFDA lead several initiatives to educate the public on healthy-eating habits via live events and through their social media networks.
Table 1. Regulations and pledges of the Healthy Food Strategy.
3. Assessment of the HFS Acceptance and Implementation
To monitor the compliance rates with the HFS reforms, the SFDA conducted a series of surveillance campaigns. These surveillances were either conducted in the city of Riyadh, the capital of the KSA, to provide preliminary insight or at the national level across five regions in the kingdom. Non-compliance with the mandatory regulations was treated as a legal violation by the SFDA. As for the non-mandatory, voluntary pledges, poor compliance was addressed by the SFDA with encouragement to comply with recommendations.
3.1. Assessment of Nutrient and Allergens Information in Food Establishments
National inspection campaigns monitored the compliance of food establishments with the HFS regulations. The first campaign conducted in 2019, targeted food establishments (restaurants, coffee shops, ice cream shops, fresh juice shops, corporate cafeterias and bakeries), assessing if they calculated nutrients and displayed calories on their menus. Inclusion criteria included food outlets with five or more branches in KSA. Data collected on 1363 establishments revealed that 27% did not display caloric content; 25% had incomplete display of caloric content, and 19% had incorrect calculation. A similar national campaign conducted in the same year assessed the compliance of food establishments with the display of food-allergen information. Findings revealed that 37% were not compliant with declaring food allergens on their menus. Finally, surveillance assessing restaurants, juice and coffee shops’ compliance with the juices regulation was conducted in 2020. Results showed that 60% of establishments did not display calories on the food menus and/or used sweeteners in the preparation of fresh juices.
3.2. Front of Pack Nutrition Labels Evaluation
A year after inviting manufacturers from the private sector to join the voluntary pledge to include FoPNL on their products, the SFDA assessed products for the availability and the type of FoPNL employed. In the period extending from March 2019 until March 2020, the SFDA surveilled food products through a secondary data analysis of a dataset that it managed with information and pictures on food and beverage products available in the Saudi market. Products that included FoPNL were included. Exclusion criteria included product duplicates and those that had different flavor and/or size. Data were collected on the name and brand of the product, food category, type of FoPNL employed, manufacturing company type (local or international) and nutrient composition (SSF content). Products from 4335 companies were screened and 80 companies (1.8%) had FoPNL on 119 unique products. Beverages were most likely to have FoPNL (30% of analyzed products), followed by dairy products (23%) and confectionaries (13%) (
Supplementary Table S1). Most companies employed Guidelines Daily Allowance (63%), followed by MTL (36%), and a Health Star Rating (1%). It is worth noting that the majority of products that displayed MTL had a low content of salt, saturated fat and total fat. The sugar content of these products was mostly moderate (40% of products) and elevated (42% of these products). Most of the products using MTL (65%) were compliant to the SFDA recommendation of displaying the FoPNL per 100 g or mL.
3.3. Surveillance of the Sodium Content in Breads and Food Products
The SFDA conducted national surveillance in 2019 after the regulation on sodium limits in breads was enforced. It involved an assessment of the nutrition label of bread products in bread factories, automatic bakeries and semi-automatic bakeries. The results revealed that, out of the 297 products assessed, 85% were compliant with the advised sodium limit of 1%.
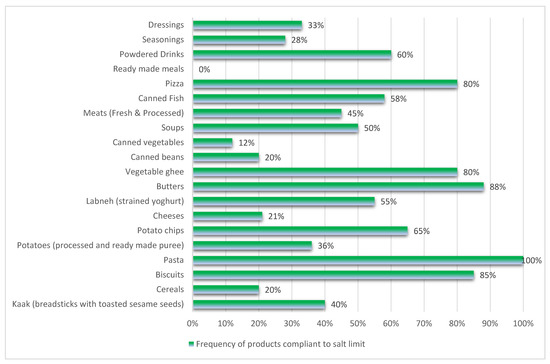
To monitor the compliance of food producers with the salt-limit recommendations set by the SFDA, a surveillance of food products available in supermarkets was conducted in the city of Riyadh in October 2020. Compliance was evaluated by comparing the products’ sodium composition from the nutrition labels in three supermarkets. These supermarkets were selected as they were the most visited supermarkets in the capital. Products (n = 267) were assessed, and 261 were included from 21 food categories, with 47% found to be compliant with the relevant SFDA recommendations. Compliance ranged from 0% for ready-made meals to 100% for pasta products. Kaak (breadsticks with toasted sesame seeds), cereals, potatoes, cheeses, canned beans and vegetables, meats (fresh and processed), ready-made meals, seasonings and flavorings had more than 50% of their products exceed the sodium limit sat by the SFDA (Figure 1). There were variations in compliance rates within some groups. For example, within the meat group, all fresh ground meat items were compliant with the sodium limits, whereas 25–50% of pastries prepared with meats, hamburgers and all of the processed meats were non-compliant with the SFDA sodium recommendations. Within the labneh group, 80% and 25% of full-fat and low-fat labneh products, respectively, were compliant with the sodium limits.
Figure 1. Frequency of products compliant with the salt limit.
This entry is adapted from the peer-reviewed paper 10.3390/nu13072130