2. Dietary Lipids and Bone Health
Several epidemiological studies suggest that large amounts of fat, especially those containing primarily saturated fatty acids (SFA), may have negative effects on bone health contributing to reduce bone density and increased fracture risk, in older as well as younger people [
29,
30,
31]. That these effects are large enough to increase fracture risk among older individuals is indicated by a study assessing 6250 postmenopausal women [
32]. Most of the studies evaluating the role of dietary lipids in bone health using animal models have focused on the effects of high fat diets (HFD) that mostly were rich in saturated fatty acids (SFA-HFD) based in lard or beef tallow (). Most of them have reported lower values of bone mineral content (BMC) and/or BMD in SFA-HFD-fed animals from 8 to 38 weeks in comparison with those receiving normolipid diets [
33,
34,
35,
36,
37]. Moreover, these HFDs were able to affect bone health if they were supplied during development [
16,
38,
39,
40,
41,
42,
43], but also in adult and aged animals. Regarding bone microarchitecture parameters most of studies described a lower quality in animals fed SFA-HFD compared with those maintained on standard diets [
16,
33,
40,
42]. Lastly, structural consequences of consuming HFDs also have been reflected in biomechanical properties of the evaluated bones [
16,
44]. Likewise, feeding on a HFD for 20 weeks led to lower values of cancellous BMC and bone strength respect than a low-fat diet in adult (40-week-old) rooster fed in such diets respect than a low-fat diet. However, no effects of the amount of dietary fat on mature cortical bone mechanical properties, geometric structure or BMC were observed [
45]. Taken together, these reports indicate that HFD have negative effects on bones in rodents at different ages. In addition, these results in confirmed that dietary fat also affect bone health in animals as in humans, indicating that animal models are useful for mechanistic studies regarding the effects of total fat on bone health. shows animal studies regarding high-fat diets and bone.
Table 1. Studies in animal models investigating the role of high-fat diet on bone tissue.
| Model; Age |
Experimental Diet vs. Control Diet;Duration |
Main Changes vs. Control Diet |
Ref. |
| Growing animals |
| Male Wistar rat; 3 wks |
SFA-HFD al (40%E beef tallow) vs. SD al (AIN-93G with soybean oil asa fat source); 8 wks |
- ↓
-
BMC, BMC/bw, BMD of spine and BV/TV of tibia
- ↑
-
Serum t-ALP and b-ALP levels
|
[38] |
| n-6 PUFA-rich HFD al (40%E soybean oil) vs. SFA-HFD al (40%E beef tallow); 8 wks |
- ↓
-
BMD of spine
- ↓
-
Serum b-ALP levels
|
[38] |
| n-6 PUFA-rich HFD al (40%E corn oil) vs. SFA-HFD al (40%E beef tallow); 8 wks |
- ↓
-
Serum b-ALP levels
|
[38] |
| n-3 PUFA- rich HFD al (40%E linseed oil) vs. SFA-HFD al (40%E beef tallow); 8 wks |
- ↑
-
BV/TV of tibia
|
[38] |
| n-3 PUFA- rich HFD al (40%E linseed oil) vs. SD al (AIN-93G with soybean oil as fat source); 8 wks |
- ↑
-
Serum b-ALP levels
|
[38] |
| Male Wistar rats; Weanling |
MUFA-rich SD al (AIN-93 diet with 9.5%E extra virgin olive oil) vs. n-6 PUFA-rich SD al (AIN-93 diet 9.5%E sunflower oil); 6 m |
- ↑
-
Serum osteocalcin
|
[46] |
| MUFA-rich SD al (AIN-93 diet with 9.5%E extra virgin olive oil) vs. n-6 PUFA-rich SD al (AIN-93 diet 9.5%E sunflower oil); 6 m |
- ↑
-
BMD of femur
- ↑
-
Serum OPG
|
[46] |
| MUFA-rich SD al (AIN-93 diet with 9.5%E extra virgin olive oil) vs. n-6 PUFA-rich SD al (AIN-93 diet 9.5%E sunflower oil); 24 m |
- ↓
-
Alveolar bone loss of mandibule
|
[47] |
| n-3 PUFA-rich SD al (AIN-93 diet 9.5%E fish oil); vs. n-6 PUFA-rich SD al (AIN-93 diet 9.5%E sunflower oil); 24 m |
- ↓
-
Alveolar bone loss of mandibule
|
[47] |
| MUFA-rich SD al (AIN-93 diet with 9.5%E extra virgin olive oil) vs. n-3 PUFA-rich SD al (AIN-93 diet 9.5%E fish oil); 24 m |
- ↓
-
Alveolar bone loss of mandible
|
[47] |
| Male Sprague-Dawley rats; Weanling |
HFD al (AIN93G with added 70 g/kg of safflower oil + menhaden oil) with n-6/n-3 PUFA ratio = 23.8, 9.8 2.6 or 1.2; 42 d |
- ↑
-
Activities of serum ALP isoenzymes, including b-ALP with lower with n-6/n-3 PUFA ratios
|
[48] |
| Female Sprague Dawley rats; 4 wks |
HFD al (12wt% tuna oil) vs. HFD al (12wt% corn oil); 8 wks |
- ↑
-
BMD and BMC of tibia
- ↑
-
Bone microarchitecture quality of tibia
- ↑
-
Serum osteocalcin
|
[39] |
| HFD al (12wt% flaxseed oil) vs. HFD al (12wt% corn oil); 8 wks |
- ↑
-
Bone microarchitecture quality of tibia
- ↑
-
Serum osteocalcin
|
[39] |
| HFD al (12wt% menhaden oil) vs. HFD al (12wt% corn oil); 8 wks |
- ↑
-
Bone microarchitecture quality of tibia
- ↑
-
Serum osteocalcin
|
[39] |
| Male C57BL/6J mice; 5 wks |
SFA-HFD al (60%E lard) vs. SD al (D12450B chow with 10%E fat); 12 wks |
- ↓
-
BV/TV of femur and tibia
- ↓
-
Bone microarchitecture quality of femur and tibia
- ↓
-
Stiffness and maximal load of Femur and tibia
- ↓
-
Adipocyte size and adipocyte volume/BV in tibia
- ↓
-
Adipogenic formation in isolated MSCs from femoral bone
- ↓
-
N.Oc/Tb.Ar and Oc.S/BS of tibia
- ↓
-
TRAP-positive osteoclast formation in isolated MSCs from femoral bone
|
[40] |
| Male C57BL/6J mice; 6 wks |
SFA-HFD al (60%E lard) vs. SD al (LabDiet 5LOD with 13.5% E lard); 20 wks |
- ↓
-
BMC, BV/TV of femur and tibia
- ↓
-
Bone microarchitecture quality of femur and tibia
- ↓
-
Maximun load, total work, yield load and post yield work of femur
- ↑
-
bone marrow adipose tissue volume at epiphysis of tibia and distal tibia
|
[16] |
| Male C57BL/6J mice; 6 wks |
SFA-HFD al (60%E lard) vs. SD al (12%E fat); 12 wks |
- ↑
-
bone marrow adiposity, adipocyte size and adipocyte no. at femur
|
[41] |
| Male C57BL/6 mice; 4 wks |
SFA-HFD al (21.2%E lard) vs. SD al (4.8%E fat); 13 wks |
- ↓
-
Plasma levels of P1CP
- ↑
-
plasma levels of NTX
- ↓
-
Gene expression of osteoblastogenesis specific genes (OCN and COL1a1) and MMP1a in femur and bone marrow
- ↑
-
Gene expression of osteoclastogenesis specific genes (NOX2 and RANK) and MMP9 in femur and bone marrow
|
[49] |
| Male BALB/cByJ mice; 7 wks |
SFA-HFD al (45%E lard) vs. SD al (13.5%E fat); 15 wks |
- ↓
-
BMD, cortical BV/TV, trabecular BV/TV of femur
- ↓
-
Bone microarchitecture quality of femur
|
[42] |
| Male Wistar rats; 9 wks |
SFA-HFD al (24% fat with 100 g/kg of bw per day of ground nut and 50 g/kg of bw per day dried coconut) vs. SD al; 38 wks |
- ↑
-
BMD, BMC, cross-sectional area and BV/TV of tibia
- ↑
-
Bone microarchitecture of tibia
- ↑
-
Serum t-ALP levels
|
[50] |
| Male Sprague-Dawley rat; 40 d |
SFA-HFD al (20wt% coconut oil) vs. n-3 PUFA-HFD al (20wt% flaxseed oil) or n-6 PUFA-HFD al (20wt% safflower oil); 65 d |
- -
-
No differences in femur BMD
- -
-
No differences in biomechanical strength properties
- ↓
-
Femur peak load adjusted by bw
|
[51] |
| Newly hatched chicks; 4 d |
n-3-rich PUFA diet al (menhaden oil + safflower oil at 90 g/kg) vs. n-6-rich PUFA diet al (soybean oil + safflower oil at 90 g/kg); 17 d |
- ↑
-
Fractional labeled trabecular surface
- ↑
-
Tissue level bone formation rates
- ↑
-
Serum ALP activity
|
[52] |
| Adult animals |
| Male Sprague-Dawley rat; 200 g |
Cholesterol-enriched HFD al (10.0 g cholesterol, 20.0 g sodium-cholate, and 112.0 g crude fat %per kg dry matter) vs. SD al (50.83 g crude fat %per kg dry matter); 114 d |
- ↑
-
Serum b-ALP
- ↓
-
Bone calcium loss
|
[35] |
| Male F344 × BNF1 rats; 12 m |
n-3 PUFA-rich diet (167 g safflower oil + 33 g menhaden oil) vs. n-6 PUFA-rich diet (200 g safflower oil) or n-3 + n-6 PUFA-rich diet (190 menhaden oil + 10 g corn oil); 20 wks |
- ↑
-
BMC and cortical + subcortical BMD
- ↑
-
serum b-ALP activity
- ↑
-
serum pyridinoline
- ↑
-
urinary Ca
|
[53] |
| Male F344 × BNF1 rats; 12 m |
n-3 PUFA-rich diet (167 g safflower oil + 33 g menhaden oil) vs. n-6 PUFA-rich diet (200 g safflower oil) or n-3 + n-6 PUFA-rich diet (190 menhaden oil + 10 g corn oil); 20 wks |
- ↑
-
Peak load, ultimate stiffness and Young’s modulus
- ↓
-
Bone formation rate
- ↓
-
Osteoclast no. and eroded surface in proximal tibia
- ↑
-
Periosteal mineral apposition and formation rates in tibia shaft
|
[44] |
| Male C57BL/6J mice; 8 wks |
SFA-HFD al (35wt% lard) vs. SD al (6wt% fat); 20 wks |
- ↓
-
Recruitment of progenitor cells to osteoblastic cells
- ↓
-
Mineral apposition rate in tibia and vertebrae and bone formation rate tibia
- ↑
-
Bone marrow adiposity, adipocyte size and adipocyte no. of proximal tibia
- ↓
-
Trabecular BM and cortical thickness
- ↓
-
Serum levels of P1NP but not CTX-1
- ↓
-
Percentage of CD73+ and Sca1/CD140a+ cells in MSCs isolated from bone marrow
- ↓
-
Short-term proliferation rate and colony-forming units-fibroblast of primary cultures
- ↑
-
Gene expression of adipogenic genes (Pparγ2, Lep, Adipoq, Fsp27)
- ↑
-
b-ALP activity in osteoblast differentiated of isolated MSCs isolated from bone marrow
|
[54] |
| Male C57BL/6 mice; 3 m |
HFD al (45%E) vs. SD al (12%E fat); 11 wks |
- ↑
-
Trabecular BMD and BV/TV of tibia
- ↑
-
Bone microarchitecture quality of tibia
- ↓
-
mineral apposition rate and bone formation rate in tibia
- ↓
-
Ec.MS/BS in tibia
- ↑
-
PmoI and Imax/Cmax in tibia
- ↓
-
Serum b-ALP
- ↑
-
Serum TRAP activity
|
[55] |
| Male C57BL/6J; 4 m |
HFD al (45%E) vs. SD al (11%E fat); 8 wks |
- ↑
-
Bone marrow adiposity and adipocyte size of distal femur metaphysis
|
[56] |
| Female C57BL/6J mice; 8 m |
SFA-HFD al (45%E lard) vs. SD al (10%E fat); 8 wks |
- ↓
-
BMD and BMC of femur
|
[33] |
| |
MUFA-rich HFD al (45%E olive oil) vs. SFA-HFD al (45%E lard); 8 wks |
- ↑
-
BV/TV of femur
- ↑
-
Tb.Th of femur
|
[33] |
| Female C57BL/6J mice; 13 m |
n-6 PUFA-rich HFD al (19.5%E corn oil) al vs. SD al (9.5%E fat); 26 wks |
- ↑
-
Gene expression of PPARγ at bone marrow adipocytes of femur
- ↑
-
Bone marrow adiposity at femur
|
[57] |
| |
n-3 PUFA-rich HFD al (19.5%E fish oil) vs. n-6 PUFA-rich HFD al (19.5%E corn oil); 26 wks |
- ↓
-
Adipocyte vacuole area of femur
- ↓
-
Gene expression of PPARγ at bone marrow adipocytes of femur
|
[57] |
| Roosters; 40 wks |
HFD al (8% palmitic acid) vs. LFD al (8% cellulose); 20 wks |
- ↓
-
cancellous BMC of femoral condyles and tibial plateau
- ↓
-
mechanical properties (bone strength) of the cancellous bone of femoral condyles and tibial plateau
- -
-
No differences in cortical bone mechanical properties, geometric structure or BMC of tarsometatarsus
|
[45] |
| C57BL/6 mice |
Cholesterol-enriched HFD al (15.8wt% fat + 1.25wt% cholesterol) vs. SD al (6wt% fat), 7 m |
- ↓
-
BMD and BMC of femur and vertebral BMC
- ↓
-
Osteocalcin expression in bone marrow
|
[36] |
| C3H/HeJ mice |
Cholesterol-enriched HFD al (15.8wt% fat + 1.25wt% cholesterol) vs. SD al (6wt% fat), 7 m |
- -
-
No changes in BMD and BMC
|
[36] |
| Aged animals |
| OVX female Sprague Dawley; 3 m |
DHA-rich diets (HP5 and LP5) High-PUFA diet vs. low-PUFA diet with a ratio of n-6/n-3 PUFAs of 5:1 or 10:1 (110.4 g/kg of fat from safflower oil (110.4 g/kg of high-oleate safflower oil blended with n-3 PUFAs); 12 wks |
Fatty acid analyses confirmed that the dietary ratio of 5:1 significantly elevated the amount of DHA in the periosteum, marrow and cortical and trabecular bones of the femur.
- ↑
-
BMC and BMD of femur and tibia
- ↓
-
Rats fed the LP diets displayed the lowest overall serum pyridinoline and deoxypyridinoline
Serum osteocalcin was lowest in the HP groups.
Regardless of the dietary PUFA content, DHA in the 5:1 diets (HP5 and LP5) preserved rat femur BMC in the absence of estrogen |
[58] |
| OVX female C57BL/6J mice; 8 wks |
AIN-93 diet al (10%E virgin olive oil) vs. AIN-93 diet al (10%E refined olive oil); 4 wks |
- -
-
No differences in BMD, BV/TV and BMC
- -
-
No differences in Bone microarchitecture
|
[59] |
| |
|
Marrow stromal cells from C57BL/6 mice fed a high fat, atherogenic diet failed to undergo osteogenic differentiation in vitro |
[37] |
| Female Wistar rats; 56 m |
HFD al (31%E peanut + canola seed oil); 19 wks |
- ↓
-
Serum osteocalcin
|
[59] |
In most of the mentioned studies, it was reported that the SFA-HFD effects on BMD and bone microarchitecture correlated with decreased levels of different circulating bone formation biomarkers. These reduced biomarkers included serum osteocalcin [
59,
62,
63], serum procollagen type 1 amino-terminal propeptide (P1NP) and plasma carboxy-terminal propeptide of type 1 procollagen (P1CP) [
40,
63]. On other hand, increased levels of the bone resorption biomarkers plasma cross-linked N-telopeptides of bone type I collagen (NTx), urine pyridinoline (Pyr) and deoxypyridinoline (Dpyr) [
49,
63] were found compared to values observed in standard diet-fed animals.
The mentioned effects on bone remodeling processes are supported by other studies that found increased expression of osteoclast-specific genes [
49] in SFA-HFD-fed animals. In turn, serum RANKL levels were higher in the HFD-fed male C57BL/6 mice, although serum OPG levels were not altered [
62]. Moreover, a higher number of osteoclasts in trabecular bone area and osteoclast surface in bone surface [
40] as well as TRAP activity in serum were higher in SFA-HFD fed animals in comparison with those fed a standard diet suggesting that osteoclastogenesis was enhanced. Likewise, the numbers of colony forming units (CFU)-fibroblastic and CFU-ALP-positive and mineralization nodule in bone marrow stromal cells from male C57BL/6 mice fed a HFD were higher compared with animals fed a standard diet [
62]. Likewise, the osteoblast-specific genes including BGLAP2, COL1a1, FGF23 and IGFBP2 were markedly down-regulated [
63]. In addition, osteocalcin expression was reduced in bone marrow of HFD-SFA-fed C57BL/6 mice which suggest that these types of diets also reduce bone formation by blocking differentiation of osteoblast progenitor cells [
36]. Dietary fats may exacerbate the uncoupling of bone resorption and formation by inhibiting the formation of mature osteoblasts from their stromal progenitor cells, and enhancing adipogenesis [
64]. In this sense, histomorphometry of different bones from SFA-HFD-fed animals showed a significant increase in bone marrow adiposity [
16,
40,
41,
54,
56,
65], which seems the result of enhanced BMSCs towards adipocyte [
16,
40,
65] in detriment of osteoblastogenesis [
36,
37,
63].
However, some studies found higher values of BMD in SFA-HFD fed animals in comparison with a low-fat diet and standard diets [
50,
55]. Likewise, one of the studies reported higher values of trabecular BV/TB and trabecular and cortical thickness (Tb.Th) as well as lower values of Tb.Sp in comparison with standard diet-fed animals. In addition, this study indicates that the prolonged exposure to SFA-HFD decreases bone formation and probably overall bone turnover, which on one hand may protect from bone loss due to aging or estrogen deficiency but on the other hand may decrease bone quality and may predispose to fractures [
55]. Lastly, histomorphometric analyses results were in the same sense with lower values of endocortical mineralizing, surface, mineral apposition rate and bone formation rate [
55]. In these studies, the SFA-HFD fed animals had higher body weight than their respective controls and could generate greater mechanical load and favoring bone formation.
On the other hand, studies evaluating the role of dietary lipids in bone health from a qualitative standpoint have been also performed in aged male Wistar rats. When isoenergetic and normolipid diets using different fat sources (Virgin olive or sunflower oil) with clear differences on their fatty acid profile (MUFA or n-6 PUFA-rich) have been compared, it has been found that animals lifelong maintained on MUFA-rich diets had higher values of BMD in comparison with those fed n-6 PUFA-rich diets [
46]. A similar effect has been observed for the same animals in relation to alveolar bone loss at mandible [
47]. In contrast, if PUFA-rich diets are compared with SFA-rich diets, some benefits are also observed for PUFA. In this sense, the administration of supplement containing evening primrose oil (a good source of γ-linolenic acid as well as the n-6 PUFA acid linoleic acid) and fish oil (FO) to elderly women with osteoporosis or osteopenia prevented loss of BMD in the lumbar spine, and BMD in the femur, relative to control women receiving coconut oil, which is rich in SFA [
66]. However, in other study where control group receiving no supplemental fat, no effect of a combined evening primrose oil/FO supplement, although it was performed in younger post- and premenopausal women [
67]. Importantly, it seems that in PUFA-rich diets, the relative amounts of n-6 and n-3 PUFA, also plays an important role in relation to bone biology. In fact, several studies have shown that animals fed diets rich in n-3 PUFA, usually by adding FO, or with a lower n-6/n-3 ratio had higher BMC and BMD respect than those fed diets with a higher n-6/n-3 ratio [
39,
44,
53,
57]. Positive effects of the n-3 PUFA content of the diet also was supported by bone microarchitecture parameters of tibia and femur from growing rats [
39]. Moreover, higher activities of serum ALP isoenzymes, including b-ALP, were reported in weanling male Sprague-Dawley rats fed a AIN-93G diet high in n-3 PUFA by adding (70 g/kg) safflower oil and menhaden oil respect than those fed a diet with a lower n-6/n-3 PUFA ratio suggesting that the of n-3 PUFA on bone would be due, at least in part, to these fatty acids (FAs) stimulated bone formation in growing animals [
48]. This effect on bone formation is in consistency with other studies reporting a lower bone marrow adiposity in animals fed FO-rich diet in comparison with those fed corn oil-rich diet [
57]. Several studies indicate that when the differentiation process is directed toward adipocyte formation, osteoblast formation may be compromised [
64,
68,
69]. Activation of PPAR-γ by FAs, as well as a variety of linoleic acid peroxidation products, can induce adipogenesis and inhibit osteoblastogenesis in vitro [
70,
71,
72]. Therefore, some n-6 PUFA FAs can interact with PPAR-γ to inhibit differentiation of osteoblasts and promote differentiation of adipocytes.
In other animal models, results were in a similar sense but less clear. Piglets receiving a diet supplemented with the n-3 PUFA arachidonic acid (AA) and docosahexanoic acid (DHA) for 14 d had higher weight and greater BMD of the whole body, lumbar spine and femur, although no differences were observed in whole body length, calcium absorption or biochemical markers of bone metabolism [
73]. Likewise, newly hatched chicks fed menhaden oil and safflower oil enriched diet (90 g/Kg) had increased fractional labeled trabecular surface and tissue level bone formation rates compared with those fed a soybean oil-enriched diet, although no differences were found for BMC which correlated with the reduced serum ALP activity found [
52]. Lastly, in rapidly growing rabbits, feeding on FO-supplemented diet led to reduced tibial structural properties, smaller mid-diaphyseal areal properties and shorter tibiae in comparison with control diet in a pair-fed-fed regimen, but tibial stress at the proportional limit was not significantly affected [
74].
Interestingly, dietary supplementation with n-3 PUFA or maintaining a lower n-6/n-3 PUFA ratio in the diet also seem beneficial for bone health when animals were maintained on HFDs. In growing (6 weeks old) male C57BL/6 mice, an HFD for 6 months increased TRAP expression and decreased serum concentrations of osteocalcin and b-ALP. However, if FO was used as dietary fat source, at least in part (3–9%), serum TRAP decreased and higher bone mass was found. Importantly, animals receiving a lower amount of FO had higher femoral BV/TV, Tb.N. Conn.D. and bone mass of second lumbar vertebrae and lower femoral Tb.Sp. [
75]. In contrast, no differences in femur BMD or biomechanical strength properties were found in forty-day-old male Sprague–Dawley rats maintained for 65 days on HFDs containing coconut oil, flaxseed oil or safflower oil or a standard diet. Still, those fed high n-3 or high n-6 PUFA diets present stronger femur (as measured by peak load) than those of the standard chow-fed group, after adjustment for significant differences in body weight [
51]. This evidenced that n-3 and n-6 PUFA may be beneficial in appropriate amounts, but that diets with high concentrations of FAs may be detrimental during development and in advanced age [
48,
74,
76,
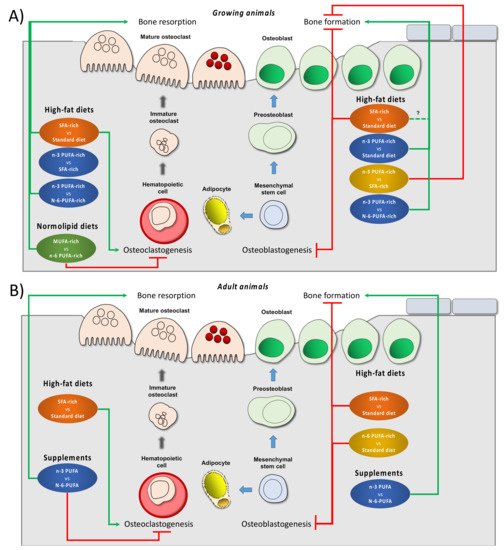
77]. More research to determine amounts of individual FAs, ratios among the FAs and interactions with other dietary constituents across the life span is needed before recommendations appropriate to different ages can be made. represents the effects of different diets on bone biology reported in growing and adult animal models.
Figure 1. Effect of different dietary interventions concerning dietary fat on bone biology and metabolism reported in growing (A) or adult (B) animal models. The effects refer changes respect than control diet (indicated after the term vs. in any case) which depend on each study design. Dietary interventions have been subdivided in two categories, high fat diet that, in turn, can be rich in different fat types or supplements with specifical fat types. Green arrows indicate induction in the particular process. Red truncated lines indicate a decrease in the particular process. Abbreviations: MUFA: monounsaturated fatty acids; n-3 PUFA: n-3 polyunsaturated fatty acids; n-6 polyunsaturated fatty acids; SFA: saturated fatty acids, vs.: versus.
Despite results found in preclinical studies, only three randomized clinical studies evaluating the effect of nutritional interventions involving dietary fat on bone health were available in PubMed database. Notwithstanding, a search conducted in clinicaltrials.gov database identified a total of nine registered clinical trials on this topic. Main results of the mentioned studies are shown in . Most of studies addressing the role of HFD or LFD in human bone metabolism was mainly carried out in the context of a hypocaloric diet maintained for a period of one or two years. However, in contrast to animal studies, all these dietary interventions were performed in middle-aged adults and older people. Among these types of interventions, most of the studies found no differences in BMC and BMD as well as in serum bone turnover markers between individuals receiving a HFD and those receiving a standard diet [
78,
79] or LFD [
80]. In contrast, higher BMC and BMD were reported in women consuming a normocaloric LFD (<28%E from fat) respect than those following a standard diet (30%E from fat). Interestingly the last study was initiated in young adults and had a duration of 9 years [
81]. The differences between this last one and the previous studies could be also explained because caloric restriction is, by itself, a dietary intervention that has shown a significant reduction of BMC and BMC values in humans with an increase in serum CTX-1 and TRAP and a decrease in b-ALP suggesting that bone resorption was enhanced in detriment of bone formation [
82], which could mask the potential role of fat in bone health. Thus, more research evaluating the role of HFD in an isocaloric diet context is necessary.
In the same way, there are 12 additional human studies evaluating dietary lipid role in bone health from a qualitative standpoint. In this context, most of the clinical trials addressing n-3 PUFA supplementation effects on bone biology in older people reported no changes in serum OPG, RANKL, OPG/RANKL ratio, b-ALP, osteocalcin, CTX-1, NTx and calcium levels as well as urinary Pyr, Dpyr and Pyr/Dpyr ratio when they are compared with values obtained in individuals supplemented with n-6 PUFA [
83,
84], MUFA [
85,
86] or SFA [
87,
88]. Indeed, some studies shown a slight reduction of bone turnover markers such NTx and ALP without affect to bone resorption markers (Pyr and Dpyr) between n-3 PUFA supplemented groups and those supplemented with n-6 PUFA [
83] or SFA [
87]. On the other hand, n-6 PUFA supplementation also did not affect to serum levels of osteocalcin, b-ALP, CTX-1 and calcium as well as urinary NTx, Pyr, Dpyr and calcium excretion levels in comparison with those supplemented with MUFA [
89,
90] or SFA [
83] in a similar age group. Likewise, no differences in BMD, serum calcium, t-ALP, b-ALP, OPG as well as urinary Dpyr and calcium levels were found between extra virgin olive oil (EVOO) (a MUFA-rich fat source) and nut (a n-6 PUFA source) supplementation [
91,
92,
93]. However, a significant post-intervention increases in levels of osteocalcin and P1NP in the supplemented with EVOO, but not in the nut-supplemented one. It should be noted that in most of the reviewed supplementation studies, diet was not controlled beyond supplement, which could increase risk of underestimating the effect of the supplements.
Table 2. Studies in humans investigating the role of fat intake on bone tissue.
| Population; Age |
Intervention vs. Control Diet/Placebo; Duration |
Main Changes vs. Control Diet or Placebo |
Ref. |
| 42 women and 23 men; 51.3 ± 7.1 y |
HFD (61%E fat) vs. SD (30%E fat); 12 m |
- -
-
No differences in BMC and BMD as well as serum bone crosslaps and urinary Ca excrection levels
|
[78] |
| 208 women and 99 men; 45.5 + 9.7 y |
HFD (>45%E fat) vs. SD (30%E fat); 24 m |
- -
-
No differences in BMD of spine and hip
|
[79] |
| 242 women and 182 men; 51.8 ± 8.9 y |
HFD (40%E fat) vs. LFD (20%E fat); 24 m |
- -
-
No differences in BMD of spine, femoral neck and hip
|
[80] |
| 236 women; 44–50 y |
SD (32%E fat) vs. LFD (24%E fat); 18 m |
- -
-
No differences in BMC of spine and hip as well as BMD of spine
- ↑
-
BMD in hip
- -
-
No differences in serum P1NP and osteocalcin levels
|
[94] |
| 230 women; 27.3 + 1.1 y |
LFD dc (<28%E fat) + vs. SD dc (30%E fat); 108 m |
- ↑
-
BMC and BMD of whole body
|
[81] |
| n-3 PUFA supplementation |
| 3 women and 20 men; 49.3 + 1.6 y |
n-3 PUFA rich HFD (37.6%E fat; 6.5%E ALA; n-6/n-3 ratio: 1.6/1) vs. HFD (34.5%E fat; 0.8%E ALA; n-6/n-3 ratio: 9.5/1); 6 wks |
- ↓
-
serum NTx levels
- -
-
No differences in serum b-ALP levels
|
[83] |
| |
n-3 PUFA rich HFD (37.6%E fat; 6.5%E ALA; n-6/n-3 ratio: 1.6/1) vs. n-6 PUFA rich HFD (37.1%E fat; 3.6%E ALA; n-6/n-3 ratio: 3.5/1); 6 wks |
- -
-
No differences in serum NTx and b-ALP levels
|
[83] |
| 43 women and 2 men with RA; 57.9 ± 10.8 |
NCD + n-3 PUFA supplement (2.4 g of n-3 PUFA/d; 1.1 g ALA+ 0.7 g EPA + 0.1 g DPA + 0.4 g DHA) vs. NCD + dairy supplement (2.4 g of SFA/d); 3 m |
- ↓
-
plasma ALP levels
- -
-
No differences in urinary Pyr, Dpyr and Pyr/Dpyr ratio
|
[87] |
| 87 woman and 26 men; 18–67 y |
NCD + n-3 PUFA supplement (1.48 g EPA + DHA/d) vs. NCD + placebo (NA g olive oil); 12 wks |
- -
-
No differences in serum CTX-1 levels
|
[85] |
| 75 women and 6 men with RA; 49.24 ± 10.46 y |
NCD + n-3 PUFA supplement (2.090 g of EPA and 1.165 g of DHA/d) vs. NCD + placebo (NA g of high-oleic-acid sunflower oil); 16 wks |
- -
-
No differences in serum Ca, b-ALP, osteocalcin and CTX-1 levels
|
[84] |
| 126 women; 75 ± 7 y |
NCD + n-3 PUFA supplement (1.2 g EPA + DHA/d) vs. NCD + placebo (NA g olive oil); 6 m |
- -
-
No differences in serum b-ALP and osteocalcin
|
[86] |
| 60 women and 15 men; 35–65 y |
NCD + n-3 PUFA/MUFA enriched dairy supplement (23.7 g saturated fat + 5.17 g oleic acid + 0.14 g DHA + 0.20 g EPA/d) vs. NCD + semiskimmed milk (70g saturated fat + 2.05 g oleic acid); 12 m |
- -
-
No differences in serum OPG, RANKL, OPG/RANKL ratio
- -
-
No differences in osteocalcin and CTX-1 levels
|
[88] |
| n-6 PUFA supplementation |
| 3 women and 20 men; 49.3 + 1.6 y |
n-6 PUFA rich HFD (37.1%E fat; 12.6%E LA; n-6/n-3 ratio: 3.5/1) vs. HFD (34.5%E fat; 7.7%E LA; n-6/n-3 ratio: 9.5/1); 6 wks |
- -
-
No differences in serum NTx and b-ALP levels
|
[83] |
| |
n-6 PUFA rich HFD (37.1%E fat; 12.6%E LA; n-6/n-3 ratio: 3.5/1) n-3 PUFA rich HFD (37.6%E fat; 10.5%E LA; n-6/n-3 ratio: 1.6/1); 6 wks |
- -
-
No differences in serum NTx and b-ALP levels
|
[83] |
| 38 women and 6 men with RA; 46.2 ± 13.1 y |
NCD + n-6 PUFA supplement (2.5 g CLA/d) vs. NCD + placebo (2.5 g of high-oleic-acid sunflower oil); 3 m |
- ↑
-
osteocalcin and CTX-1 levels
- -
-
No differences in serum b-ALP levels
|
[90] |
| 60 men; 49.1+ 6.2 y |
NCD + n-6 PUFA supplement (3 g CLA/d) vs. NCD + placebo (NA g palm and bean oil blend/d); 8 wks |
- -
-
No differences in serum osteocalcin, b-ALP, CTX-1 and Ca as well as urinary NTx, Pyr, Dpyr and Ca levels
|
[89] |
| MUFA supplementation |
| 127 men; 67.9 ± 6.9 |
CD + EVOO supplementation (>50 mL EVOO/d) vs. CD + nuts supplementation (30 g of mixed walnuts, almonds and hazelnuts); 2 y |
- ↑
-
osteocalcin and P1NP levels but not with nuts supplementation
|
[93] |
| 98 women and 104 men; 67.8 ± 6.5 |
CD + EVOO supplementation (15L EVOO/3 m) vs. CD + nuts supplementation (1350 g of mixed walnuts, almonds and hazelnuts/3 m); 1 y |
- -
-
No differences in serum Ca, t-ALP, b-ALP, OPG as well as urinary Dpyr and Ca levels
|
[91] |
| 104 women and 7 men severely obese; 18–40 y |
CD + EVOO supplementation (52 mL EVOO/d) vs. CD; 12 wks |
- -
-
No differences in Pre-post BMD of spine and hip
|
[92] |