Your browser does not fully support modern features. Please upgrade for a smoother experience.
Please note this is an old version of this entry, which may differ significantly from the current revision.
Subjects:
Pharmacology & Pharmacy
Mexedrone, α-PVP and α-PHP are synthetic cathinones. They can be considered amphetamine-like substances with a stimulating effect. Actually, studies showing their impact on DNA are totally absent.
- synthetic cathinones
- mexedrone
- α-PVP
- α-PHP
- mutagenicity
- S9 mix
- ROS
- flow cytometry
1. Introduction
The number of novel psychoactive substances (NPS) newly introduced to the European market over the last years has risen sharply. The dramatic increase of NPS on the illicit drug market, with the aim of bypassing the controlled substances legislation, is a public health and regulatory challenge of worldwide concern. NPS are often almost automatically associated with phenomena such as addiction, intoxication and overdose, that can lead to hospitalisation or even death.
To date, most of the available toxicological information essentially derive from acute or short-term observations, while the long-term effects seem to be nearly unknown.
To fill this gap, for a couple of years we have been carrying out several studies about numerous NPS belonging to different classes. The aim was, in particular, to investigate their possible mutagenicity, whose key role in the potential long-term toxicity is well known.
This important result further supported the need to implement the available data and to analyze other classes of NPS. Indeed, this could help to understand if a class toxicity characteristic for synthetic cannabinoids could be defined and therefore if it could be connectable to a particular chemical structure. For this reason, we decided to address the evaluation of the mutagenic potential of psychedelic molecules, in particular focusing on four psychoactive phenethylamines, 2C-H, 2C-I, 2C-B e 25B-NBOMe [4]. Additionally, in this case, it was possible to demonstrate how all substances proved to be mutagen and to identify a possible involvement of oxidative stress as a mechanism underlying the genetic damage highlighted. These results suggested us the next natural step, that was to continue the studies by investigating the cytotoxic and mutagenic potential and the ability to induce oxidative stress of synthetic cathinones, molecules that mainly dominated seizures in Europe in 2020 [5]. A small but increasing number of synthetic cathinones production sites has been discovered [5]. Synthetic cathinones are chemical analogues of a natural stimulant (cathinone) found in the leaves of a psychoactive plant [6]. Synthetic analogues of cathinone, also called β-keto amphetamines, are chemical structures that can be easily modified leading to a wide range of psychostimulant compounds. Even though the law has evolved to schedule NPS and limit their spread, the overall availability of new synthetic cathinones has not decreased. Among these, mexedrone (3-methoxy-2-(methylamino)-1-(4-methylphenyl)propan-1-one), α-PVP (alpha-pyrrolidinopentiophenone) and α-PHP (alpha-pyrrolidinohexanophenone), analogously to other cathinones, have been associated with fatal and non-fatal intoxications emphasizing the importance of knowing of their pharmaco-toxicological profile [7,8,9,10,11,12,13,14,15]. α-PVP, and its less common analogue α-PHP, are pyrovalerone type designer drugs. Pyrovalerone derivatives (α-pyrrolidinophenones) are a synthetic cathinones subgroup chemically characterized by a pyrrolidine ring and a long side chain linked to the α-carbon [10]. α-PVP was first detected in the EU in 2011, while the first report on α-PHP identification in Japan was published in 2014 [7,16]. Mexedrone was identified by Qian and collaborators in 2016 and is a lesser-known alpha-methoxy derivative of the popular synthetic cathinone mephedrone (4-methyl-N-methyl cathinone), a drug linked to neurotoxicity [17,18,19]. The abuse of these substances is related to their psychostimulant effects that are similar to those induced by cocaine, amphetamine and MDMA [6]. Mexedrone, α-PVP and α-PHP have been frequently linked to polydrug use cases and, as with other synthetic cathinones, induce effects such as increased energy, reduced appetite, euphoria, sociability, and intensified sensory experiences [10,11]. In addition to this typical stimulant profile, different adverse effects such as tachycardia, restlessness, agitation, bruxism, seizures, hallucinations, and psychosis should be considered [8,9,11,20,21,22,23]. At the molecular level, both effects and adverse effects of these novel recreational drugs can be related to their interaction with dopamine (DAT), norepinephrine (NET), and serotonin (SERT) transporters [24,25,26,27]. Particularly, pyrovalerone derivatives pharmacological activity has been recently studied in vitro using human embryonic kidney 293 cells. α-PVP (DAT IC50 = 0.04 µM; NET IC50 = 0.02 µM; SERT IC50 > 10 µM) and α-PHP (DAT IC50 = 0.02 µM; NET IC50 = 0.04 µM; SERT IC50 > 10 µM) selectively and very potently inhibit the dopamine and norepinephrine reuptake with negligible affinity for the SERT and do not enhance neurotransmitters release, as opposed to other synthetic cathinones [24,25]. Differently, a recent in vitro study in rats’ brain synaptosomes has shown that mexedrone (DAT IC50~6.8 µM; NET IC50~8.8 µM; SERT IC50~5.2 µM) weakly inhibit monoamines uptake and exert a weak releasing activity on SERT (EC50 = 2.5 µM) [28]. Among all available studies, the bibliographic searches conducted on the main databases did not report any genotoxicological investigation concerning mexedrone, α-PVP and α- PHP and only one regarding 3-MMC and 4-MEC is present [29].
2. Results
In the preliminary phase of the research, we determined the concentrations to be used in the subsequent experiments aimed at evaluating the potential mutagenicity of synthetic chatinones in study. First, we assessed the mexedrone, α-PVP and α-PHP induced cytotoxicity after 26 h treatment by measuring the percentage of live cells at the different concentrations tested (25, 35, 50, 75, 100 µM). This value was normalized on the one obtained in the concurrent negative control cultures in order to check that the cellular viability complied with the OECD threshold (equal to 55 ± 5%) [30].
In Figure 1 it can be seen how the viability is abundantly above the OECD threshold (represented by the red line) for all substances (Figure 1A,B,C).
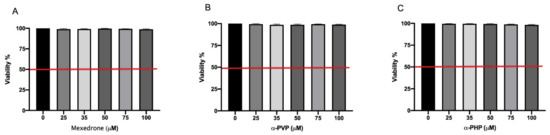
Figure 1. Cell viability on TK6 cells after 26 h treatment with mexedrone (A), α-PVP (B), α-PHP (C) at the indicated concentrations compared to the negative control [0 μM]. Each bar represents the mean ± SEM of five independent experiments. Data were analyzed by ANOVA Repeated followed by Dunnet post-test.
In addition, to make the mutagenicity test reliable, it is necessary to check the cellular proliferation in order to verify that a sufficient number of cells has undergone mitosis and so that they are able to transmitt the genetic damage suffered to the daughter cells. For this purpose, the OECD recommends the measurement of the Relative Population Doubling (RPD) to estimate the cytostasis and, analogously to the cytotoxicity, establishes a threshold at most equal to 55 ± 5% [30]. Similarly, to what has been reported for cytotoxicity, all three substances under study, at all the concentrations tested, showed an RPD well above the established threshold (Table 1).
Table 1. RPD on TK6 cells after 26 h treatment with mexedrone, α-PVP, α-PHP at the indicated concentrations compared to the negative control [0 μM]. Data are presented as mean ± SEM of five independent experiments.
| Relative Population Doubling (RPD) | |||
|---|---|---|---|
| Mexedrone | α-PVP | α-PHP | |
| 0 µM | 100.00% | 100.00% | 100.00% |
| 25 µM | 97.0% ± 3.2 | 91.5% ± 5.9 | 88.3% ± 1.3 |
| 35 µM | 92.0% ± 4.2 | 88.4% ± 6.8 | 94.4% ± 1.7 |
| 50 µM | 88.4% ± 7.9 | 88.7% ± 7.1 | 96.8% ± 3.2 |
| 75 µM | 95.2% ± 3.5 | 89.9% ± 4.6 | 85.2% ± 3.5 |
| 100 µM | 90.1% ± 3.6 | 87.6% ± 6.3 | 85.9% ± 5.6 |
The research continued by considering another alternative cell death mechanism, i.e., apoptosis, since the assessment of other cytotoxicity markers could provide useful additional information (e.g., cell integrity, apoptosis, necrosis, etc.).
The evaluation of the apoptotic process was carried out according to the Guava Nexin assay. For mexedrone, α-PVP and α-PHP the induction of apoptosis never reached a doubling if compared to the concurrent negative control at all the selected concentrations (Figure 2A,B,C).
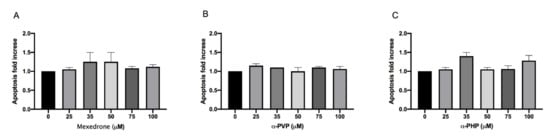
Figure 2. Apoptosis fold increase on TK6 cells after 26 h treatment with mexedrone (A), α-PVP (B) and α-PHP (C) at the indicated concentrations compared to the negative control [0 μM]. Each bar represents the mean ± SEM of five independent experiments. Data were analyzed using repeated ANOVA followed by Dunnet post-tests.
Overall, the obtained results allowed selecting the concentrations to be used in the mutagenic analysis. In particular, 75 and 100 µM were tested for all synthetic cathinones. The cultures treated in this way, were compared with negative and positive (Mytomicin (MMC) or Vinblastine (VINB)) treated cultures.
In particular, mexedrone showed a significant increase of the MNi frequency at both the concentrations tested (75 and 100 µM) (Figure 3); while for α-PVP (Figure 4) and α-PHP (Figure 5) no statistically significant increase was observed.
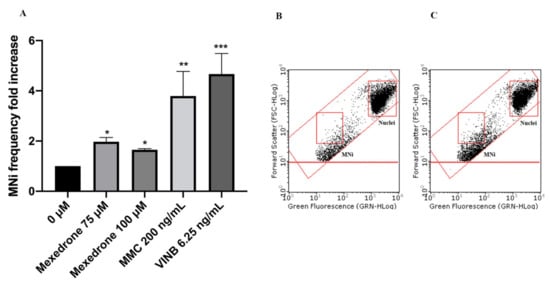
Figure 3. MNi frequency fold increase on TK6 cells after 26 h treatment with mexedrone at the indicated concentrations compared to the negative control [0 μM] and to positive controls [MMC and VINB] (A), plot of nuclei and MNi in the negative control (B) and in 100 µM mexedrone -treated cultures (C). Each bar represents the mean ± SEM of five independent experiments. Data were analyzed using repeated ANOVA followed by Bonferroni post-test. * p < 0.05 vs. 0 µM; ** p < 0.01 vs. 0 µM; *** p < 0.001 vs. 0 µM.
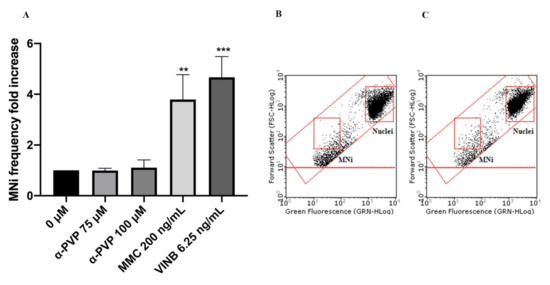
Figure 4. MNi frequency fold increase on TK6 cells after 26 h treatment with α-PVP at the indicated concentrations compared to the negative control [0 µM] and to positive controls [MMC and VINB] (A), plot of nuclei and MNi in the negative control (B) and in 100 µM α-PVP -treated cultures (C). Each bar represents the mean ± SEM of five independent experiments. Data were analyzed using repeated ANOVA followed by Bonferroni post-test. ** p < 0.01 vs. 0 µM; *** p < 0.001 vs. 0 µM.
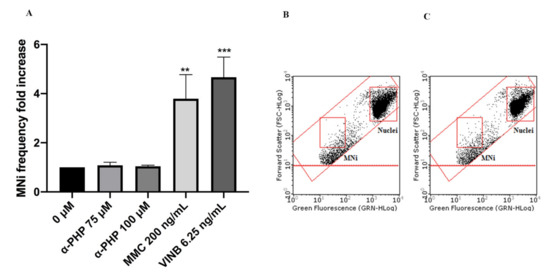
Figure 5. MNi frequency fold increase on TK6 cells after 26 h treatment with α-PHP at the indicated concentrations compared to the negative control [0 µM] and to positive controls [MMC and VINB] (A), plot of nuclei and MNi in the negative control (B) and in 100 µM α-PHP-treated cultures (C). Each bar represents the mean ± SEM of five independent experiments. Data were analyzed using repeated ANOVA followed by Bonferroni post-test. ** p < 0.01 vs. 0 µM; *** p < 0.001 vs. 0 µM.
Subsequently, given the absence of mutagenicity of α-PVP and α-PHP, we analyzed the possible mutagenic activity of the metabolites produced by all three synthetic cathinones in study.
In particular, the cultures were treated with 75 and 100 µM concentrations and then were compared to negative and positive (cyclophosphamide (CP)) controls. Mexedreone showed a statistically significant increase at both concentrations tested similarly to the results obtained in the absence of S9 mix (Figure 6). α-PVP showed a significant increase in MNi frequency at both concentrations tested (Figure 7), while for α-PHP a statistically significant increase was observed only at the highest concentration tested (Figure 8).
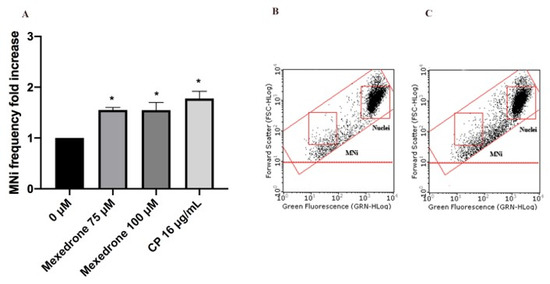
Figure 6. MNi frequency fold increase on TK6 cells after 3 h + S9 mix treatment with mexedrone at the indicated concentrations compared to the negative control [0 µM] and to the positive control [CP] (A), plot of nuclei and MNi in the negative control (B) and in 100 µM mexedrone-treated cultures (C). Each bar represents the mean ± SEM of five independent experiments. Data were analyzed using repeated ANOVA followed by Bonferroni post-test. * p < 0.05 vs. 0 µM.
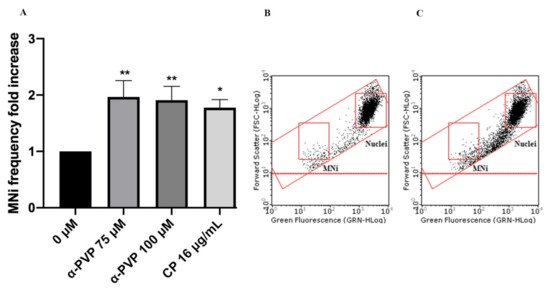
Figure 7. MNi frequency fold increase on TK6 cells after 3 h + S9 mix treatment with α-PVP at the indicated concentrations compared to the negative control [0 µM] and to the positive control [CP] (A), plot of nuclei and MNi in the negative control (B) and in 100 µM α-PVP-treated cultures (C). Each bar represents the mean ± SEM of five independent experiments. Data were analyzed using repeated ANOVA followed by Bonferroni post-test. * p < 0.05 vs. 0 µM; ** p < 0.01 vs. 0 µM.
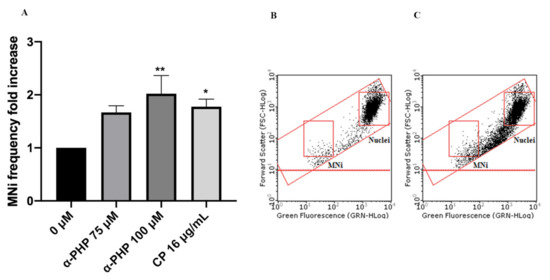
Figure 8. MNi frequency fold increase on TK6 cells after 3 h + S9 mix treatment with α-PHP at the indicated concentrations compared to the negative control [0 µM] and to the positive control [CP] (A), plot of nuclei and Mni in the negative control (B) and in 100 µM α-PHP-treated cultures (C). Each bar represents the mean ± SEM of five independent experiments. Data were analyzed using repeated ANOVA followed by Bonferroni post-test. * p < 0.05 vs. 0 µM; ** p < 0.01 vs. 0 µM.
Lastly, in order to identify a possible mechanism of action at the basis of the mutagenic activity, TK6 cells were treated with the synthetic cathinones for 1, 6 and 12 h and then the possible ROS induction was measured.
The highest concentration tested was selected for each substance: 100 µM for all cathinones. The cultures treated in this way were compared to negative and positive (H2O2) controls. The results did not show a statistically significant increase of the mean fluorescence intensity if compared to the concurrent negative control for all the cathinones in study (Figure 9).
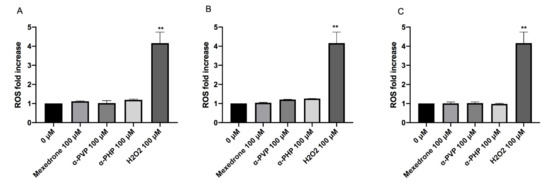
Figure 9. ROS fold increase on TK6 cells after 1 (A), 6 (B) and 12 (C) h treatment with mexedrone, α-PVP, α-PHP at the indicated concentrations compared to the negative control [0 µM] and to positive control (H2O2). Each bar represents the mean ± SEM of five independent experiments. Data were analyzed using repeated ANOVA followed by Bonferroni post-test. ** p < 0.01 vs. 0 µM.
This entry is adapted from the peer-reviewed paper 10.3390/ijms22126320
This entry is offline, you can click here to edit this entry!