PCT is a precursor of calcitonin, which is secreted by neuroendocrine cells such as C cells of the thyroid and pancreatic tissues. PCT plays an important role in the diagnosis of systemic bacterial infection. Elevated serum PCT levels have also been reported in patients with pulmonary infection. Additionally, the positive feedback between procalcitonin and proinflammatory cytokines subsequently culminates in a severe systemic inflammatory response.
- COVID-19
- SARS-CoV-2
- procalcitonin
- severity
- meta-analysis
1. Introduction
The Coronavirus Disease 2019 (COVID-19) pandemic has spread rapidly around the world in a short time, resulting in more than 116 million cases worldwide and 2.62 million deaths [1]. Of the 21.2 million existing cases, more than 89,000 were severe or critical COVID-19, which posed a considerable threat to global health and economies.
Patients with severe COVID-19 often have high levels of inflammatory factors in serum [2]. In addition, tocilizumab, an IL-6 receptor blocker, neutralizes IL-6 activity by binding the IL-6R at the IL-6-binding epitope. Furthermore, mortality was 4–5% higher in patients who received tocilizumab monotherapy compared with those who did not receive tocilizumab or steroids [5]. Therefore, inflammatory biomarkers, such as PCT, C-reactive protein, and interleukin (IL)-6, may be potential targets for the treatment or prediction of COVID-19 [6].
PCT is a biomarker of systemic inflammatory activity in the early phase after infection resulting from pro-inflammatory stimuli [7], which is bound up with the prognosis of infectious diseases. However, it was worth noting that PCT was considered as an important risk factor of the severity of COVID-19 based on univariate analysis (OR = 1.13, 95% CI: 1.03–1.24), which is inconsistent with those based on multivariate analysis after adjusting for confounding factors (OR = 1.05, 95% CI: 0.96–1.15) [12]. It suggested that the association between PCT and the severity of COVID-19 might be confounded by some confounding factors. More studies using multivariate analysis adjusting for confounding factors with inconsistent results have been published.
2. Methods
The PRISMA (preferred reporting items for systematic reviews and meta-analyses) statement was used as a guideline for reporting this meta-analysis [13].
2.1. Search Strategy
Electronic databases (PubMed, Web of Science, and Embase) were systematically searched by two independent authors (Yue Shen and Cheng Cheng) from inception up to 2 April 2021. The search terms included PCT and COVID-19 (Table S1). Considering that the first article of COVID-19 was published in Jan 2020, search filters were used to limit the results to the “2010–2021” publication time range and English articles. Additionally, we manually searched the reference lists in the relevant articles.
2.2. Inclusion Criteria and Study Selection
Two authors analyzed the titles, abstracts, and full texts of all these articles, and reviewed the retrieved studies using standardized data collection tables. In the case of any disagreement, a consensus should be reached by the third investigator.
The study was included if it: (1) reported the risk (including OR, RR, and HR) between PCT and the severity of COVID-19; (2) conducted research in general adults (≥18 years old); and (3) adjusted for at least one confounding factor. The patients of severe COVID-19 are those who met the criteria of either the WHO [14] or the National Health Commission of China [15] for severe and critical COVID-19, meeting any of the following criteria: (1) respiratory rate > 30 breaths/min; (2) oxygen saturation < 90% on room air; (3) severe respiratory distress (accessory muscle use, inability to complete full sentences); (4) critical complication (acute respiratory distress syndrome, sepsis, septic shock, or other conditions that would normally require the provision of life-sustaining therapies such as mechanical ventilation or vasopressor therapy); or (5) dead.
The study was excluded if it: (1) had a sample of fewer than 20 patients; (2) was a review article, meta-analysis, conference summary, clinical trial report, or grey literature (material is produced on all levels of government, academics, business and industry in print and electronic formats, but which is not controlled by commercial publishers) [16]; (3) was a case report or case series; (4) included special participants (e.g., cardiovascular, cancer or diabetes participants); (5) did not report on the results of severe, critical or dead patients; and (6) only reported the unadjusted effect estimates.
2.3. Data Extraction
The following information was extracted from eligible studies: name of the first author, country of publication, study design, sample size, research outcomes, participant characteristics (sex, age), adjusted effect estimate, 95% confidence interval (CI), and confounder(s) in the multivariable analysis.
2.4. Quality Assessment
The quality of eligible studies was evaluated by the Newcastle–Ottawa scale (NOS), which has eight items in three domains: subject selection (four scores); study group comparability (one score); and outcome(s) evaluation (three scores) [17]. Each study has a maximum score of eight. A study with a score of ≥6 was considered a high-quality study.
2.5. Statistical Methods
We performed random-effects meta-analyses [18] to pool the adjusted effect estimates. Q andI2were used to assess heterogeneity between studies [19].I2≤ 50% orp≥ 0.1 demonstrated no significant heterogeneity, and a fixed-effects model was used. > < 0.1 indicated a significant heterogeneity, and a random-effects model was applied.
Subgroup analyses were conducted by sex, age, sample size, effect estimate, outcome, and adjusted confounders. Additionally, sensitivity analyses excluded one study at a time to assess the stability of the results. Egger’s test [20] was used to evaluate publication bias. Stata software (Version 11.2; Stata Corporation, College Station, TX, USA) was used for all statistical analyses.
3. Results
3.1. Literature Search and Study Characteristics
A total of 1805 studies were searched from electronic literature databases (Figure S1). We deleted 999 duplicate articles and 220 irrelevant articles according to the title and abstract. Then, the full texts of the remaining 274 articles were carefully reviewed. Of them, 264 were further excluded through exclusion criteria.
Of these, six studies were conducted in China, two from the United States [22,26], one from Italy [27], and one from Turkey [12]. Only one study was a prospective cohort study [27], while the others were retrospective cohort studies. The outcome in nine studies was death, and the remaining one was ICU [24]. The detailed NOS scores are shown inTable S2, and all studies were considered to be of high quality with an NOS score ≥ six scores.
3.2. PCT and the Severity of COVID-19
The forest plot, using a random-effects model, of the relation of PCT and the severity of COVID-19 risk presented that patients with elevated PCT on admission had a significantly increased risk of severe COVID-19 by 77% (pooled effect estimate: 1.77, 95% CI: 1.38–2.29) (Figure 1).
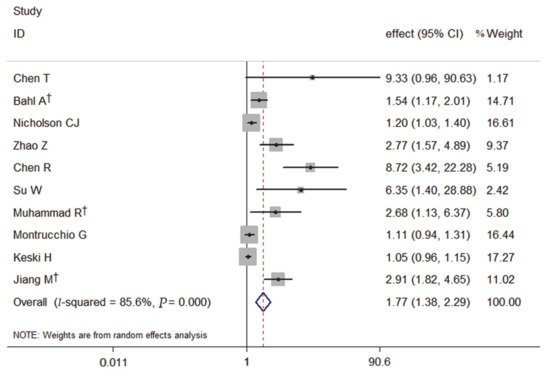
Figure 1. Forest plot of the meta-analysis of cohort studies on PCT and the severity of COVID-19 (CI, confidence interval). † indicates combined effects based on subgroups.
3.3. Subgroup and Sensitivity Analyses
Among the 10 studies, the primary outcome of nine studies was death, and the meta-analysis of the association with elevated PCT and the risk of death showed that elevated PCT was a significant risk factor for the mortality of COVID-19. It also had a significantly increased risk of the mortality of COVID-19 by 77% (pooled effect estimate: 1.77, 95% CI: 1.36–2.30, random-effects model) (Figure 2).
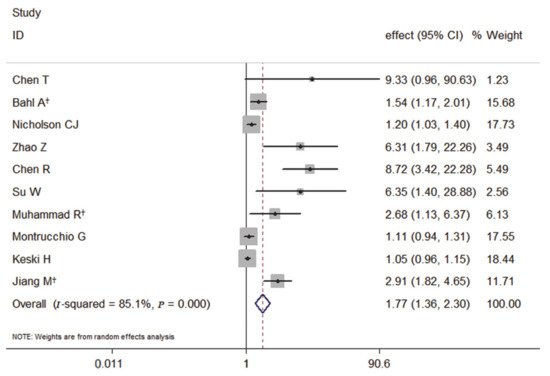
Figure 2. Forest plot of the meta-analysis of cohort studies on elevated PCT and the mortality of COVID-19 (CI, confidence interval). † indicates combined effects based on subgroups.
Subgroup analysis based on predetermined factors revealed heterogeneity in the comparison (Table 2). For elevated PCT, which displayed significantly increased risks for the severity of COVID-19 in the primary analyses, all subgroup analyses maintained the positive correlation (Figures S2–S8). It indicated that the predetermined factors, such as sex, age, sample size, effect estimate, outcome, and adjusted confounders, might be risk factors. When studies were stratified by adjustments for diabetes, the summary estimate effect was weaker among the studies with such adjustments than among those without (RR = 1.23, 95% CI 1.06–1.44 vs. RR = 3.20, 95% CI 1.59–6.45).
4. Conclusions
The present study provided evidence that elevated PCT is positively associated with an increased risk of the severity of COVID-19. PCT is a potential biomarker to evaluate the severity of COVID-19 and predict the prognosis.
This entry is adapted from the peer-reviewed paper 10.3390/medicina57060594