Animals obtain nutrition and energy by eating and to achieve a balance between growth and body health. When the nutrient intake is abnormal, the growth status changes, presumably resulting in changes in the intrinsic immune system. The zebrafish (Danio rerio), a well-known fish model organism, can serve as a suitable model to explore the changes happened to the innate immune system. In this study, the zebrafish underwent 3 weeks of fasting and refeeding for 3 to 7day periods. During this period, zebrafish displayed a specific growth phenomenon so called compensatory growth (CG), accompanied by increased susceptibility to pathogens after starvation. The kidneys suffering starvation displayed an increase of the amount of melano-macrophage centers and appeared oxidative stress, and the antioxidant enzymes activity like CAT, GSH-Px and SOD increased after fasting. In addition, the activity of ALP and lysozyme as well as il-1β mRNA expression enhanced after starvation. Taken together, oxidative stress caused by starvation and the danger-associated molecular patterns produced by injured renal tubules may have contributed to inflammation. This study showed that the function of the innate immune system in zebrafish could be influenced by nutrition status. Further study is needed to explore how starvation increases susceptibility and how the metabolic state influences different kinds of immune cells.
1. Introduction
Basic life activities are dependent on the energy supply of the organism. The nutrient state of the animal body can influence the functioning of the immune system [
1,
2]. Compensatory growth (CG) is a period of rapid growth after a phase of growth suppression, which can be caused by a shortage of food and other environmental factors [
3,
4]. This phenomenon was first recorded in mammals and was eventually found in birds [
3] and teleosts [
5]. CG is divided into two phases: the catabolic phase and the hyper anabolic phase [
6]. One of the basic patterns of CG is fasting and refeeding. After refeeding, fish can experience partial, full, over- or no compensation [
4]. The special feeding regime of CG is regarded as a potential way to improve production efficiency in farmed species [
7].
The innate immune response is the first boundary of host defense, protecting organisms from pathogens. In fish, organs of the immune system include the thymus, head kidney, caudal kidney, gills, liver and gut [
8,
9]. A broad range of cell types take part in nonspecific cellular defense responses in fish, including monocytes/macrophages, nonspecific cytotoxic cells and granulocytes (neutrophils). Immunometabolism is the interplay between immunological and metabolic processes [
10]. The metabolic status of fish can affect their immune function. In humans, the nutritional state influences immune cell counts—and their activity [
11]. It was found that the function of the immune system in mice could be affected by their metabolic state [
12,
13,
14]. Intermittent fasting in crucian carp (
Carassius auratus) changed the gut bacterial communities and increased the activity of super oxide dismutase (SOD) and lysozyme [
15]. Starvation also alters the gene expression of innate immune responses in the livers of salmon [
16]. In addition, studies on the effects of the metabolic state on the immune system can be found in other teleosts [
17,
18,
19]. However, the influence of the metabolic state upon the immune system in teleosts is still poorly understood. Oxidative stress can limit the function of the innate immune system and induce components like toll-like receptors [
20,
21]. Meanwhile, starvation can increase the production of ROS and cause autophagy [
22,
23]. It would be worth exploring whether oxidative stress mediates the relationship between starvation and immunity.
Zebrafish (
Danio rerio) area widely applied model in the study of immunity and disease. The innate immune systems of zebrafish begin to develop on day 1 of embryogenesis, and the adaptive immune system is absent until 4–6 weeks after fertilization. This makes zebrafish a great model for studies of the innate immune system [
9]. The kidney is the primary lymphoid organ in zebrafish [
24]. The
havcr1 gene encodes a transmembrane tubular protein called kidney injury molecule-1 (KIM-1) [
25]. KIM-1 is the indicator of tissue damage in the kidney, and the overexpression of KIM-1 causes kidney injury in zebrafish [
26]. It was found that fasting could change the metabolic state in zebrafish [
27]. Fasting led to decreased oxygen consumption and liver lipid and glycogen contents. It also increased the activity of β-oxidation and gluconeogenesis in liver. Meanwhile, reactive oxygen species (ROS) took part in the CG in zebrafish [
28]. ROS, produced in the liver, were necessary for CG in zebrafish because they induced the AMPK pathway. In the present study, we adopted a strategy of fasting and refeeding to explore the pattern of CG in zebrafish.
Streptococcus agalactiae caused severe sepsis and meningitis in zebrafish and could infect more than 30 species of fish [
29]. We chose
Streptococcus agalactiae and lipopolysaccharides (LPS) for injection to explore the influence of CG on the innate immune system, combined with changes in immune-related parameters and gene expression.
2. Results
2.1. Changes in Body Weight and Antibacterial Properties of Zebrafish during Fasting and Refeeding
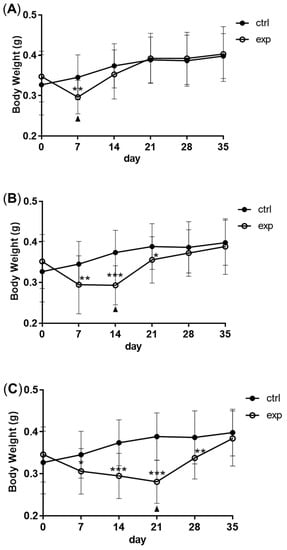
Full compensatory growth was realized in zebrafish. After fasting for 7 to 14 days, zebrafish lost at least 15% body weight. Following 14 days of refeeding, the body weight of zebrafish in the fasting group caught up with that of the control group (A–C). After fasting and refeeding, in order to explore the resistance of zebrafish to pathogens, they were intraperitoneally injected with Streptococcus agalactiae. Zebrafish in the fasting group had an increased mortality rate compared with the control group. With the extension of refeeding, the mortality rate continued to decrease (D).
Figure 1. The model of compensatory growth in zebrafish. A to C: the body weight change of zebrafish during fasting and refeeding. (A) The zebrafish were fasted for 7 days and refed for 28 days. (B) The zebrafish were fasted for 14 days and refed for 21 days. (C) The zebrafish were fasted for 21 days and refed for 14 days. n = 21–22. (D) The survival rate of zebrafish which were intraperitoneally injected with S. agalactiae; F: feeding; S: starvation; R: refeeding. n = 3, *: p < 0.05, **: p < 0.01; ***: p < 0.001.
2.2. Morphologic Alterations of the Kidneys of Zebrafish during Fasting and Refeeding
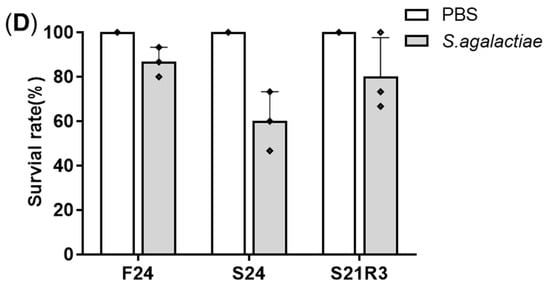
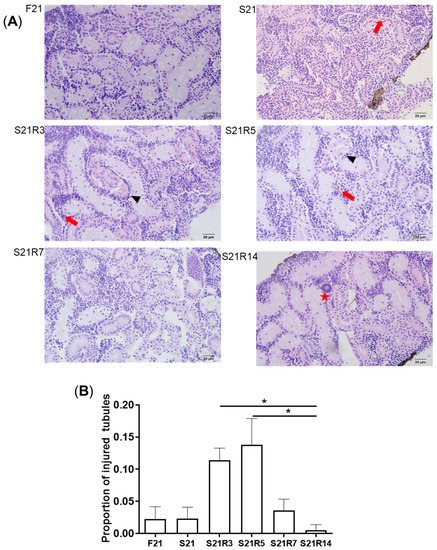
Kidney is the main immune tissue in zebrafish. Starvation caused morphological changes in the kidneys. After 21 days of fasting, the kidney exhibited obvious morphological changes. We found that more injured tubules with hyaline droplets appeared after refeeding for 3 and 5 days. This situation improved at 7 days. In addition, it was observed that the number of melano-macrophage centers (MMCs) in the kidney increased after starvation (A–C). Along with refeeding, this symptom was rescued. The mRNA expression of havcr1 increased after fasting (D), showing that starvation may cause kidney injury.
Figure 2. Morphological changes in the kidneys of zebrafish during fasting and refeeding. (A) HE-staining of kidney in zebrafish during fasting and refeeding. Black triangle denotes injured tubules. Red arrow denotes MMCs. Red star denotes hyaline droplets. (B) Statistic analysis of proportion of injured tubules in kidney. (C) Statistic analysis of MMCs in kidney. n = 3–4. (D) The mRNA relative expression of havcr1 gene in kidney of zebrafish during fasting and refeeding. n = 8–10. F: feeding; S: starvation; R: refeeding. *: p < 0.05.
2.3. Oxidative Stress Was Triggered during Fasting and Refeeding
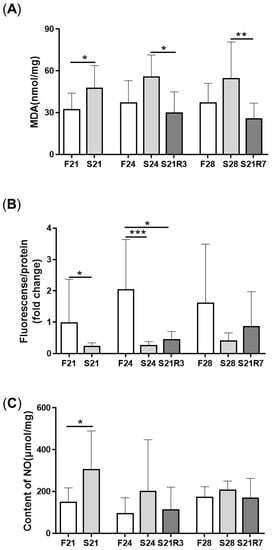
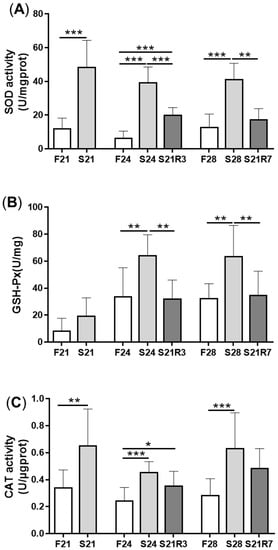
MDA content was enhanced significantly after fasting for 21 and 24 days and decreased after 3 days of refeeding (A). However, the content of ROS decreased with 24 days of starvation and recovered with refeeding for 7 days (B). The content of NO increased after fasting for 21 days (C). The activity of antioxidant enzymes, including SOD, GSH-Px and CAT, increased after fasting. The activities of GSH-Px and CAT rapidly decreased and recovered at day 3 of refeeding. Although the activity of SOD declined with refeeding, it was still higher than that of the control ().
Figure 3. Oxidative stress in the kidneys of zebrafish during fasting and refeeding. (A) The content of MDA in kidney. (B) The change of ROS in kidney. (C) The content of NO in kidney. F: feeding; S: starvation; R: refeeding. n = 6–10. *: p < 0.05, **: p < 0.01; ***: p < 0.001.
Figure 4. The activity of enzymes in the antioxidant systems in kidneys of zebrafish during fasting and refeeding. (A) The activity of SOD in kidney. (B) The activity of GSH-Px in kidney. (C) The activity of CAT in kidney. F: feeding; S: starvation; R: refeeding. n = 6–10. *: p < 0.05, **: p < 0.01; ***: p < 0.001.
2.4. The Innate Immune System of the Zebrafish Kidney Was Affected by Fasting and Refeeding
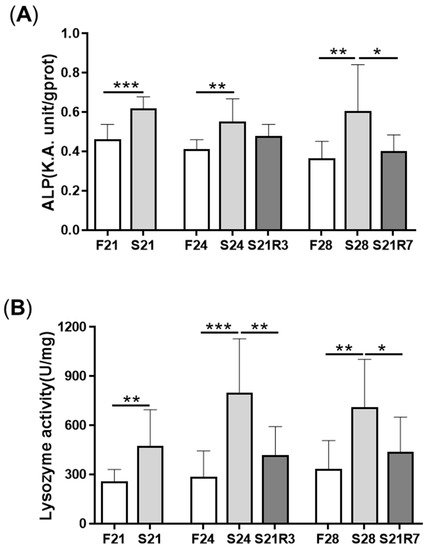
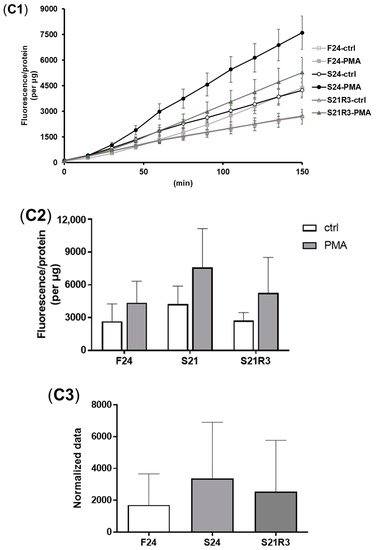
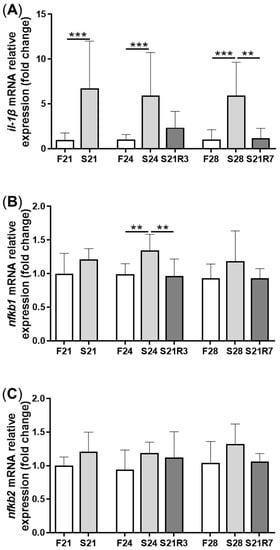
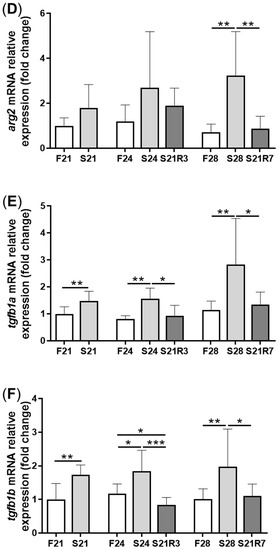
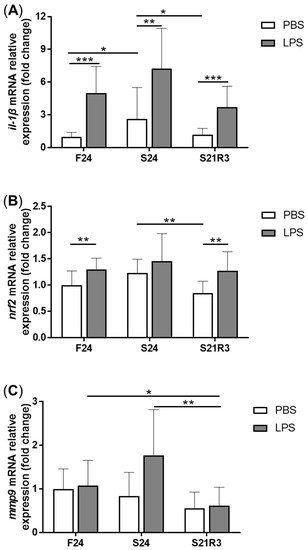
The activity of ALP increased in the kidney after fasting and decreased after refeeding (A). With refeeding for 7 days, there was no significant difference between the refeeding group and the control. The activity of lysozyme in the kidney showed a similar trend to ALP, which increased with fasting (B). It declined rapidly after refeeding. The respiratory burst response in the kidney showed no significant changes in different groups, but the response was higher in the fasting and refeeding group (C). The mRNA expression of the proinflammatory cytokine il-1β showed a remarkable increase in all fasting groups but promptly declined after refeeding (A). The mRNA expression of tgfb1a and tgfb1b showed the same trend as il-1β (E,F). However, the mRNA expression of nfκb1 only notably increased after starvation for 24 days and decreased after refeeding for 3 days. The mRNA expression of nfκb2 showed a trend similar to that of nfκb1 (B,C). The gene arg2 encodes arginase Ⅱ, which is related to the proinflammatory response. In addition, the mRNA expression of arg2 increased remarkably in all fasting groups and was reduced after refeeding (D). After challenging the zebrafish who went through fasting and refeeding, the response was stronger in the fasting group. The mRNA expression of il-1β and mmp9 in LPS-treated fasting group was significantly higher than that in the LPS-treated control or refeeding groups ().
Figure 5. The parameters of the innate immune system in the kidneys of zebrafish during fasting and refeeding. (A) ALP activity in kidney of zebrafish during fasting and refeeding. (B) Lysozyme activity in kidney of zebrafish during fasting and refeeding. (C) The respiratory burst response of kidney in zebrafish after fasted and refed. (C1) The value of fluorescence/protein of kidney at different times. (C2) Fluorescence/protein values of kidney at 150 min. (C3) Normalization of the value of fluorescence/protein of kidney at 150 min. F: feeding; S: starvation; R: refeeding. n = 12. *: p < 0.05, **: p < 0.01; ***: p < 0.001.
Figure 6. The mRNA relative expression of immune-related genes in the kidneys of zebrafish during fasting and refeeding. (A–F):il-1β, nfκb1, nfκb2, arg2, tgfb1a and tgfb1b. F: feeding; S: starvation; R: refeeding. n = 8–10. *: p < 0.05, **: p < 0.01; ***: p < 0.001.
Figure 7. The mRNA relative expression of immune-related genes in the kidneys of zebrafish challenged with 5 μL of 20 μg/mL LPS after fasting and refeeding. (A–C) il-1β, mmp9 and nfκb1. F: feeding; S: starvation; R: refeeding. n = 8–12. *: p < 0.05, **: p < 0.01; ***: p < 0.001.
This entry is adapted from the peer-reviewed paper 10.3390/biom11060825