Zeolites are materials of biomedical interest, in particular owing to their ability to remove metabolic products such as uremic toxins (i.e., urea, uric acid, creatinine, p-cresol, and indoxul sulfate); they are used for the regeneration of dialysis solutions and as in vivo membranes for artificial kidney. Zeolites have further important applications in the biomedical field, in fact they are used as hemostats (due to their ability to absorb water), antiseptics (when modified with silver or zinc ions), carriers for drugs and genes (adjuvant in vaccines), glucose absorbers, etc. Here, EDS microanalysis in the study of a sample of natural clinoptilolite is reported.
- Zeolites
- Materials
- EDS
1. Determination of the Si/Al molar ratio
A very important characteristic parameter for zeolites is the atomic[1] (or molar) ratio of the silicon and aluminium elements (Si/Al) contained in them. According to Lowenstein's rule[2], this ratio always assumes numerical values greater than 1 (the rule says that an AlO4 tetrahedron is unlikely to bind another AlO4 tetrahedron). When the ratio Si/Al is equal to 1, the tetrahedra of Si and those of Al regularly alternate to build an ordered structure. The Si/Al ratio varies from 1 to 7 for natural zeolites and varies from 1 to infinity for the synthetic ones. In general, zeolites are classified on the basis of the numerical value of this Si/Al atomic ratio and distinguished in highly-siliceous zeolites, when the ratio is greater than 5 (highly-siliceous zeolites are nonpolar and therefore have little affinity with water), and in aluminous zeolites, when this ratio is less than 5 (these minerals are polar and very compatible with water). The affinity of the zeolites with water depends on the concentration of the hydrophilic sites (cationic and external hydroxyl sites) present in them and these sites are with good approximation numerically equal to that of the aluminum atoms (the concentration of the external hydroxyls is negligible). Many physico-chemical properties of zeolites depend on this ratio. For example, the electrical conductivity and ion exchange capacity of zeolites are closely related to the Si/Al ratio and both properties improve as this ratio decreases. The atomic Si/Al ratio is generally determined by using the elementary chemical analysis of zeolite samples, which is a destructive, generally time consuming, and laborious procedure. The EDS microanalysis is carried out by measuring the energy and intensity distribution of the X-rays generated by the action of the primary electron beam on the sample, by using an energy dispersion detector (single crystal of silicon doped with lithium). It represents a rapid, non-destructive analytical method to evaluate the atomic Si/Al ratio of a zeolite sample. Thin slices of clinoptilolite were produced by cutting the raw stone with a diamond saw (electric mini-drill). The data generated by the EDS analysis consisted of spectra containing peaks that corresponded to the different elements present in the sample. This technique combines: the morphological information offered by the SEM microscope with the qualitative and semi-quantitative compositional information offered by the X-rays acting on the section of the observed samples. The samples were not metallized with Au/Pd alloy for avoiding to mask lighter elements and samples were observed in low vacuum mode by a SEM microscope (FEI Quanta 200 FEG), equipped with an EDS energy-dispersive spectrometer (Oxford Inca Energy System 250 equipped with INCAx-act LN2-free detector). The EDS analysis was conducted on several samples of natural clinoptilolite and several points of different areas have been analyzed for each of them. The investigated area was about 900 µm2 (see Figure 1).
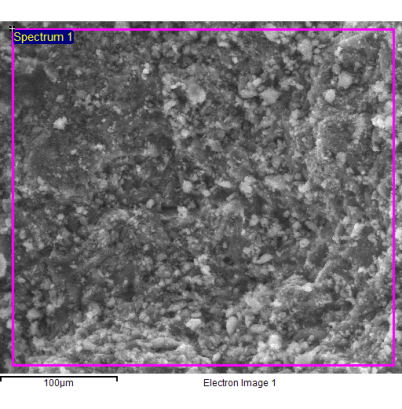
Fig. 1 - Natural clinoptilolite sample analyzed by the EDS technique.
According to the EDS technique, the atomic percentage of silicon in the zeolite was on average equal to 22.90% and the average atomic percentage of aluminum was equal to 4.25%, the ratio of these atomic percentages provides a value for the atomic Si/Al ratio corresponding to 5.39, which exactly matches the Si/Al value of natural clinoptilolite (a highly siliceous zeolite). Table I summarizes the results of the EDS analysis conducted on a single sample of natural clinoptilolite measured in three different points.
|
at.% |
at.% |
at.% |
Average values |
|
|
Si |
23.38 |
22.75 |
22.58 |
22.90 |
|
Al |
4.27 |
4.27 |
4.22 |
4.25 |
|
Si/Al |
5.475 |
5.328 |
5.351 |
5.385 |
Tab. 1 - Atomic percentages of Si and Al and atomic Si/Al ratio for the sample of natural clinoptilolite.
2. Determination of the nature and concentrations of extra-framework cations
The crystallochemical variability of zeolites and consequently their technological applications depend not only on the atomic Si/Al ratio but also on the type of cations present in the structure. Usually, these cations are alkali or alkaline-earth metals[3], which are present in the channels of the mineral depending on their radius and charge (for example, clinoptilolite readily accepts Cs+ ions by on exchange mechanism). The type of extra-framework cations and their molar or weight percentage in the mineral can also be obtained quickly and accurately by EDS analysis. As visible in the spectrum given in Figure 2, four different types of cations were present in the natural clinoptilolite sample, namely: potassium, calcium, iron, and magnesium. The intensities of the signals of these ions were quite different and, in particular, calcium and potassium were more abundant, while magnesium and iron were present at trace level. The average values of the percentages for these elements are reported in Tables II and III. On basis of these results, the investigated zeolite sample corresponded to K-type clinoptilolite (generally referred to as: clinoptilolite-K). Iron is a typical impurity that is frequently found in zeolites of natural origin.
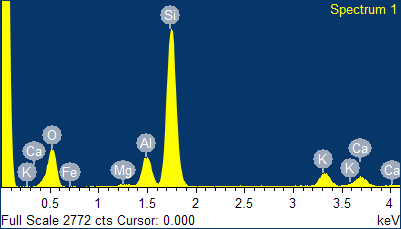
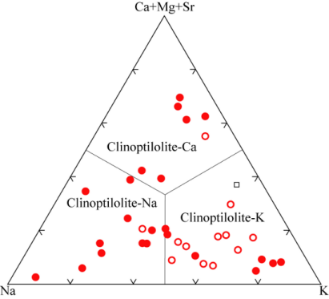
Fig. 2 - EDS spectrum of the natural clinoptilolite sample (top) and classification of the three forms of natural clinoptilolite (bottom).
|
Cation |
Area 1 |
Area 2 |
Area 3 |
Average value |
|
K |
1.55 |
1.49 |
1.43 |
1.49 |
|
Ca |
1.03 |
1.01 |
0.97 |
1.00 |
|
Mg |
0.34 |
0.40 |
0.41 |
0.38 |
|
Fe |
0.41 |
0.38 |
0.35 |
0.38 |
Tab.2 - Atomic/molar percentages of extra-framework cations present in the sample of natural clinoptilolite.
|
Cation |
Area 1 |
Area 2 |
Area 3 |
Average value |
|
K |
3.02 |
2.92 |
2.80 |
2.91 |
|
Ca |
2.06 |
2.02 |
1.95 |
2.01 |
|
Mg |
0.41 |
0.48 |
0.50 |
0.46 |
|
Fe |
1.14 |
1.05 |
0.97 |
1.05 |
Tab. 3 - Percentages by weight of extra-framework cations present in the sample of natural clinoptilolite.
3. Stoichiometric verification of the mineral chemical formula
Obviously, the EDS spectrum is completed by the presence of the oxygen fluorescence signal, which represents the most abundant element contained in the silicoaluminate compound (the average oxygen concentration calculated by EDS was ca. 69.48at.%, 55.55% by weight). This signal was generated both by oxygen bonded to silicon and by oxygen bonded to aluminum. As can be easily calculated by using the data in Table I, due to the presence of crystallization water in the mineral, the O/(Si+Al) atomic ratio was about 2.6. These experimental data can be compared with the theoretical values that can be calculated from the chemical formula of the mineral. According to the chemical formula of a typical clinoptilolite, that is: (Na2,K2,Ca)3Al6Si30O72.24H2O), in the mineral there are 30 silicon atoms, 6 aluminum atoms and 96 oxygen atoms, therefore the O/(Si+Al) ratio corresponds to 96/(15+5) = 2.67 and this value is in perfect agreement with the experimental data obtained by EDS, thus proving that the mineral is clinoptilolite. As shown in Figure 3, a diagram (histogram) of all EDS data also allows an immediate displaying of the compound composition.
Fig. 3 - Pie-diagram built with EDS data. This diagram allows to immediatly display the relative abundance of the elements in the compound.
4. Information on zeolites modified by ion exchange
After chemical modification of the zeolites (e.g., ion exchange, treatment with surfactants, etc.), the EDS allows to verify the effectiveness of the performed treatment. For example, when a new type of cation has been inserted into the zeolite crystal lattice by using the ion exchange method, the EDS technique allows to quickly evaluate the obtained result. In the case of K-clinoptilolite, the sodium cation (Na+) is not originally present in the mineral, but after that the mineral has contacted a boiling aqueous solution of sodium chloride (NaCl) for approximately 20min; after repeated washing with hot tap water, the EDS analysis showed the presence of this element (sodium) as well as a greater amount of magnesium (see Figure 4). In particular, the quantity of sodium introduced into the crystal lattice of natural clinoptilolite corresponded to 1.86at.% (2.16% by weight in the first point), while in the second point corresponded to 2.17at.% (2.52% by weight). As can be verified from the overall EDS data reported in Table IV, as a consequence of the ion exchange with a concentrated solution of sodium chloride in tap water, the content of sodium and magnesium ions increased, while the concentration of potassium and calcium decreased. The concentration of the elements belonging to the framework (i.e., silicon, aluminum and oxygen), which are not involved in the ion exchange process, and that of iron, which is a trivalent cation (Fe3+) and therefore it is hardly exchanged by monovalent ions, due to the considerable strength of electrostatic interaction with the negative charges of the framework, remained practically constant.
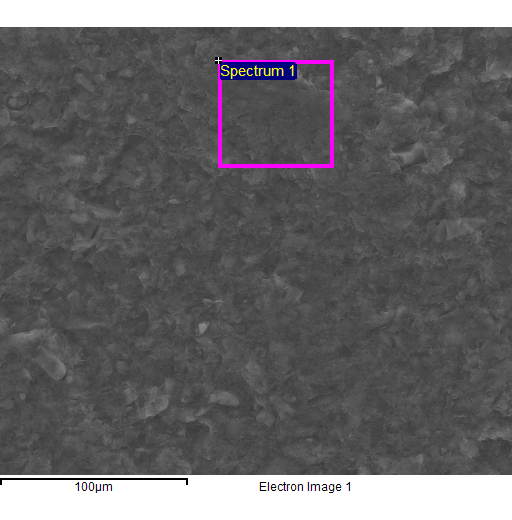
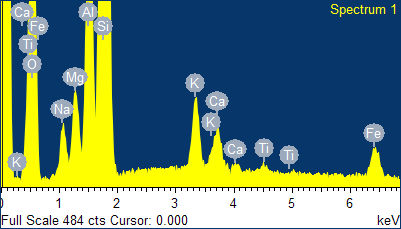
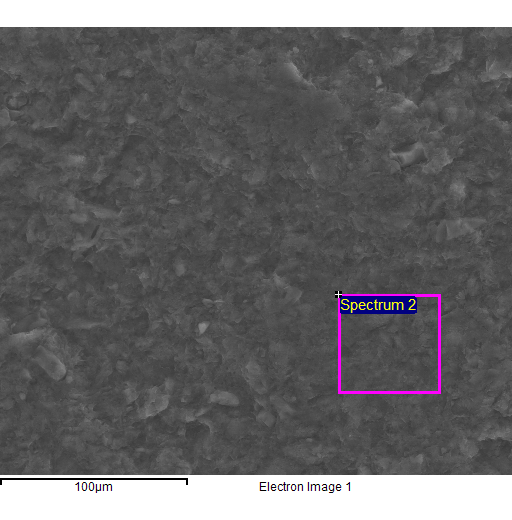
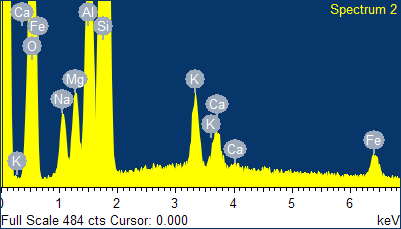
Fig. 4 - EDS spectra of the sample of natural clinoptilolite treated at 100°C with a concentrated aqueous solution of NaCl (and then hot washed repeatedly) and SEM micrographs of the areas where the EDS analysis was carried out.
|
Element |
Before treatment |
After treatment |
|
Na |
- |
1.86 |
|
Mg |
0.30 |
1.81 |
|
K |
1.74 |
0.75 |
|
Ca |
1.15 |
0.39 |
|
Fe |
0.49 |
0.37 |
|
Si |
24.48 |
21.09 |
|
Al |
4.37 |
4.35 |
|
O |
67.47 |
69.33 |
Tab. IV - Comparison between the atomic percentages of the elements before and after the ion exchange treatment.
5. Conclusions
Finally, according to the results given in this short technical report, the characterization of clinoptilolite and other zeolites by energy dispersive X-ray microanalysis (EDS) combined with SEM represents an extremely powerful approach, which is also fast and easy to use.
References
- 1. Mohau Moshoeshoe; A Review of the Chemistry, Structure, Properties and Applications of Zeolites. American Journal of Materials Science 2017, 7, 196-221, 10.5923/j.materials.20170705.12.
- Christopher J. Heard; The effect of water on the validity of Löwenstein's rule. Chem. Sci. 2019, 10, 5705-5711, 10.1039/C9SC00725C.
- D.A.Kennedy; Cation exchange modification of clinoptilolite–Screening analysis forpotential equilibrium and kinetic adsorption separations involving methane,nitrogen, and carbon dioxide. Microporous and Mesoporous Materials 2018, 262, 235-250, https://doi.org/10.1016/j.micromeso.2017.11.054.