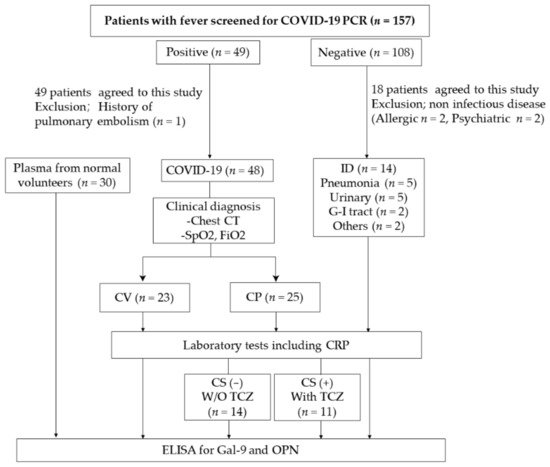
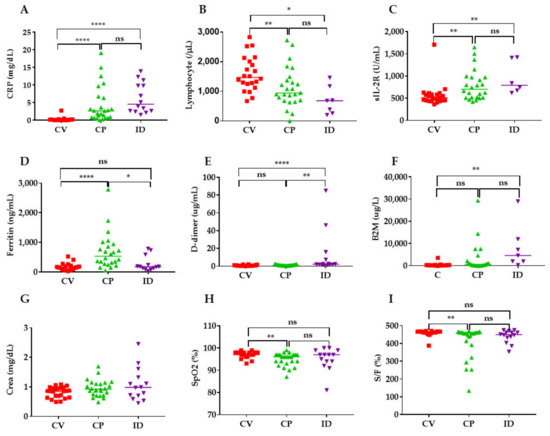
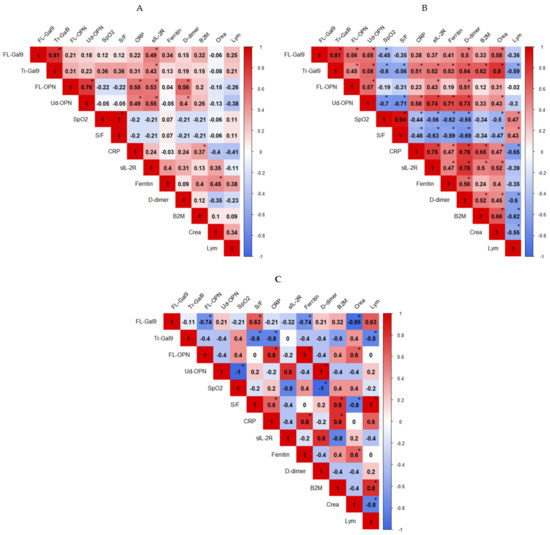
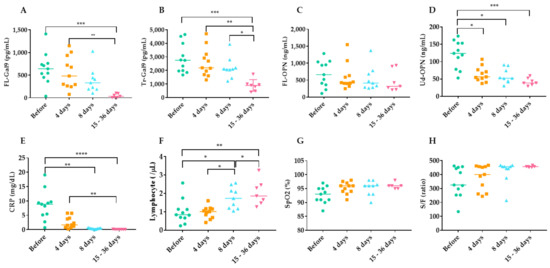
Numbers of patients with coronavirus disease 2019 (COVID-19) have increased rapidly worldwide. Plasma levels of full-length galectin-9 (FL-Gal9) and osteopontin (FL-OPN) as well as their truncated forms (Tr-Gal9, Ud-OPN, respectively), are representative inflammatory biomarkers. Here, we measured FL-Gal9, FL-OPN, Tr-Gal9, and Ud-OPN in 94 plasma samples obtained from 23 COVID-19-infected patients with mild clinical symptoms (CV), 25 COVID-19 patients associated with pneumonia (CP), and 14 patients with bacterial infection (ID). The four proteins were significantly elevated in the CP group when compared with healthy individuals. ROC analysis between the CV and CP groups showed that C-reactive protein had the highest ability to differentiate, followed by Tr-Gal9 and ferritin. Spearman’s correlation analysis showed that Tr-Gal9 and Ud-OPN but not FL-Gal9 and FL-OPN, had a significant association with laboratory markers for lung function, inflammation, coagulopathy, and kidney function in CP patients. CP patients treated with tocilizumab had reduced levels of FL-Gal9, Tr-Gal9, and Ud-OPN.
- COVID-19
- COVID pneumonia
- infectious diseases
- full-length galectin-9
- truncated galectin-9
- full-length osteopontin
- undefined osteopontin
- tocilizumab
- inflammatory markers
- therapy
1. Introduction
2. Clinical Findings

| Reference Range | CV (n = 23) | CP (n = 25) | ID (n = 14) | p Value | ||
|---|---|---|---|---|---|---|
| Basic information |
Age (range) | 36.7 (19–102) | 54.8 (20–99) | 70.11 (23–90) | 0.0002 | |
| Male | 13 (56.5%) | 22 (88%) | 7 (50%) | <0.0001 | ||
| Blood routine test |
WBC 1 (103/µL) | 3.7–8.5 | 4.82 (1.44) 2 | 5.2 (1.22) | 9.08 (4.71) | 0.0046 |
| PLT 3 (104/µL) | 0.15–3.55 | 22.7 (4.1) | 20.6 (7.42) | 20.9 (5.11) | 0.1894 | |
| RBC 4 (106/µL) | 3.9–5.3 | 4.93 (0.80) | 4.72 (0.50) | 4.05 (1.06) | 0.0137 | |
| Biochemical test | ALT 5 (U/L) | 3–40 | 21 (16.6) | 63.6 (55.1) | 21.6 (13.3) | <0.0001 |
| AST 6 (U/L) | 8–35 | 21.6 (6.88) | 51.6 (32.4) | 31.9 (24.7) | <0.0001 | |
| CRP 7 (mg/dl) | 0.00–0.3 | 0.24 (0.56) | 4.36 (5.12) | 6.31 (4.31) | <0.0001 | |
| Alb 8 (g/dl) | 3.8–5.2 | 4.54 (0.60) | 3.90 (0.56) | 3.36 (0.76) | <0.0001 | |
| Coagulation system | PT 9 (sec) | 11.2 | 12.0(0.85) | 11.7 (1.14) | 11.6 (6.34) | 0.0893 |
| CV (n = 23) | CP (n = 25) | ID (n = 14) | ||
|---|---|---|---|---|
| Complications | High blood pressure | 0 | 9 | 2 |
| Hyperlipidemia | 0 | 2 | 2 | |
| Diabetes mellitus | 1 | 7 | 1 | |
| Coronary artery disease | 0 | 0 | 1 | |
| Cerebral infarction | 0 | 1 | 2 | |
| Clinical symptoms | Cough | 6 | 18 | 3 |
| Diarrhea | 4 | 10 | 1 | |
| Dyspnea | 0 | 8 | 4 | |
| Fever | 13 | 17 | 17 | |
| Clinical classification | Asymptomatic | 4 | 0 | 0 |
| Mild | 16 | 2 | 1 | |
| Moderate | 1 | 3 | 6 | |
| Severe | 2 | 16 | 7 | |
| Critical | 0 | 4 | 0 |
3. Levels of Gal-9 and OPN in Patients

4. Levels of Inflammatory, Coagulation, Kidney and Respiratory Indicators in COVID-19 Patients

5. Receiver Operating Characteristic (ROC) Analysis of Inflammatory, Coagulation, Kidney and Respiratory Indicators


6. Correlations between Inflammatory, Coagulation, Kidney and Respiratory Indicators

7. Time Course of Inflammatory, Coagulation, Kidney and Respiratory Indicators during TCZ Therapy

This entry is adapted from the peer-reviewed paper 10.3390/ijms22094978
References
- Hu, B.; Guo, H.; Zhou, P.; Shi, Z.L. Characteristics of SARS-CoV-2 and COVID-19. Nat. Rev. Microbiol. 2021, 19, 141–154.
- Wiersinga, W.J.; Rhodes, A.; Cheng, A.C.; Peacock, S.J.; Prescott, H.C. Pathophysiology, Transmission, Diagnosis, and Treatment of Coronavirus Disease 2019 (COVID-19): A Review. JAMA 2020, 324, 782–793.
- Guan, W.J.; Ni, Z.Y.; Hu, Y.; Liang, W.H.; Ou, C.Q.; He, J.X.; Liu, L.; Shan, H.; Lei, C.L.; Hui, D.S.C.; et al. Clinical Characteristics of Coronavirus Disease 2019 in China. N. Engl. J. Med. 2020, 382, 1708–1720.
- Wang, C.; Horby, P.W.; Hayden, F.G.; Gao, G.F. A novel coronavirus outbreak of global health concern. Lancet 2020, 395, 470–473.
- Fajgenbaum, D.C.; June, C.H. Cytokine Storm. N. Engl. J. Med. 2020, 383, 2255–2273.
- Sun, X.; Wang, T.; Cai, D.; Hu, Z.; Chen, J.; Liao, H.; Zhi, L.; Wei, H.; Zhang, Z.; Qiu, Y.; et al. Cytokine storm intervention in the early stages of COVID-19 pneumonia. Cytokine Growth Factor Rev. 2020, 53, 38–42.
- Jin, Y.H.; Cai, L.; Cheng, Z.S.; Cheng, H.; Deng, T.; Fan, Y.P.; Fang, C.; Huang, D.; Huang, L.Q.; Huang, Q.; et al. A rapid advice guideline for the diagnosis and treatment of 2019 novel coronavirus (2019-nCoV) infected pneumonia (standard version). Mil. Med. Res. 2020, 7, 4.
- Aziz, M.; Fatima, R.; Assaly, R. Elevated interleukin-6 and severe COVID-19: A meta-analysis. J. Med. Virol. 2020, 92, 2283–2285.
- Toniati, P.; Piva, S.; Cattalini, M.; Garrafa, E.; Regola, F.; Castelli, F.; Franceschini, F.; Airo, P.; Bazzani, C.; Beindorf, E.A.; et al. Tocilizumab for the treatment of severe COVID-19 pneumonia with hyperinflammatory syndrome and acute respiratory failure: A single center study of 100 patients in Brescia, Italy. Autoimmun. Rev. 2020, 19, 102568.
- Xu, X.; Han, M.; Li, T.; Sun, W.; Wang, D.; Fu, B.; Zhou, Y.; Zheng, X.; Yang, Y.; Li, X.; et al. Effective treatment of severe COVID-19 patients with tocilizumab. Proc. Natl. Acad. Sci. USA 2020, 117, 10970–10975.
- Campochiaro, C.; Della-Torre, E.; Cavalli, G.; De Luca, G.; Ripa, M.; Boffini, N.; Tomelleri, A.; Baldissera, E.; Rovere-Querini, P.; Ruggeri, A.; et al. Efficacy and safety of tocilizumab in severe COVID-19 patients: A single-centre retrospective cohort study. Eur. J. Intern. Med. 2020, 76, 43–49.
- Colaneri, M.; Bogliolo, L.; Valsecchi, P.; Sacchi, P.; Zuccaro, V.; Brandolino, F.; Montecucco, C.; Mojoli, F.; Giusti, E.M.; Bruno, R.; et al. Tocilizumab for Treatment of Severe COVID-19 Patients: Preliminary Results from SMAtteo COvid19 REgistry (SMACORE). Microorganisms 2020, 8, 695.
- Rosas, I.O.; Brau, N.; Waters, M.; Go, R.C.; Hunter, B.D.; Bhagani, S.; Skiest, D.; Aziz, M.S.; Cooper, N.; Douglas, I.S.; et al. Tocilizumab in Hospitalized Patients with Severe Covid-19 Pneumonia. N. Engl. J. Med. 2021.
- Rossotti, R.; Travi, G.; Ughi, N.; Corradin, M.; Baiguera, C.; Fumagalli, R.; Bottiroli, M.; Mondino, M.; Merli, M.; Bellone, A.; et al. Safety and efficacy of anti-il6-receptor tocilizumab use in severe and critical patients affected by coronavirus disease 2019: A comparative analysis. J. Infect. 2020, 81, e11–e17.
- Bennardo, F.; Buffone, C.; Giudice, A. New therapeutic opportunities for COVID-19 patients with Tocilizumab: Possible correlation of interleukin-6 receptor inhibitors with osteonecrosis of the jaws. Oral Oncol. 2020, 106, 104659.
- Bonifacius, A.; Tischer-Zimmermann, S.; Dragon, A.C.; Gussarow, D.; Vogel, A.; Krettek, U.; Godecke, N.; Yilmaz, M.; Kraft, A.R.M.; Hoeper, M.M.; et al. COVID-19 immune signatures reveal stable antiviral T cell function despite declining humoral responses. Immunity 2021, 54, 340–354.e6.
- De Biasi, S.; Meschiari, M.; Gibellini, L.; Bellinazzi, C.; Borella, R.; Fidanza, L.; Gozzi, L.; Iannone, A.; Lo Tartaro, D.; Mattioli, M.; et al. Marked T cell activation, senescence, exhaustion and skewing towards TH17 in patients with COVID-19 pneumonia. Nat. Commun. 2020, 11, 3434.
- Gibellini, L.; De Biasi, S.; Paolini, A.; Borella, R.; Boraldi, F.; Mattioli, M.; Lo Tartaro, D.; Fidanza, L.; Caro-Maldonado, A.; Meschiari, M.; et al. Altered bioenergetics and mitochondrial dysfunction of monocytes in patients with COVID-19 pneumonia. EMBO Mol. Med. 2020, 12, e13001.
- Bornstein, P.; Sage, E.H. Matricellular proteins: Extracellular modulators of cell function. Curr Opin Cell Biol 2002, 14, 608–616.
- Elola, M.T.; Wolfenstein-Todel, C.; Troncoso, M.F.; Vasta, G.R.; Rabinovich, G.A. Galectins: Matricellular glycan-binding proteins linking cell adhesion, migration, and survival. Cell Mol. Life Sci. 2007, 64, 1679–1700.
- Lu, L.H.; Nakagawa, R.; Kashio, Y.; Ito, A.; Shoji, H.; Nishi, N.; Hirashima, M.; Yamauchi, A.; Nakamura, T. Characterization of galectin-9-induced death of Jurkat T cells. J. Biochem. 2007, 141, 157–172.
- Matsushita, N.; Nishi, N.; Seki, M.; Matsumoto, R.; Kuwabara, I.; Liu, F.T.; Hata, Y.; Nakamura, T.; Hirashima, M. Requirement of divalent galactoside-binding activity of ecalectin/galectin-9 for eosinophil chemoattraction. J. Biol. Chem. 2000, 275, 8355–8360.
- Kon, S.; Nakayama, Y.; Matsumoto, N.; Ito, K.; Kanayama, M.; Kimura, C.; Kouro, H.; Ashitomi, D.; Matsuda, T.; Uede, T. A novel cryptic binding motif, LRSKSRSFQVSDEQY, in the C-terminal fragment of MMP-3/7-cleaved osteopontin as a novel ligand for alpha9beta1 integrin is involved in the anti-type II collagen antibody-induced arthritis. PLoS ONE 2014, 9, e116210.
- Saitoh, H.; Ashino, Y.; Chagan-Yasutan, H.; Niki, T.; Hirashima, M.; Hattori, T. Rapid decrease of plasma galectin-9 levels in patients with acute HIV infection after therapy. Tohoku J. Exp. Med. 2012, 228, 157–161.
- Chagan-Yasutan, H.; Ndhlovu, L.C.; Lacuesta, T.L.; Kubo, T.; Leano, P.S.; Niki, T.; Oguma, S.; Morita, K.; Chew, G.M.; Barbour, J.D.; et al. Galectin-9 plasma levels reflect adverse hematological and immunological features in acute dengue virus infection. J. Clin. Virol. 2013, 58, 635–640.
- Dembele, B.P.; Chagan-Yasutan, H.; Niki, T.; Ashino, Y.; Tangpukdee, N.; Shinichi, E.; Krudsood, S.; Kano, S.; Hattori, T. Plasma levels of Galectin-9 reflect disease severity in malaria infection. Malar. J. 2016, 15, 403.
- Chagan-Yasutan, H.; Lacuesta, T.L.; Ndhlovu, L.C.; Oguma, S.; Leano, P.S.; Telan, E.F.; Kubo, T.; Morita, K.; Uede, T.; Dimaano, E.M.; et al. Elevated levels of full-length and thrombin-cleaved osteopontin during acute dengue virus infection are associated with coagulation abnormalities. Thromb. Res. 2014, 134, 449–454.
- Nishi, N.; Itoh, A.; Fujiyama, A.; Yoshida, N.; Araya, S.; Hirashima, M.; Shoji, H.; Nakamura, T. Development of highly stable galectins: Truncation of the linker peptide confers protease-resistance on tandem-repeat type galectins. FEBS Lett. 2005, 579, 2058–2064.
- Nishi, N.; Itoh, A.; Shoji, H.; Miyanaka, H.; Nakamura, T. Galectin-8 and galectin-9 are novel substrates for thrombin. Glycobiology 2006, 16, 15C–20C.
- Agnihotri, R.; Crawford, H.C.; Haro, H.; Matrisian, L.M.; Havrda, M.C.; Liaw, L. Osteopontin, a novel substrate for matrix metalloproteinase-3 (stromelysin-1) and matrix metalloproteinase-7 (matrilysin). J. Biol. Chem. 2001, 276, 28261–28267.
- Bai, G.; Motoda, H.; Ozuru, R.; Chagan-Yasutan, H.; Hattori, T.; Matsuba, T. Synthesis of a Cleaved Form of Osteopontin by THP-1 Cells and Its Alteration by Phorbol 12-Myristate 13-Acetate and BCG Infection. Int. J. Mol. Sci. 2018, 19, 418.
- Ranucci, M.; Sitzia, C.; Baryshnikova, E.; Di Dedda, U.; Cardani, R.; Martelli, F.; Corsi Romanelli, M. Covid-19-Associated Coagulopathy: Biomarkers of Thrombin Generation and Fibrinolysis Leading the Outcome. J. Clin. Med. 2020, 9, 3487.
- Becker, R.C. COVID-19 update: Covid-19-associated coagulopathy. J Thromb Thrombolysis 2020, 50, 54–67.
- Niki, T.; Fujita, K.; Rosen, H.; Hirashima, M.; Masaki, T.; Hattori, T.; Hoshino, K. Plasma Galectin-9 Concentrations in Normal and Diseased Condition. Cell Physiol. Biochem. 2018, 50, 1856–1868.
- Padilla, S.T.; Niki, T.; Furushima, D.; Bai, G.; Chagan-Yasutan, H.; Telan, E.F.; Tactacan-Abrenica, R.J.; Maeda, Y.; Solante, R.; Hattori, T. Plasma Levels of a Cleaved Form of Galectin-9 Are the Most Sensitive Biomarkers of Acquired Immune Deficiency Syndrome and Tuberculosis Coinfection. Biomolecules 2020, 10, 1495.
- Tan, C.; Huang, Y.; Shi, F.; Tan, K.; Ma, Q.; Chen, Y.; Jiang, X.; Li, X. C-reactive protein correlates with computed tomographic findings and predicts severe COVID-19 early. J. Med. Virol. 2020, 92, 856–862.
- Weinhold, B.; Ruther, U. Interleukin-6-dependent and -independent regulation of the human C-reactive protein gene. Biochem. J. 1997, 327, 425–429.
- Quartuccio, L.; Fabris, M.; Sonaglia, A.; Peghin, M.; Domenis, R.; Cifù, A.; Curcio, F.; Tascini, C. Interleukin 6, soluble interleukin 2 receptor alpha (CD25), monocyte colony-stimulating factor, and hepatocyte growth factor linked with systemic hyperinflammation, innate immunity hyperactivation, and organ damage in COVID-19 pneumonia. Cytokine 2021, 140, 155438.
- Zhang, Y.; Wang, X.; Li, X.; Xi, D.; Mao, R.; Wu, X.; Cheng, S.; Sun, X.; Yi, C.; Ling, Z.; et al. Potential contribution of increased soluble IL-2R to lymphopenia in COVID-19 patients. Cell Mol. Immunol. 2020, 17, 878–880.
- Thachil, J.; Tang, N.; Gando, S.; Falanga, A.; Cattaneo, M.; Levi, M.; Clark, C.; Iba, T. ISTH interim guidance on recognition and management of coagulopathy in COVID-19. J. Thromb. Haemost. 2020, 18, 1023–1026.
- Huang, I.; Pranata, R.; Lim, M.A.; Oehadian, A.; Alisjahbana, B. C-reactive protein, procalcitonin, D-dimer, and ferritin in severe coronavirus disease-2019: A meta-analysis. Ther. Adv. Respir. Dis. 2020, 14, 1753466620937175.
- Cheng, Y.; Luo, R.; Wang, K.; Zhang, M.; Wang, Z.; Dong, L.; Li, J.; Yao, Y.; Ge, S.; Xu, G. Kidney disease is associated with in-hospital death of patients with COVID-19. Kidney Int. 2020, 97, 829–838.
- Sun, D.Q.; Wang, T.Y.; Zheng, K.I.; Targher, G.; Byrne, C.D.; Chen, Y.P.; Zheng, M.H. Subclinical Acute Kidney Injury in COVID-19 Patients: A Retrospective Cohort Study. Nephron 2020, 144, 347–350.
- WHO. Clinical Management of COVID-19—Interim Guidance. Available online: (accessed on 27 June 2020).
