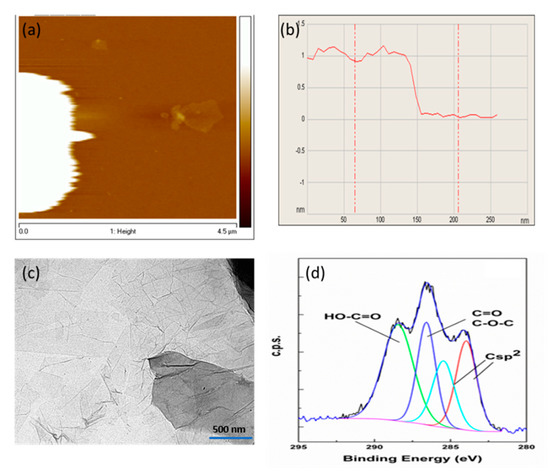
In this study, polyvinylidene fluoride (PVDF)-graphene oxide (GO) membranes were obtained by employing triethyl phosphate (TEP) as a solvent. GO nanosheets were prepared and characterized in terms of scanning and transmission electron microscopy (SEM and TEM, respectively), atomic force microscopy (AFM), X-ray photoelectron spectroscopy (XPS), chemical analysis and inductively coupled plasma mass spectroscopy (ICP).
- PVDF-GO membranes
- photocatalytic membranes
- triethyl phosphate
- GO nanosheets
- dye removal
- photocatalysis
1. Introduction
The shortage of fresh water and increasing industrial discharge from human activities are the most critical concerns in industrialized cities. In this framework, several processes oriented to the treatment and reuse of wastewaters and seawater such as membrane bioreactors (MBRs) [1], membrane distillation [2], solar to steam generation systems [3,4,5] are undergoing rapid expansion.
One of the most important sources of water contamination is the textile wastewater that includes a variety of organic dyes, which should not be underestimated because of their poisonousness, carcinogenic potential and non-biodegradability. From this perspective, effective wastewater treatment technologies with minimum consumption of energy and reagents for chemical conversion of organic dyes into safe (non-toxic) or harmless compounds are required [6]. Photocatalytic membranes, including inorganic [7,8,9,10,11] and polymeric membranes [12,13] under UV [9,14,15,16,17,18], visible [19] and UV-visible [8,20,21] irradiations have been studied. Because of its harmfulness and high-energy consumption, UV irradiation is undesirable. Being ecofriendly and natural, visible light has shown great potential for energy-efficient water purification. In fact, only 4–7% of the solar spectrum is UV and 47% of that is visible light irradiation [8]. Moreover, the majority of polymeric membranes cannot tolerate UV light for long irradiation times, hence expensive ceramic membranes should be preferred, with an increase in capital costs [22]. Coupling visible-light photocatalysis and membrane separation technology in a single stage could simplify the water treatment process in accordance with the strategy of Process Intensification [23]. Membrane technology has been used due to its high selectivity, easy control, operation and scale-up, low environmental impact and low energy consumption. However, the use of volatile and toxic organic solvents, such as N-methyl-2-pyrrolidone (NMP), N,N-dimethylformamide (DMF) and N,N-dimethylacetamide (DMA) which represent the major components during the phase inversion procedure, does not allow most of the current membrane production processes to be defined as “green”. On the contrary, triethyl phosphate (TEP), being completely miscible with water and possessing a high boiling point (215 °C), represents a non-toxic solvent, already studied for polyvinylidene fluoride (PVDF) membrane fabrication in safer operational conditions [21,24,25]. The proper TEP solvency power towards PVDF is also confirmed by thermodynamic factors, that is, Hansen solubility parameters, which clearly evidence that homogeneous PVDF-TEP solutions can be easily obtained [26]. PVDF, with repeated -(CH2CF2)n- units, manifests excellent chemical and mechanical resistance, combined with a good thermal stability, which makes it one of the most preferred materials for membrane fabrication. The use of semiconductor photocatalysts and their blends, such as TiO2 [25], TiO2/SiO2 [27,28], TiO2/RGO [29], TiO2/GO [17,18] and g-C3N4/RGO [19], in the fabrication of photoactive membranes, has attracted considerable interest in recent years. In addition, mainly due to the possibility of being excited by visible light, ideally by using solar light, some of these photocatalysts are able to degrade pollutants as well as to provide antifouling properties due to the presence of high densities of oxygen groups on the photocatalyst particles. Table 1 presents a list of studies related to photocatalytic processes for contaminants’ abatement in membrane technology.
| Membrane | Photocatalyst | Immobilization Method | Irradiation Wavelength | Pollutant Removal Studied | Reference |
|---|---|---|---|---|---|
| Ceramic | GO and TiO2 | Dip-coating technique | UV and visible light | Methyl orange and MB+ | [29] |
| Polysulfone | GO and TiO2 | Layer-by-layer assembly | UV and Sunlight | MB+ | [18] |
| Ceramic | GO and TiO2 | Dip coating method | UV and visible light | Azo dye pollutants | [8] |
| Cellulose | TiO2 and GO&TiO2 | Assembling the nano particle on the flat sheet membrane | UV and visible light | diphenhydramine, methyl orange | [6] |
| Fe2O3/TiO2/GO | Fe2O3/TiO2/GO composite | Composite blending in inorganic membrane | Solar irradiation | Humic acid | [30] |
| PVDF | GO and TiO2 | Blending solutions | UV light | Bovine serum albumin | [17] |
| Cellulose acetate | g-C3N4 NS and RGO | Assembly of nano composite on the commercial membrane | Visible light | Rhodamine B | [19] |
| Polysulfone | N-TiO2 and GO | grafted onto the membrane surface using a pump filter | UV and Sunlight | MB+ | [31] |
Different procedures have been applied for introducing the photocatalyst either on the membrane surface or inside the matrix. These methods mainly include dip coating, photochemical method [32] layer-by-layer assembly [33,34], physical deposition [35], phase inversion [35], biaxial stretching [36], plasma reduction [37]. The immobilization of nanoparticles on the membrane top surface, although offering the possibility to improve photocatalyst performance due to the presence of active sites on the membrane surface, could result in the leaching of photocatalyst nanoparticles during operation [17,38]. In contrast, the preparation of microfiltration (MF)/ultrafiltration (UF) membranes by polymer-photocatalyst blending and subsequent casting of the suspension, although less employed, is more adequate for better anchoring the nanoparticles inside the polymeric matrix and for conferring anti-fouling properties to the membrane [39,40,41,42].
Photocatalysts of nanometric dimension are better choices compared to the traditional large particle size semiconductors [43]. Because of their superior properties, including noticeable thermal stability, high mechanical strength and huge surface interaction, carbon-based nanomaterials are extensively studied [44,45,46,47,48]. Graphene oxide (GO) offers the possibility of the covalent anchoring of organic compounds because of its abundant epoxy and hydroxyl groups located on the basal plane and carboxyl and carbonyl groups placed on the edges of the flat sheets [49,50]. In photocatalysis, GO has attracted great attention due to its easy synthesis, structure and the presence of various functional groups [51,52]. The photocatalytic activity of GO nanostructures was investigated by Krishnamoorthy et al. [53] for the photoreduction in resazurin into resorufin as a function of time under UV irradiation. Hou and Wang [54] reported the use of GO as metal-free photocatalyst producing millimolar levels of H2O2 under visible light irradiation. The photocatalytic activity of GO derives from its semiconductor behavior with an absorption band at about 280 nm, extending near the visible region. The activity of GO has been found to grow with its oxygen content.
In the present work, we reported the preparation of organic–inorganic polymeric membranes for environmental applications. The sustainability of the investigated techniques is given by the use of TEP as non-toxic solvents for the membrane preparation together with the visible light photocatalytic degradation of an organic dye for membrane applications.
GO was synthesized by modified Hummers method [51] while membranes were prepared via Non-Solvent Induced Phase Separation (NIPS) and Vapour-Induced Phase Separation (VIPS)/NIPS.
The photocatalytic performance of PVDF-GO membranes was examined for the degradation of methylene blue (MB+) under visible light irradiation (λ > 420 nm). The effect of pH and the presence of sodium chloride in the dye aqueous solution were also investigated.
2. Characterization of the GO Nanosheets
3. Membrane Characterization
SEM images of M1–M3 membranes, prepared with the polymer and the solvent at different exposure times, are presented in Figure 3.
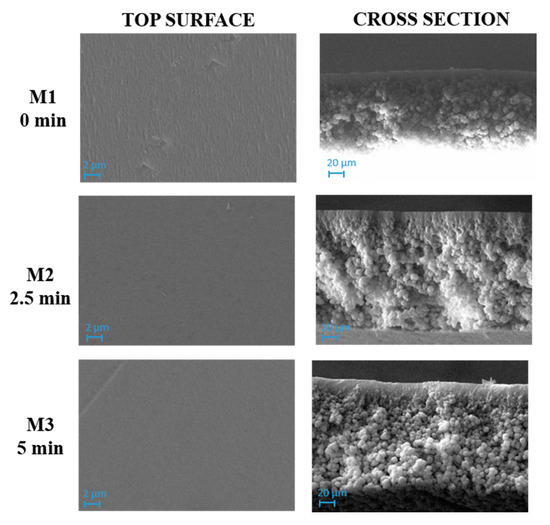
SEM images evidenced a compact structure for M1, M2 and M3 membranes with no relevant differences between them. A dense layer on the top surface and a spherulitic matrix was formed for the three membranes. This observation could be explained by considering the high hydrophobicity of PVDF, which caused a fast demixing with the formation of a skin layer [57].
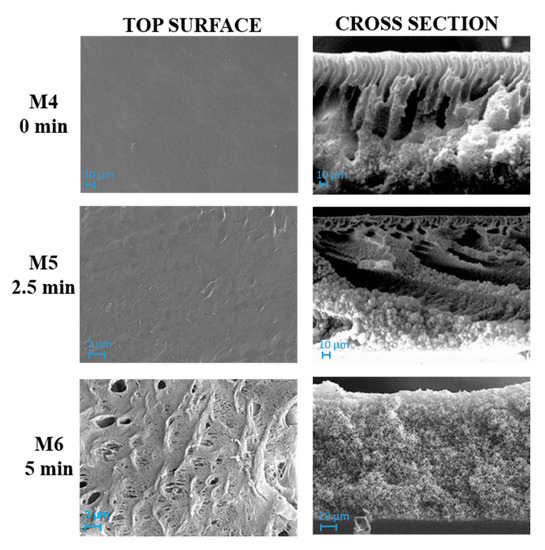
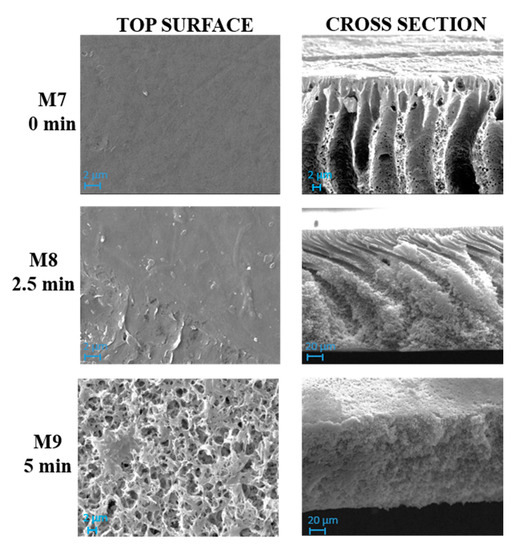
Figure 4 and Figure 5 show SEM pictures of M4–M6 and M7–M9, respectively, in which both types of membranes were prepared by including PVP and PEG in the casting solution formulation.
The influence of the NIPS/VIPS preparation procedure, during which the nascent films were exposed for different times to water vapour, was observed for both membrane types prepared with and without GO.
The solvent–non-solvent exchange rate represents one of the most affecting parameters during membrane formation. It is well known, for example, that the presence of water in vapour form during VIPS step, promotes a delayed demixing, thus favoring the formation of a more porous, sponge-like structure in comparison with NIPS process. However, it should be mentioned that, during polymer precipitation, kinetic factors also play a relevant role for the polymeric chains’ arrangement. Thermodynamic factors are related to polymer precipitation behavior, while kinetic factors are related to the exchange rate of solvent/nonsolvent during phase separation [58]. The combination of the two factors results in different membrane structure and properties [59].
As can be seen in Figure 4, M4 membrane was significantly affected by the addition of pore-forming additives compared to the analogue M1 membrane formed from a PVDF-TEP solution. The M1 membrane showed a high compact structure, while M4 exhibited a finger-like structure on the top surface, surrounded by a cellular, porous layer. The presence of macrovoids across the entire cross section was observed for M7, which differed from M4 for the presence of GO.
The addition of additives dramatically increased the miscibility of solvent with non-solvent, therefore the creation of fingers and macrovoids was favored for M4 and M7. When the NIPS/VIPS method was adopted, the demixing rate between the solvent and the non-solvent was delayed, thus the presence of fingers and macrovoids gradually disappeared, with the formation of completely spongy membranes when the time interval reached 5 min [60]. The addition of PVP and PEG as pore-forming agents and GO nanosheets into the dope solutions increased the hydrophilicity of the dope solution. Due to its high solubility in water, PEG instantaneously dissolved in water during NIPS and left large macrovoids inside the membrane [61]. This analogy can be clearly observed in cross-section images of M1, M4, and M7 reported in Figure 3, Figure 4 and Figure 5, respectively. The presence of PVP and PEG as pore-forming agents, together with GO, led to different morphologies, depending on the exposure time of the nascent film to water in vapour form. On the one hand, a porous matrix with macrovoids was observed when immersion-precipitation was adopted; in this case, the hydrophilic character of both additives and catalyst promoted a rapid TEP-water exchange. On the other hand, the increase in polymeric solution viscosity, due to the presence of PVP, PEG and GO as opposed to the mass transfer during phase inversion, led to a spongy matrix when the NIPS/VIPS procedure was followed and the nascent film was exposed to humid air for 5 min (Figure 5).
The exposure time to humidity (from 2.5 to 5 min) greatly affected the morphology of the membranes prepared with additives (Figure 4 and Figure 5). The exposure of the cast film to a humid environment promoted the formation of a more porous structure on the surface while, along the cross-section, it favored the formation a spongy architecture. The porogen effect of humidity is a quite well studied phenomenon and it is related to the adsorption, by the cast film, of water molecules from the humid air, which delays the phase-inversion process, fostering the creation of a porous and sponge-like structure [25,62,63,64,65].
Figure 6 presents the morphology of M10, i.e., the analogue M8 membrane (0.125 wt % GO) prepared by increasing GO content (0.5 wt %). The increase in GO concentration in the casting solution favored the increase in solution viscosity, thus delaying the demixing rate with the formation of a symmetric, sponge-like structure. The presence of GO nanosheets in the M8 and M10 can be clearly observed in the images provided in Figure 7 taken at a higher magnification.
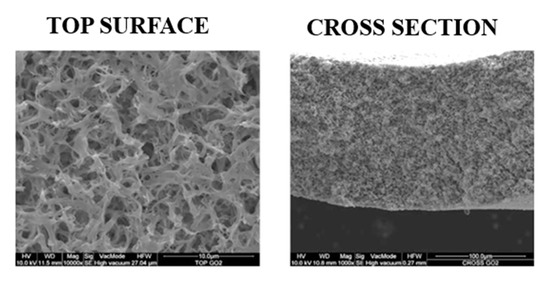
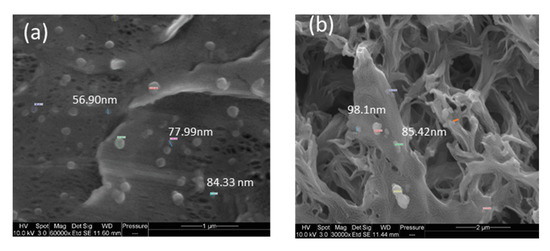
Figure 7. Images showing the presence of GO nanosheets: (a) M8 top surface (Magnification: 60,000×) and (b) M10 top surface (Magnification: 30,000×).
The effects of modification on the top surface morphology and roughness parameter of the fabricated membranes were also studied by AFM (Figure 8). The topography was measured on five different areas of the membrane surface and the root mean square (RMS) roughness (Sq), roughness average (Sa), and peak to peak value (Sz) were calculated. The obtained data and the respectively standard deviation are reported in Table 3.
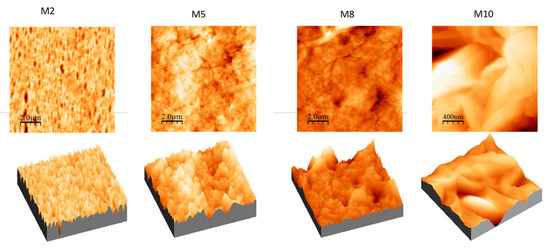
Figure 8. AFM images with corresponding 3D views of M2, M5, M8 and M10 membranes deriving from films exposed to humidity for 2.5 min during VIPS-NIPS.
Table 3. The roughness parameters of the membranes under study.
|
Membrane |
Root Mean Square |
Average Roughness |
Mean Difference between Peaks and Valleys |
|---|---|---|---|
|
Sq (nm) |
Sa (nm) |
Sz (nm) |
|
|
M1 |
21.01 ± 0.21 |
16.25 ± 0.10 |
165.09 ± 25.94 |
|
M2 |
17.76 ± 0.89 |
13.23 ± 0.62 |
179.30 ± 29.21 |
|
M3 |
11.89 ± 0.22 |
9.39 ± 0.21 |
125.50 ± 17.73 |
|
M4 |
33.86 ± 5.58 |
26.33 ± 3.82 |
271.66 ± 37.86 |
|
M5 |
33.25 ± 1.53 |
26.30 ± 1.11 |
281.84 ± 44.83 |
|
M6 |
91.90 ± 2.47 |
70.12 ± 0.84 |
753.38 ± 20.56 |
|
M7 |
34.10 ± 6.33 |
25.91 ± 4.06 |
224.01 ± 30.01 |
|
M8 |
30.61 ± 4.37 |
25.04 ± 3.22 |
186.19 ± 4.00 |
|
M9 |
43.41 ± 15.69 |
32.82 ± 11.81 |
267.75 ± 3.39 |
|
M10 |
194 ± 14.35 |
146 ± 10.15 |
1465 ± 30.80 |
Based on the extrapolated data and the series of images, it is possible to notice the following features:
-
For membranes prepared with only polymer and solvent (M1, M2 and M3 membranes), the roughness decreased with increasing exposure time to humidity (0–2.5–5 min). This result is in agreement with the SEM images (Figure 4) that show a dense skin layer on the top surface;
-
For membranes obtained using PVP and PEG (M4, M5 and M6 membranes) as pore-forming agents, the roughness increased in relation to the humidity exposure time. In fact, these three membranes presented a more porous morphology, as already observed in the SEM images (Figure 5). In particular, the M6 membrane presented the highest roughness value;
-
With respect to M4, M5 and M6 membranes, when GO nanosheets at 0.125 wt % were added to the dope solution (M7, M8 and M9 membranes), roughness value remained constant. The only exception was at the highest humidity exposure time of 5 min (M6 and M9 membranes), where the roughness (Sa) exhibited a decline from 70.12 nm (M6) to 32.82 nm (M9);
-
Moreover, when the 0.5 wt % of GO was used (M10 membrane), a membrane with higher roughness was observed. This result could be explained by the agglomeration of particles in the mixed-matrix membrane and the loss of uniformity due to the formation of more pores on the surface arising from the lower miscibility of the dope solution [66];
-
In all cases, for all the membranes prepared with PVP and PEG, the average roughness was enhanced compared to M1–M3 membranes. Furthermore, M7–M9 membranes with higher cavities and pores on the surface possessed higher roughness that led to an increased permeability. The intensification of GO concentration in membranes generally exhibited higher roughness compared to those with lower concentrations (as in the case of M10).
For water treatment applications, membrane hydrophilicity, assuring water passage through membrane pores and reducing fouling, represents a key parameter.
Typically, to measure the hydrophilic properties of the membranes, CA is used. The values of CA for the membranes (top side and bottom side) are listed in Table 4. According to CA measurements (top sides), the hydrophilic character of M1–M3 membranes was independent from delay time as well as SEM, AFM and PWP characterization, and may be due to PVDF chains arrangement during phase inversion. The presence of hydrophilic pore-forming agents in the dope solution, i.e., PVP and PEG, led to the reduction in membrane CA for M4 (CA 65 ± 2°) prepared via NIPS. However, by coupling NIPS with VIPS, more hydrophobic membranes were obtained, and the CA increased with the increase in exposure time to a controlled relative humidity from 2.5 to 5 min. In fact, M5 showed a CA of 77 ± 2°, while M6 had a CA of 108 ± 3°. These results may be related to the membrane roughness, which increased concomitantly by extending the interval times during the VIPS step. Similar results were reported in the literature [67]. Decreased roughness means smoother surfaces for M7–M9 membranes, which in turn results in a decreased contact angle [68]. The increase in membrane hydrophilicity was due to the well-distributed GO nanosheets on the top surface of the membranes that attracted water molecules and created a thin shielding water layer on the pores [69]. This was at the basis of the very hydrophilic nature of M10 membrane prepared with the highest concentration of GO.
Table 4. Thickness and contact angle (CA) of the prepared membranes.
|
Membrane |
Thickness (µm) |
CA |
|
|---|---|---|---|
|
Top Side (°) |
Bottom Side (°) |
||
|
M1 |
121.4 ± 1.7 |
72 ± 3 |
102 ± 2 |
|
M2 |
123.7 ± 1.3 |
71 ± 3 |
106 ± 3 |
|
M3 |
132.5 ± 1.5 |
75 ± 1 |
112 ± 2 |
|
M4 |
144.1 ± 3.2 |
65 ± 2 |
106 ± 1 |
|
M5 |
159.0 ± 5.5 |
77 ± 2 |
117 ± 2 |
|
M6 |
170.5 ± 7.0 |
108 ± 3 |
130 ± 2 |
|
M7 |
158.6 ± 1.2 |
61 ± 2 |
100 ± 3 |
|
M8 |
161.0 ± 0.9 |
68 ± 2 |
129 ± 1 |
|
M9 |
163.4 ± 1.4 |
82 ± 3 |
125 ± 3 |
|
M10 |
162.5 ± 1.2 |
63 ± 3 |
118 ± 3 |
CA assessment for M7–M9 membranes revealed a positive effect of GO on membrane hydrophilicity. In fact, the incorporation of GO nanosheets in the polymeric matrix promoted the formation of oxygen functional groups (such as hydroxyl and carboxyl groups) on the top surface, increasing the hydrophilic membrane character. However, similarly to what has been observed for MB-type membranes, when the exposure time to water, in vapour form, passed from 0 to 2.5, until 5 min, the CA increased, due to the increase in membrane roughness [70]. Representative CA pictures of M1 and M7 membranes are reported in the SI (Figure S3).
The results obtained for the membrane pore size and PWP are reported in Figure 9. By increasing the time intervals during the VIPS step, M1–M3 membranes, having a pore diameter in the range between ~0.06 and ~0.08 m, were not significantly affected; in other words, the exposure time to relative humidity did not play a relevant role for membrane pore size determination. On the contrary, by varying the casting solution composition, evident changes in mean flow pore diameter were detected.
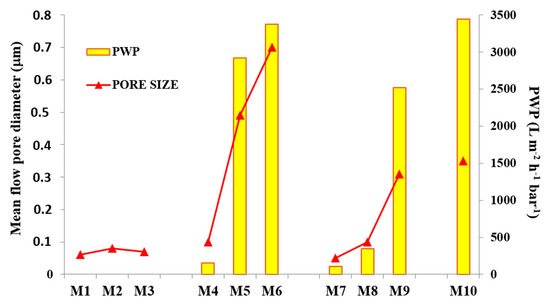
The addition of PVP and PEG, as shown and explained in SEM pictures, fostered the formation of a more porous structure, which resulted in membranes with a larger pore size and, therefore, a higher PWP.
M4 showed a pore size of ~0.1 m, increased up to ~0.5 m for M5 and reached a value of ~0.7 m for M6. Hence, the combination of a PVDF-TEP and PVP-PEG dope system, together with VIPS/NIPS preparation procedure, allowed for tailoring the membrane pore size. By adding GO to the dope solution, a decrease in the membrane pore size for M8 and M9 was noted. Although further investigations should be necessary to better understand the reduction in membrane pore size, a first explanation could be associated with the dope solution viscosity, which increased when GO nanosheets were added to the polymer-solvent-additives solution. Similar results are reported in the literature by Zhu et al. [71]. Furthermore, the competition between the solvent and the nano-fillers to exchange with the non-solvent caused a lower mean flow diameter. By using a higher GO concentration, i.e., 0.5 wt %, the resulting M10 membrane exhibited a pore size in the MF range (~0.35 m). The PWP results are presented in Figure 9. M1–M3 membranes showed no PWP up to three bars. The reason for this can be ascribed to a compaction phenomenon which may have occurred during membrane pressurization, which caused a constriction of the small pores, blocking the permeation of water. The analogue M4 and M7 membranes, on the contrary, resulting from solutions containing additives and GO-fillers, respectively, allowed water to pass across membrane pores. Specifically, M4 exhibited a PWP of ~150 L·m−2 h−1 bar−1, while M7 had a ~110 L·m−2 h−1 bar−1. For the membranes prepared via NIPS/VIPS, the PWP reflected the pore size results: PWP increased when the exposure time to non-solvent in vapour form passed from 2.5 to 5 min. In general, the increase in exposure time to humidity promoted the formation of membranes with a larger pore size and higher PWP.
The best results in terms of PWP were obtained for M6 (~3400 L·m−2 h−1 bar−1), which had a mean flow pore diameter of ~0.7 m.
Membrane porosity is strictly correlated with the membranes’ morphology. All the membranes prepared with the casting solution composed of PVDF and TEP (M1–M3), exhibited a porosity near to or lower than ~80%, which is in accordance with the SEM images shown in Figure 3. On the contrary, by adding PVP and PEG to the dope solution, the resulting membrane presented a higher porosity, which further increased with the presence of GO, reaching a value of ~87%. However, a GO content of 0.5 wt % caused a reduction in porosity for M10, probably due to the blocking of pores by catalyst nanosheets’ aggregation. The results of the tensile strength and elongation tests are shown in Table 5. The Young’s modulus for all of the membranes was improved when GO, together with PVP and PEG, was added to the dope solution in comparison to the analogue polymeric pristine PVDF membranes. These results could be explained in terms of GO’s superior mechanical stability, high surface area and aspect ratio [40]. The positive effect of GO on the membrane mechanical features is confirmed by the elastic modulus of M10, for which a value of ~45 N/mm2 was detected. Elongation at break revealed high values for all the prepared membranes, with a maximum of ~50% for M8. However, for M9 and M10, a decline in membrane elongation was observed, probably due to GO aggregation at the point of breakage.
Table 5. Mechanical properties and porosity of the prepared membranes.
|
Membrane |
Young’s Modulus |
Elongation at Break |
Porosity |
|---|---|---|---|
|
N/mm2 |
E% |
% |
|
|
M1 |
25.3 ± 0.3 |
27.2 ± 3.6 |
77.8 ± 0.5 |
|
M2 |
21.5 ± 0.5 |
20.4 ± 4.6 |
78.4 ± 0.4 |
|
M3 |
29.6 ± 0.1 |
40.5 ± 1.3 |
79.5 ± 0.9 |
|
M4 |
18.7 ± 3.4 |
40.9 ± 2.8 |
83.5 ± 0.8 |
|
M5 |
18.7 ± 3.3 |
22.5 ± 1.3 |
84.5 ± 0.4 |
|
M6 |
14.4 ± 2.2 |
47.0 ± 1.9 |
82.8 ± 0.2 |
|
M7 |
22.6 ± 3.4 |
30.8 ± 1.1 |
86.7.± 0.4 |
|
M8 |
22.1 ± 2.5 |
50.3 ± 2.4 |
87.5 ± 0.9 |
|
M9 |
23.2 ± 3.9 |
3.0 ± 1.2 |
86.4 ± 0.4 |
|
M10 |
44.4 ± 1.4 |
2.4 ± 1.3 |
83.7 ± 0.7 |
Carbon derivatives, due to their excellent mechanical properties, are the best additives for improving the mechanical strength of the membranes. A large number of functional groups on the GO nanosheets’ surface can create a stable cross-linked network with the PVDF polymer. Hence, GO nanosheets can increase the mechanical properties of the membrane due to more favorable inherent properties.
This entry is adapted from the peer-reviewed paper 10.3390/polym12071509