Sample preparation is an essential and preliminary procedure of most chemical analyses. Due to the sample diversity, the selection of appropriate adsorbents for the effective preparation and separation of different samples turned out to be important for the methods. By exploiting the rapid development of material science, some novel adsorption materials, especially graphene-based nanomaterials, have shown supremacy in sample pretreatment. In this review, a discussion between these nanomaterials will be made, as well as some basic information about their synthesis. The focus will be on the different environmental applications that use these materials.
- graphene
- nanomaterials
- sample preparation
- environmental analysis
- magnetic solid phase extraction
- solid phase extraction
- magnetic nanoparticles
1. Introduction
Oftentimes, the concentration of the target compounds may be lower than the limits of detection (LOD) even for the most advanced instruments, especially for trace or ultra-trace analytes in complex matrices. With sample preparation, we eliminate the above problem by preconcentrating the low concentrations of the molecules, thus enhancing the sensitivity and rendering it possible to detect them [1]. While this step is time-consuming and sometimes costly, there are green approaches which lower the cost and the time needed to pretreat a sample. Some extra benefits that sample preparation provides are the removal of contaminants or substances that interfere with the compounds of interest (cleanup), the dissolution of a solid sample into an aqueous media or the chemical modification with the proper reagents so as to obtain better analytical parameters (lower LODs, higher recoveries, higher selectivity and sensitivity, improved accuracy and repeatability and etc.) [2].
Lately, there has been a huge interest in graphene (G) and graphene-based nanomaterials, with scientists all over the world studying and publishing a variety of topics regarding its properties and its use in the sample pretreatment of a plethora of samples, matrices and target analytes [3,4,5,6,7,8,9,10,11,12,13,14,15,16,17,18,19,20,21,22,23,24,25,26,27,28,29,30,31,32,33,34,35,36]. Some of these applications include wastewater treatment [37], such as carbon dioxide adsorption [38], photocatalysis [39] graphene oxide membranes [40] and so forth. Graphene is a single layer of two dimensions of sp2 hybridized carbon atoms arranged into a honeycomb grid. Due to this formation, G shows extraordinary properties, such as high mechanical strength, excellent optical, great electronic and thermal properties with a vast surface area of 2630 m2/g [35,36]. The combination of its high surface area and its hexagonal array with delocalized π-π electron interactions renders it ideal for the adsorption of aromatic compounds and their derivatives, which also intrigues the analytical chemists to use it as a sorbent [41]. The most common way of producing G is via the chemical oxidation and sonication of graphite to graphene oxide (GO) with the Hummers method and its subsequent reduction of GO to reduced G (rGO) (Figure 1) [42,43]. Organic analytes can be adsorbed onto G with the development of potent π-π interactions between the carbon rings of the analytes and the hexagonal carbons of G [44]. GO provides a variety of functional groups, making electrostatic interactions possible and enabling hydrogen bonding possible for the organic molecules that contain N- and/or O- functional groups. Other possible interactions between the analytes and the nanoparticles are dispersion forces, dative bonds and hydrophobicity [45]. G and GO are oftentimes modified so as to be more selective towards the compounds of interest or to enhance their adsorption properties and recovery rates (Figure 2).
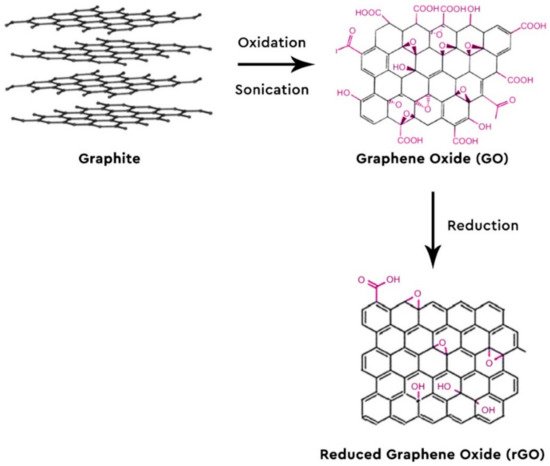
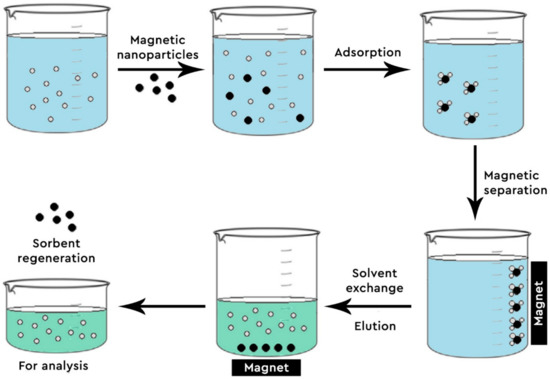
Figure 2. Steps of Magnetic Solid Phase Extraction (MSPE).
2. Graphene-Based Nanomaterials and Nanocomposites
One of the assets provided by graphene-based materials is selective adsorption. The rGO presents a large π-electron system, making it ideal for the adsorption of organic compounds that consist of aromatic rings. The GO has several functional groups that favor the adsorption of organic molecules containing oxygen- or nitrogen-functional groups.
Even though graphene-based materials (G, GO and rGO) have an enhanced ability of absorbing many and different compounds, they show a significant drawback; the difficulty of the material with the adsorbed analytes being separated from the mother solution. To combat this problem, magnetic nanoparticles (MNPs) are impregnated into rGO or GO. Thus, the combination of high adsorption capacity from G and the convenient separation of the adsorbent from the sample, given from the MNPs, makes these nanocomposites ideal for analytical purposes [43]. Moreover, Fe3O4 nanoparticles are non-toxic, have a small particle size, offer high reactivity and possess a vast specific surface area, adding to the benefits of their usage and rendering them more appealing [46,47].
2.1. Synthesis of Magnetic Nanoparticles
The common methods for synthesizing MNPs are co-precipitation, thermal decomposition, hydrothermal synthesis, colloidal and high-energy ball mill. Depending on which method was used, a specific size and dispersion of size distribution of MNPs are obtained [48].
The modified co-precipitation method introduced by Massart includes the addition of FeCl3·6H2O and FeCl2·4H2O in deionized water, with the temperature rising to 60 °C in order to acquire a yellow and clear solution and stirred vigorously. Afterwards, aqueous ammonia is inserted drop by drop until the pH reaches 10. Then, it is left for the reaction to take place for about 30 min, under continuous and vigorous stirring. Throughout the whole experiment, N2 is used as a protective gas. When the reaction finishes, the black precipitate is collected with the help of a strong magnet, it is washed many times with deionized water and ethanol. Lastly, the magnetite nanoparticles are lyophilized [49,50].
The thermal decomposition method carried out by Kluchova et al. produced maghemite nanoparticles by the solid-state isothermal decomposition in air at 400 °C of Fe(C2H3O2)2·2H2O for 1 h. Before the synthesis, the solid was homogenized in an agate mortar, following in the precursor particles having a size distribution of 1–5 μm [51].
Zheng et al. [52] produced Fe3O4 nanoparticles by hydrothermal synthesis, where 1 mmol of Fe(NO3)3·9H2O and 0.5 mmol of sodium bis(2-ethylhexyl)sulfosuccinate were added in 10 mL deionized water, following the addition of 2 mL of 50% hydrazine hydrate while stirring. This solution was put into a 20 mL Teflon-lined stainless-steel autoclave of and heated to 160 °C at a pace of 5 °C/min. For 10 h, the temperature was kept at 160 °C and then the mixture brought to room temperature naturally. The nanoparticles were filtered, washed several times with ethanol and deionized water and air-dried. The morphology and the structure of the MNPs were characterized by TEM, HRTEM and XRD.
Another procedure for synthesizing Fe3O4 magnetic nanoparticles is by the microwave-solvothermal method suggested by Li et al. [53], where 5 mmol of FeCl3·6H2O, 400 mg of Na3C6H5O7 and 50 mmol of NH4CH3CO2 were added in a solution of 70 mL of ethylene glycol. The black solution was stirred and heated and then transferred into a microwave transparent PTFE-TFM-lined alumina ceramic vessel, with the capacity of 100 mL. Then, it was heated for 15 min to 260 °C for 2 h in a microwave reaction system. Finally, the black powder of Fe3O4 was gathered with the help of a strong magnet and washed several times with ethanol.
2.2. Synthesis of Fe3O4-GO Nanocomposites
Kyzas et al. [50] presented two ways of preparing magnetic GO (mGO): by co-precipitation (mGOp) or by impregnation (mGOi). In the former method, graphite oxide is scattered in deionized water with the help of a sonicator for 30 min. Then, specific amounts of FeCl3·6H2O and FeCl2·4H2O are dissolved in deionized water at room temperature and the mixture is added drop by drop to the GO solution, under vigorous stirring and under a N2 atmosphere. After the completion of ion exchange, 28% v/v ammonia solution is added dropwise so the pH reaches the value of 10 for the synthesis of MNPs. Next, the solution is heated to 80 °C and after agitating for 45 min, the black solid is collected via centrifugation, is washed many times with CH3OH and is lyophilized. In the latter method, graphite oxide is again added in deionized water and put into a sonicator for 30 min to obtain GO and then an amount of Fe3O4 nanoparticles are added to the mixture. After another 30 min, a homogenous suspension is obtained and the nanocomposites are collected by centrifugation and freeze-dried.
The aforementioned material was studied for dye adsorption experiments, with Reactive Black 5 (C26H21N5Na4O19S6) being the target compound. From the X-ray diffraction measurements (XRD) presented in the paper, the average crystallite size of the MNPs were found to be around 18.4 nm. Scanning electron microscopy images were taken to identify the morphology of the mGOi nanoparticles and the iron distribution map of the material. Also, the magnetization of the two materials were studied and the mGOi adsorbent had 65 emu/g, which was a bit higher than the same value of mGOp. Lastly, from Fourier transform infrared (FT-IR)spectra, the identification of functional groups, such as carboxylic groups, epoxy groups and ammonium groups, was carried out.
2.3. Synthesis of GO Membranes Composites
Deng et al. [54] firstly prepared hydroxylated graphene (GOH), by using ferrous chloride and hydrogen peroxide at certain volume ratios, while adjusting the pH with diluted HCl, and GO with a modified Hummers method. Then, 1 mg of GO and 1 mg of GOH were mixed into a beaker, under ultrasonication for 30 min to form a uniform dispersion and the solution was put onto the polyethersulfone membranes of pore sizes 0.22 μm and 1 μm under vacuum.
The morphology and validation of the deposition of the material on the membrane was done via scanning electron microscopy (SEM) and X-ray diffraction (XRD). The performance of the adsorption properties was evaluated with dye compounds, such as rhodamine B and methyl orange, and with the protein albumin from bovine serum.
2.4. Synthesis of Graphene Aerogels
Zhi et al. [55] showcased in a review seven different ways of preparing graphene aerogels, either with no templates or with a template. The methods that require no template are the hydrothermal method, where a GO colloidal dispersion is prepared in ethanol or water, heated at a certain temperature and freeze-dried, dried in atmospheric and in supercritical conditions, the chemical reduction method, by using a reducing agent, the chemical cross-linking method, to enhance the interaction between the graphene oxide sheets with the usage of glutaraldehyde or poly(vinyl alcohol), and a 3D printing method, with the preparation of a high viscosity ink of SiO2 and GO suspension. The latter methods thar require a template are the chemical vapor deposition method, where 3D graphene is prepared by the chemical vapor deposition of carbon onto a metal foam, like copper or nickel, the ice template method, by freezing a GO suspension and its gradual melting to form a porous aerogel with GO, and the bubble template method, with the utilization of a surfactant under vigorous stirring so that the GO is trapped in the bubbles and begins to form.
2.5. Synthesis of GO Alginate Beads
Arshad et al. [56] prepared alginate beads of GO by adding 0.2 g sodium alginate in a 5 wt.% GO suspension in deionized water and then deposited dropwise into a 5 wt.% calcium chloride solution. The alginate beads that were formed were kept in the solution for 3 h. These beads were used for the removal of metals and organic compounds, with maximum adsorption capacities reaching 588.2 mg/g bead.
3. Analytical Applications in Environmental Samples
The environmental applications of graphene-based nanomaterials and nanocomposites are classified into two categories: in the extraction and determination of (i) organic pollutants and (ii) metal ions and rare earth elements. Some of the organic compounds that are examined with these materials are Polycyclic Aromatic Hydrocarbons (PAHs), estrogens, sulfonamides, chlorophenols and so forth, whilst the second category consists of Hg, Cr(III), Cd, Cr(VI), Au, Co, Cu, Zn, Pb(II), Ce(III), Tl(III) and other [57,58]. (Table 1, Table 2)
Table 1. Recent applications of graphene-based nanomaterials in environmental analysis.
|
Adsorbent |
Analyte(s) |
Applications |
Sample Preparation |
Analytical Technique |
LODs |
EF 1 |
Reference |
|---|---|---|---|---|---|---|---|
|
G |
Co(II), Ni(II) |
Tap, river and sea water |
SPE |
FAAS |
0.36, 0.51 μg/L |
200 |
[59] |
|
GO-silica |
Mn(II), Co(II), Ni(II), Cu(II), Cd(II), Pb(II) |
Well, pond and lake water |
HF-SPME |
ICP-MS |
7.5, 0.39, 20, 23, 6.7, 28 ng/L |
10 |
[60] |
|
G |
Sulfonylurea herbicides |
Environmental water samples |
SPE |
UHPLC-MS |
0.28–0.53 ng/L |
N/R 2 |
[61] |
|
GO |
Mn(II), Fe(III) |
Tap, mineral, river water |
SPE |
FAAS |
0.145, 0.162 μg/L |
325 |
[62] |
|
GO-silica |
Cu(II), Pb(II) |
Mineral, waste and sea water |
SPE |
FAAS |
0.084, 0.27 μg/L |
200–250 |
[63] |
|
GO-EDA |
Fe(III), Co(II), Ni(II), Cu(II), Zn(II), Pb(II) |
Waste water from industry |
d-μSPE |
ED-XRF |
0.07, 0.10, 0.07, 0.08, 0.06, 0.10 μg/L |
N/R |
[64] |
|
GO |
Co(II), Ni(II), Cu(II), Zn(II), Pb(II) |
Waste water from industry |
d-μSPE |
ED-XRF |
0.5, 0.7, 1.8, 1.5, 1.4 μg/L |
N/R |
[65] |
|
GO |
Co(II), Ni(II) |
Mineral and spring water |
SPE |
FAAS |
0.25, 0.18 μg/L |
250 |
[66] |
|
GO |
Cr(III), Co(II), Ni(II), Cu(II), Zn(II), Pb(II) |
Environmental water samples |
d-μSPE |
ED-XRF |
0.07–0.25 μg/L |
N/R |
[67] |
|
GO-Gly |
Cr(III), Cu(II), Zn(II) |
Tap, river, estuarine and lake water |
d-μSPE |
ED-XRF |
0.15, 0.07, 0.08 μg/L |
1575, 890, 810 |
[68] |
|
GO-S |
Cu(II), Zn(II), Pb(II), Cr(III) |
Lake, river, mineral, spring and sea water |
d-μSPE |
ED-XRF |
0.06–0.10 μg/L |
520–3120 |
[69] |
|
GO |
Pb(II), Cd(II), Cr(III) |
River water |
CHd-μSPE |
ETAAS |
0.035, 0.005, 0.012 μg/L |
14.7, 16.1, 15.4 |
[70] |
|
GO-MWCNT |
Cr(III), Fe(III), Pb(II), Mn(II) |
Wastewater |
SPE |
ICP-OES |
0.16, 0.50, 0.24, 0.38 μg/L |
75 |
[71] |
|
GMeS |
Sulfonamides |
Lake water |
SPE |
HPLC |
0.10–0.29 μg/kg 3 |
96–99 |
[72] |
|
GO-TTC |
Pb(II), Cu(II) |
Sea water |
SPE |
FAAS |
0.32, 0.13 μg/L |
83.3 |
[73] |
|
GO-sponges |
Methylene blue |
Wastewater |
N/R |
UV-vis |
N/R |
N/R |
[74] |
|
GO-MMT/SA |
Methylene blue |
Wastewater |
N/R |
UV-vis |
N/R |
N/R |
[75] |
1 EF = Enrichment Factor., 2 N/R = Not Reported., 3 Only the Limit of Quantification (LOQ) was reported.
Table 2. Main applications of magnetic graphene-based nanomaterials in environmental samples analysis.
|
Adsorbent |
Analyte(s) |
Applications |
Sample Preparation |
Analytical Technique |
LODs |
EF |
Reference |
|---|---|---|---|---|---|---|---|
|
mGO |
PAHs |
Tap, river, sea water |
MSPE |
HPLC-UV |
0.09–0.19 μg/L |
25 |
[76] |
|
mGO |
PCB 28 |
School sewage, river water |
MSPE |
GC-MS |
0.027–0.059 μg/L |
200 |
[77] |
|
mGO |
Sulfonamides |
Tap, river water |
MSPE |
HPLC-DAD |
0.05–0.10 mg/L |
N/R |
[78] |
|
mGO-porphyrin |
Sulfonamides |
Tap, river water |
MSPE |
HPLC-DAD |
0.2 mg/L |
N/R |
[79] |
|
GO-MC-MTPS |
Hg(II) |
Tap, sea water |
MSPE |
CV-AAS 1 |
0.06 μg/L |
80 |
[80] |
|
mGO-DETA |
Cd(II), Pb(II) |
Sea, river, well water |
MSPE |
FAAS |
0.40, 0.38 μg/L |
150, 167 |
[81] |
|
mGO |
Cr(III), Cr(VI), Au(III) |
Drinking, river, spring, sea, waste water |
d-μSPE |
FAAS |
0.1, 0.1, 0.004 μg/L |
200, 200, 500 |
|
|
mGO |
Au(III) |
Tap, lake, sea water |
dSPE |
MP-AES |
5 ng/L |
60 |
[84] |
|
TETA-mGO |
Phenolic estrogens |
Tap, river, well water |
MSPE |
UFLC-MS/MS |
0.15–1.5 ng/L |
10,000 |
[85] |
|
mGO-DVB-VA |
Pb(II), Cd(II), Cu(II), Ni(II), Co(II) |
Waste water |
MSPE |
FAAS |
0.37–2.39 μg/L |
40 |
[86] |
|
mf-GO |
Cr(III), Cr(VI) |
River, tannery and electroplating waste water |
d-MSPE |
FAAS |
5.2, 1.6 μg/L |
10 |
[87] |
|
mGO |
Imatinib, Doxorubicin |
Well, waste water |
MSPE |
HPLC-UV |
1.9, 1.8 μg/L |
N/R |
[88] |
|
mGO |
2,4,6-trinitrotoluene |
Reservoir, drinking, waste water |
MSPE |
HPLC-UV |
0.3 μg/L |
153 |
[89] |
|
mGO-MBT 2 |
Cd(II), Cu(II), Pb(II) |
Tap, lake, sea water |
MSPE |
FAAS |
0.19, 0.35, 0.24 μg/L |
400 |
[90] |
|
mGO-HQ 3 |
Cd(II), Pb(II) |
Water samples |
MSPE |
FAAS |
0.09, 0.27 μg/L |
130.43 |
[91] |
|
mGO/SiO2@coPPy-Th |
Cu(II), Cr(III), Zn(II), Cd(II), Pb(II) |
Well, river, bottled mineral water |
MSPE |
FAAS |
0.15–0.65 μg/L |
36–44 |
[92] |
|
mGO-MBT |
Au(III), Pd(II), Ag(I) |
Waste water |
MSPE |
FI-ICP-OES |
45–76 ng/L |
160, 160, 140 |
[93] |
|
mGO-imidazolium |
Cr(III), Cr(VI) |
Waste water |
MSPE |
ETAAS |
1.9 ng/L |
357 |
[94] |
|
mGO |
di-2-ethylhexyl phthalate |
Water samples |
MSPE |
HPLC-DAD |
0.35 μg/L |
100 |
[95] |
1 Cold Vapor Atomic Absorption Spectrometry, 2 Magnetic Graphene Oxide modified with 2-mercaptobenzothiazole, 3 Magnetic Graphene Oxide modified with 8-hyrdoxyquinolone.
This entry is adapted from the peer-reviewed paper 10.3390/app11073028