Chronic lung allograft rejection remains one of the major causes of morbi-mortality after lung transplantation. The term Chronic Lung Allograft Dysfunction (CLAD) has been proposed to describe the different processes that lead to a significant and persistent deterioration in lung function without identifiable causes. The two main phenotypes of CLAD are Bronchiolitis Obliterans Syndrome (BOS) and Restrictive Allograft Syndrome (RAS), each of them characterized by particular functional and imaging features. These entities can be associated (mixed phenotype) or switch from one to the other. If CLAD remains a clinical diagnosis based on spirometry, computed tomography (CT) scan plays an important role in the diagnosis and follow-up of CLAD patients:
• To exclude identifiable causes of functional decline when CLAD is first suspected;
• To detect early abnormalities that can precede the diagnosis of CLAD (particularly RAS);
• To differentiate between the obstructive and the restrictive phenotypes;
• To detect exacerbations and evolution from one phenotype to the other.
Recognition of early signs of rejection is crucial, for better understanding of physiopathologic pathways and optimal management of patients.
- lung transplantation
- chronic lung allograft dysfunction
- computed tomography (CT) scan
1. Introduction
2. Definition of Chronic Lung Allograft Dysfunction (CLAD)
3. Definition of Chronic Lung Allograft Dysfunction (CLAD)
According to the last consensus report from the Pulmonary Council of the ISHLT, the critical level of ≥20% fall from baseline FEV1 with or without change in forced vital capacity (FVC), qualifies for “possible CLAD” and should prompt investigations to identify potentially treatable causes such as infection, acute cellular/antibody-mediated rejection, or airway stenosis [5]. If lung function parameters remain impaired on a second reading at least 3 weeks after the first ≥20% fall from baseline and after adequate treatment has been given, a diagnosis of “probable” CLAD can be made [5]. CLAD severity (Table 2) and preferential phenotype (Table 3) should be defined at this stage to stratify potential investigations and therapies [6].
Table 2 CLAD staging (from [5])
|
Stage |
Spirometry |
|
CLAD 0 CLAD 1 CLAD 2 CLAD 3 CLAD 4 |
FEV1 > 80% FEV1 baseline FEV1 > 65-80% FEV1 baseline FEV1 > 50-65% FEV1 baseline FEV1 > 35-50% FEV1 baseline FEV1 ≤ 35% FEV1 baseline |
Table 3 CLAD phenotypes (from [5])
|
|
Obstruction (FEV1/FVC <0.7) |
Restriction (TLC decline ≥ 10% from baseline) |
Opacities on chest X ray /CT |
|
BOS RAS Mixed Undefined |
Yes No Yes Yes Yes |
No Yes Yes No Yes |
No Yes Yes Yes No |
CLAD encompasses two main clinical entities, BOS and RAS, that can be differentiated on the basis of spirometry and imaging. RAS is characterized by persistent opacities on chest imaging (chest X-ray and/or CT) and a decline in total lung capacity (TLC) ≥ 10% compared to the best post-operative TLC [2], or a decline in FVC ≥ 20% compared to the best FVC when TLC is not available [6-7-8]. Lung volumetry obtained by CT can be used when plethysmography is not available [8, 9]. BOS is characterized by a purely obstructive pattern (FEV1/FVC ratio < 0.7 and normal TLC), and no pulmonary opacity on chest imaging. Evidence of obstructive and restrictive profile (FEV1/FVC < 0.7 and low TLC) associated with pulmonary opacities defines the mixed phenotype. Some patients remain undefined after functional and radiological evaluation [5-10]. The criteria for CLAD phenotypes are summarized in Table 3.
CLAD will be “confirmed” if the physiologic abnormalities persist for 3 months after the first value has been obtained. Further investigation including CT to exclude any treatable causes or complications of therapy may be warranted at any stage.
Azithromycin-Reversible Allograft Dysfunction (ARAD) is a form of functional decline that responds to neomacrolid azithromycin therapy [3, 11-12-13]. As a reversible condition, it should not be considered part of CLAD. Also known as neutrophilic reversible allograft dysfunction, ARAD is characterized by the presence of neutrophils in bronchoalveolar lavage and a functional obstructive profile mimicking BOS [13]. However, the hallmark of ARAD is the resolution of the abnormalities with azithromycin [14, 15]. Two randomized clinical trials have demonstrated that a prophylactic treatment with azithromycin was associated with a significant reduction of the prevalence of BOS [16, 17].
4. Bronchiolitis Obliterans Syndrome
5. Restrictive Allograft Syndrome
RAS is the second most common form of allograft rejection with a prevalence of approximately 25-35% in the CLAD population. Outcome in patients with RAS is worse than in patients with BOS, with a median survival of 6-18 months after the diagnosis of RAS compared to 3-5 years after the diagnosis of BOS [25, 26].
RAS is defined by a restrictive pulmonary defect without evidence of obstruction, and the presence of persistent opacities on chest imaging. Functional decline may be progressive and steady, or marked by periodic stepwise exacerbations. Patients can also present with acute respiratory failure. The gradually progressive decline is associated with the best prognosis [5, 27, 28].
RAS has complex histopathologic features involving interstitial and small airway compartments. Fibrotic changes most often consist in intra-alveolar fibroelastosis (IAFE) adjacent to the bronchioles, the pleura, and the interlobular septa [29, 30]. This pattern of IAFE is virtually identical to that observed in idiopathic pleuro-parenchymal fibroelastosis (PPFE), but patients with RAS often demonstrate associated lesions of obliterative bronchiolitis and the two diseases also display vascular differences [33]. In a study of RAS explant lungs using CT and microCT, investigators demonstrated large areas of disappearing airways, with obliterative bronchiolitis in 30-40% of the remaining airways. MicroCT showed a decrease in the number of terminal bronchioles [31]. Other fibrotic patterns encountered in RAS include non-specific interstitial pneumonia (NSIP) and fibrosis-induced paraseptal emphysema, the latter being associated with relatively good prognosis [30] (Figure 4).
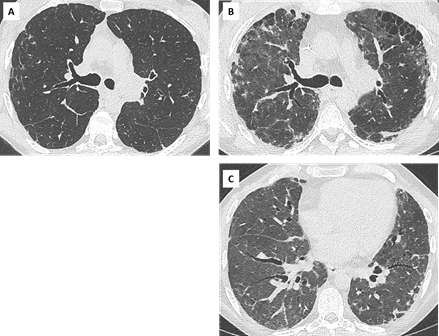
Figure 4: Diffuse opacities associated with RAS in a 38 yo woman showing slowly progressive clinical symptoms and functional decline.
- : CT scan at CLAD onset, showing subtle reticular changes in the right upper lobe.
- : 2 years later, the patient has developed upper and subpleural predominant consolidation and reticulations, associated with paraseptal emphysema. Note the diffuse ground glass opacities consistent with inflammation and a possible NSIP pattern (C).
Fibrotic lesions can merge with areas of diffuse alveolar damage (DAD) and acute fibrinoid organizing pneumonia (AFOP). AFOP is characterized by intra-alveolar filling of ball-like fibrin exudates, without hyaline membranes that would suggest a diagnosis of DAD and without overt fibroblastic organization that would suggest organizing pneumonia. It is considered as a severe form of acute lung injury, and associated with a poor prognosis [32]. Whether and how these acute phenomena predispose to the development of fibrosis is still unclear, but some authors have suggested a temporal sequence between DAD [29] or AFOP [34] and IAFE.
Parenchymal abnormalities can precede the diagnosis of CLAD. Peripheral consolidation and peripheral ground glass have been reported in approximately 40% and 20% of cases respectively, before functional confirmation of RAS [35]. Initial CT findings may be subtle and nonspecific (septal lines, ground glass nodules, focal consolidation…), especially in immunosuppressed patients prone to infection, but their persistence is suspicious for RAS [27, 36] (Figure 5).
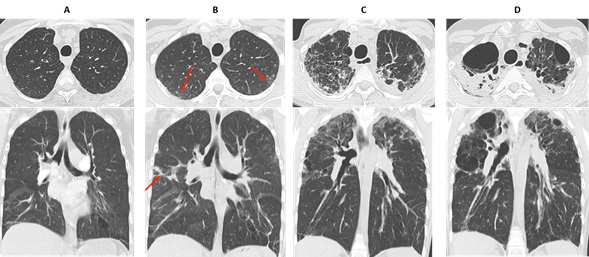
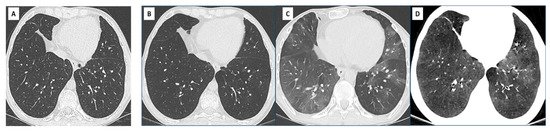
Figure 5: early detection and evolution of RAS in a 24 yo man, who underwent bilateral LT in 2007 for cystic fibrosis. Axial and coronal images of CT scans at optimal spirometry (A), 4 months before the diagnosis of CLAD (B), 8 (C) and 22 months (D) after the diagnosis of CLAD.
(A) May 2008: normal CT scan.
(B) August 2008: first visualization of subtle subpleural ground glass areas and consolidation (red arrows), considered nonspecific and treated with antibiotics. The diagnosis of CLAD was confirmed in December 2008 with a RAS profile.
(C) August 2009: rapid evolution towards destructive, upper predominant cystic lesions and interstitial fibrosis.
(D) October 2010: late RAS. CT changes suggestive of pleuroparenchymal fibroelastosis with dense subpleural fibrosis and pleural thickening, dramatic loss of volume of the upper lobes.
Imaging features of late RAS often correlate with those of idiopathic PPFE [37]. They include pleural thickening, dense peripheral consolidations, traction bronchiectasis, architectural distortion and volume loss, typically upper predominant and variable in extent. Some patients may present with diffuse or basal predominant interstitial abnormalities [9, 38], and these patterns could be associated with a worse prognosis [38].
In a study comparing CT scans obtained at different time points (pre-CLAD, CLAD onset, post-CLAD and late-CLAD), CT scores demonstrated a significant increase in bronchiectasis, central and peripheral consolidation, architectural distortion, volume loss and hilus retraction over time [35] (Figures 5 and 6). The absolute FVC decrease post-CLAD diagnosis correlated with CT alterations. In another study, severe and multilobar consolidation on CT were associated with a reduced TLC and a poor prognosis [9].
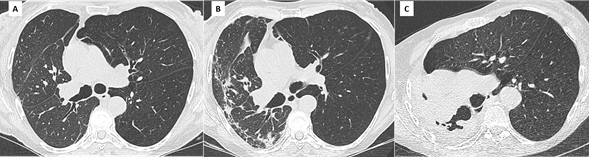
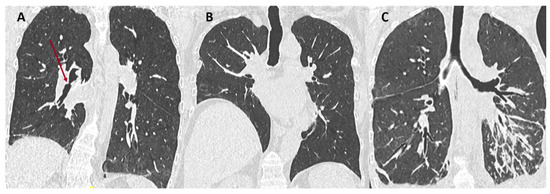
Figure 6. Unilateral RAS in a 61 yo woman who underwent right LT for α1-antitrypsin deficiency.
(A): Baseline CT scan. Note the diffuse hypo attenuation and hypoperfusion of the left native lung, compared to the right allograft. An adapted « normal » FEV1 must be defined in this patient taking into account the severe obstruction from the left lung.
(B) Diagnosis of CLAD, with concomitant apparition of subpleural interstitial opacities in the right lung.
(C) 3 years later, the allograft has been replaced by dense fibrosis and is totally collapsed. There is marked over expansion of the left lung.
Extensive consolidation, ground glass opacities and septal lines are suggestive of underlying DAD or AFOP lesions (Figure 7). Dubbeldam et al described two distinct groups of patients according to the evolution of CT findings, a rapidly progressing group possibly overlapping with AFOP lesions, and a more slowly progressing group overlapping with PPFE and upper lobe fibrosis [27].
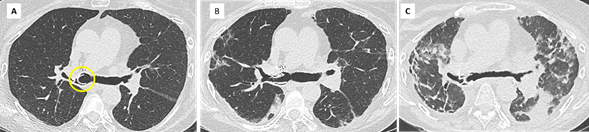
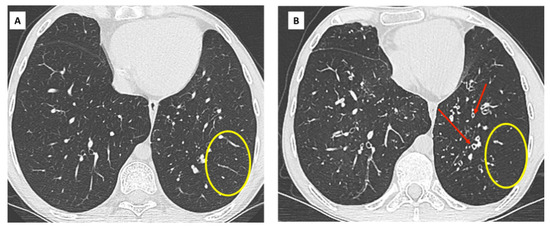
Figure 7: Acute exacerbation of RAS in a 67 yo woman.
- Baseline CT scan. Stable obstructive pattern on PFT related to right main bronchus stenosis, treated by endo-bronchial stenting (yellow circle).
- Diagnosis of CLAD with restrictive profile. CT shows persistent subpleural opacities (ground glass mostly), consistent with RAS.
- One month later, the patient presented with acute clinical and functional deterioration. CT shows extensive and rapidly progressive ground glass opacities suggesting diffuse alveolar damage and / or AFOP. The patient died a few days later.
18-fluorodeoxyglucose positron emission tomography with computed tomography (F-FDG PET/CT) may help in differentiating BOS from RAS, as reported in a recent monocentric retrospective study [39]. Maximum standardized uptake value (SUV) was higher in RAS compared with BOS and stable patients (P<0.0001), and high SUV in RAS patients was associated with worse survival. In the same study, the authors examined the explanted lungs using microCT and showed extensive fibrosis in regions of high SUV, with an increased number of glucose transporter-1 positive cells.
6. Overlap BOS / RAS: mixed-phenotype CLAD
The initial phenotype of CLAD should be re-assessed regularly, as it can transition from one phenotype to another [2]. The combination of obstruction, restriction, and persistent lung opacities is usually defined as the mixed phenotype of CLAD [4]. Some patients may present with a mixed phenotype ab initio, whereas others may demonstrate a shift from the original phenotype (usually BOS) to a mixed phenotype over time [36] (Figure 8). In a recent study by Verleden et al., including 268 lung transplant patients with CLAD (18% RAS ab initio, 80% BOS and 2% undefined), 25 patients (9%) developed a mixed CLAD phenotype (24 BOS to mixed-phenotype and 1 RAS to mixed-phenotype) [40]. This mixed phenotype was associated with apical predominance of CT opacities, PPFE on pathology, a lower FEV1 and FEV1/FVC at diagnosis compared to RAS ab initio, and similar survival compared to RAS ab initio patients. The BOS to mixed phenotype evolution was more frequently observed in patients transplanted for emphysema.
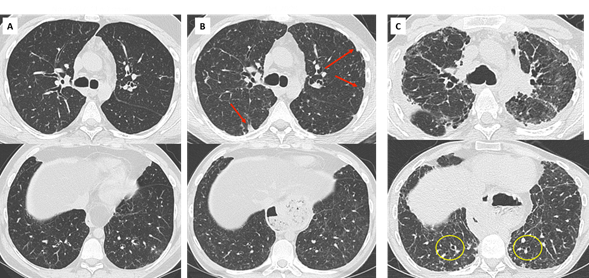
Figure 8: mixed CLAD in a 30 yo patient.
- Diagnosis of CLAD in 2007 with initial obstructive phenotype. CT shows mild bronchial wall thickening.
- Progressive decline in TLC suggesting an evolution towards a mixed CLAD (oct 2009). Note the apparition of subpleural opacities in the upper lobes (red arrows) and mild and diffuse ground glass opacities.
- Rapid functional and radiological deterioration, with upper predominant fibrosis and subpleural consolidation suggesting PPFE, mild cylindrical bronchiectasis in the lung bases (yellow circles).
7. When to perform a CT scan in the stetting of CLAD
An initial CT scan is recommended for all patients 6 months after lung transplantation, when spirometry is expected to be optimal [5]. It should be performed without iodine contrast, in high resolution (maximum width of 3-mm sections), at full inspiration and expiration. Repeat CT studies should be performed when a first drop in FEV1 ≥ 10% is seen, to look for an identifiable cause (infection, drug toxicity, acute rejection, malignancy…), and at CLAD onset to define the phenotype and as a baseline imaging.
Dettmer et al demonstrated the utility of CT as a predictor of restrictive CLAD and predictor of survival [41]. CT at CLAD onset showed significantly more opacities in patients who later developed RAS, and a radiological score developed for inflammation showed significant correlation with survival. Lung volumetry obtained by CT can also help to differentiate BOS from RAS, as the volume of lungs in RAS is significantly lower compared to baseline, while the volume of lungs in BOS remains stable or even increases [8].
During follow-up and according to clinical and functional changes, CT may be used to exclude any treatable causes or complications of therapy, or to detect possible evolution to a mixed phenotype.
8. Use of Artificial Intelligence (AI) in pre-CLAD and CLAD
This entry is adapted from the peer-reviewed paper 10.3390/diagnostics11050817