Tissue cytometry may provide the methodological basis for next-generation digital pathology, which is the state-of-the-art technology to use and constitutes an enabling factor for precision medicine in clinics as well as in research. Within this review, we are going one step further by addressing the concepts of next-generation digital pathology using imaging-based tissue cytometry, in combination with multiplexing and RNA ISH technologies, as an emerging and central method within precision diagnostics, and discussing various applications.
- next-generation digital histopathology
- tissue cytometry
- multiplexing
- RNA ISH
- cancer
- tumor immune microenvironment
- tumor microenvironment
- image analysis
- image cytometry
1. RNA In Situ Hybridization (ISH)
In clinical settings, a routinely used method to measure RNA is real-time PCR [1]. However, this grind-and-bind technique is unable to visualize the individual cell signals in their original context, and is prone to becoming contaminated by unintended cell and tissue types and masking the different cellular subpopulations and phenotypes in the heterogenous TME [2][3]. Next-generation sequencing and single-cell sequencing technologies can detect RNA expression at the single cell level, but dissociation from their native setting deprives the data related to their spatial relationship [4]. With the latest developments in RNA ISH, multiple approaches came into play such as non-isotopic fluorescently labeled ISH (fluorescence in situ hybridization—FISH) and biotin or hapten labeled nucleic acid probes (chromogenic in situ hybridization—CISH) to gather spatial data [3][5][6][7][8]. These methods opened a new data dimension, supporting localization and quantitation of target RNA in single cells to detect precise RNA expression in specific cell types [3][9]. However, these techniques only allow a restricted number of labels to be integrated into the probes, leading to reduced sensitivity of expression for most of the genes [3]. Due to a high possibility of cross-hybridization and non-specific binding in complicated tumors, the signal-to-noise ratio is constrained, and extreme technical complication limits the performance of these methods [3][9]. In Figure 1, a representative example of the automated quantitative analysis of FISH and RNA ISH is shown.
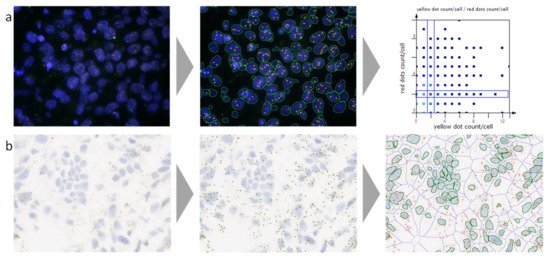
Figure 1. A representative example of automated analysis of fluorescence in situ hybridization (FISH) and RNA in situ hybridization (ISH) stained cells using a next-generation digital pathology platform. (a) FISH staining (blue, nuclei stained for 4′,6-diamidino-2-phenylindole (DAPI); red and yellow dots, FISH probes); on the left the original image is shown, in the middle the corresponding analyzed image including cell and dot detection mask, and on the right the analyzed data visualized in a scattergram. (b) RNAscope staining (blue, nuclei stained for hematoxylin; brown, RNAscope staining); on the left the original image is shown, in the middle the original image overlaid with the detected dot mask, and on the right the original image overlaid with the nuclei mask, the cellular mask, and the identified dot mask. Both images were provided by and analyzed using TissueGnostics’ image cytometry solution StrataQuest.
RNAscope by Advanced Cell Diagnostics Inc., Hayward, CA (ACD) has presented the most pragmatic method that overcomes these limitations of traditional RNA ISH by a unique probe design and an advanced signal amplification system [3][10]. This technology excels due to its specificity, sensitivity, low turnaround time, and robustness in a wide range of applications across various disciplines including infectious diseases, neuroscience, cell or gene therapy, and single-cell transcriptomic profiling in cancer [3][11][12][13][14][15]. In the TME, RNAscope has prominent advantages such as spatially mapping a cell atlas [16][17], visualizing and characterizing gene signatures and generating the immune landscape, and even identification of novel cell subtypes [18][19], classifying and identifying highly heterogeneous and immunotherapeutic cell types [20][21], and identification and characterization of a gene signature of stem cells [22][23][24] and circulating tumor cells [25][26] as well as analyzing or predicting their response to drug treatments [27][28]. Compared with a one-probe RNA ISH hybridization system, the possibility of nonspecific amplification in RNAscope is considerably low since it implies a double-probe independent hybridization system and improves the sensitivity and the signal-to-noise ratio, allowing better quantification of RNA expression [3][29].
The RNAscope method allows robust detection of mRNA, long non-coding as well as microRNAs [8][30][31][32][33], and multiple gene transcripts generated by alternative splicing [34][35] simultaneously in fresh-fixed, fresh-frozen, and formalin-fixed paraffin-embedded (FFPE) clinical specimens, revealing the full potential of RNA [36]. For example, the expression of a majority of androgen receptor (AR) splice variants other than the full-length AR variant remains unclear in prostate cancer progression. RNAscope has been proposed to be a capable technique for detecting expression and localization of splice variants by designing probes specifically to target distinct splice variants. For example, AR and AR-V7 expression have been detected in FFPE prostate tumors by RNAscope where AR expression was found to be 3-fold higher in primary tumor cells compared with benign glands, while AR-V7 expression was higher in metastatic castration-resistant prostate cancer than in primary prostatic tissues [35].
Emerging new therapeutic strategies broadly target both cellular and non-cellular components of the TME more than ever, by various therapies such as immune checkpoint blockade therapy, dendritic cell vaccination, and antiangiogenic therapy [37]. Detection of RNA targets in the TME that are involved in tumor immunotherapy with the RNAscope assay can facilitate these therapies predominantly. RNAscope applications enable the determination of localization of specific immune cell types (i.e., cytotoxic lymphocytes and regulatory T cells) in the TME [38], spatial relationships between different cell types in the TME [39], and immune activation state and function of tumor-infiltrating immune cells in the TME [40][41]. For example, Monte et al., using RNAscope assay, reported that infiltrating basophils in the TME regulate tumor-promoting Th2 inflammation and reduce survival in pancreatic cancer patients [40]. Besides, this technique is an attractive strategy to determine cell type-specific expression of immune checkpoint markers [42] and differentiate activated CAR+ T cells from endogenous T cells [43]. RNAscope’s aptitude to precisely identify the cellular sources of secreted proteins (e.g., cytokines and chemokines) is a distinct benefit since although the mRNA will always localize in the cells of origin, secreted proteins tend to dilute and diffuse in the intercellular space [18][38][44]. Besides, RNAscope provides valuable information on the differentiation of paracrine and autocrine signaling, which aids in the classification of subtypes of several cancers [45]. A dual gene analysis approach with RNAscope has been utilized for simultaneous detection of CD44+ cells and PD-L1 in head and neck squamous cell carcinoma, which found that CD44+ in the TME induces expression of PD-L1, thus subsequently suppressing T cell-mediated immunity in the TME [46]. The localization and quantification of multi-RNA from several genes simultaneously by RNAscope provide greater time saving and significant results from a single feasible technique. However, rapid mRNA translation and RNA degradation in cells can affect RNAscope applications, and thus BaseScope, a subfield of RNAscope, has been recommended for short RNA targets of 50–300 nucleotides [47]. Instead of using 20 probe pairs, BaseScope utilizes short 1–6 probe pairs to target small regions of RNA more effectively. Thus BaseScope is a successful method to determine the expression and quantification of small nucleolar RNAs (snoRNAs), microRNAs, and the RNAs which have a high potential of degradation and transient expression in the TME [47].
The newest approach of RNAscope, in combination with IHC and called dual RNAscope ISH/IHC, has proven to offer an ideal platform to generate more reliable data that can be used to study gene expression signatures at the RNA and protein level with spatial and single-cell resolution in complex TME [43]. This allows correlation of both RNA and protein expression in a single slide, simultaneously validating antibody specificity [29][48][49][50]. For example, combined detection of HPV RNA by RNAscope and Cdc2 protein expression by IHC has been useful to predict the prognosis of oropharyngeal squamous cell carcinoma patients. Even more, the results conclude that the sensitivity of RNAscope was higher than that of PCR reverse dot hybridization [50]. The automated RNAscope is a significant advancement over manual RNAscope and improves the clinical advantage by allowing more samples to be analyzed in a standardized way simultaneously with less time, less inter-user variability, and less manpower in an observer-independent manner [37]. The method has proven consistent and provides reproducible results in quantifying transcript levels. Overall, the spatial resolution presented by the RNAscope method brings a novel dimension to precise localization of target RNA in single cells and allows localization and quantitation of RNA expression in specific cell types in the TME [37].
2. Assessment of the Tumor Immune Microenvironment
One of the most promising fields in biomarker and therapy target detection in oncology is dedicated to the exploration of the patient-specific immune contexture in situ with conventional and multiplexing IF and IHC staining techniques in combination with automated quantification [51].
One prominent approach for immune cell assessment within a particular tumor tissue, colorectal cancer (CRC), was developed by the group of Galon et al., where they successfully established a patient stratification strategy based on the detection/identification of T cell populations within the tumor core and the invasive margin named Immunoscore (ratio of the markers CD3 and CD45RO, CD3 and CD8, or CD8 and CD45RO). It is currently undergoing evaluation/implementation as a routine parameter for prognostic and predictive diagnosis in clinics for colon cancer [52][53]. To demonstrate its power the group of Pages et al. conducted a large-scale study, where his group assessed the Immunoscore by using a digital pathology method of a large patient cohort (n = 2681 CRC patients), aligned it with clinical pathological data, and thereby was able to show the power of the Immunoscore in the prognosis of survival prediction and treatment response in CRC patients [54]. In order to provide a representative (yet not complete) overview of recent applications, Table 1 shows further examples of studies using conventional and/or multiplexing IF and/or IHC staining techniques in which next-generation digital pathology was the central method for the quantification of various immune cell markers/populations in different cancer types and aligned with clinicopathological parameters.
Table 1. Studies using next-generation digital pathology for the assessment of the tumor immune microenvironment.
| Cancer Type | Markers | Scanner/Microscope | Quantification System | Reference |
|---|---|---|---|---|
| Breast cancer | CD4, CD8, Foxp3 | Olympus BX51 (Olympus, Tokyo, Japan) | UTHSCSA Image Tool (University of Texas Health Science Center at San Antonio, San Antonio, TX, USA) | [55] |
| Breast cancer | CD4, CD8, CD3, CD20, FOXP3, CD68 | Leica SCN400 F (Leica Biosystems Inc., Richmond, IL, USA) | ImageJ software (NIH, Bethesda, MD, USA) | [56] |
| Breast cancer | PD-L1 | Aperio AT2 Scanner (Leica Biosystems Inc., Richmond, IL, USA) | QuPath (University of Edinburgh, Edinburgh, UK) | [57] |
| Breast cancer | CD8 | ScanScope XT (Aperio Technologies, Vista, CA, USA) | HALO (Indica Labs, Albuquerque, NM, USA) | [58] |
| Breast cancer | CD3, CD20, Foxp3 | NanoZoomer (Hamamatsu Photonics, Hamamatsu City, Japan); Panoramic 250 Flash (3Dhistech, Budapest, Hungary) | ImageJ software (NIH, Bethesda, MD, USA) | [59] |
| Breast cancer | CD3, CD8, CD20 | NanoZoomer (Hamamatsu Photonics, Hamamatsu City, Japan) | ImageJ software (NIH, Bethesda, MD, USA) | [60] |
| Breast cancer | CD4, CD68, CD8, FOXP3, PD-L1 | Vectra 3 (PerkinElmer, Waltham, MA, USA) | inForm (PerkinElmer, Waltham, MA, USA) | [61] |
| Breast cancer | CD4, CD8, FOXP3, CD20, CD33, PD-1 | Vectra 3 (Akoya Biosciences, Marlborough, MA, USA) | inForm (Akoya, Marlborough, MA, USA) | [62] |
| CRC | CD3, CD8 | n.s. | Developer XD (Definiens, Munich, Germany) | [54] |
| CRC | CD3, CD8 | VENTANA iScan HT (Roche, Basel, Switzerland) | automated image analysis algorithm | [63] |
| CRC | CD8 | Aperio XT Scanner (Leica Biosystems Inc., Richmond, IL, USA) | HALO (Indica Labs, Albuquerque, NM, USA) | [58] |
| CRC | CD3, CD8 | Zeiss Axio Scan.Z1 (Zeiss, Jena, Germany) | HALO (Indica Labs, Albuquerque, NM, USA) | [64] |
| CRC | CD3, CD4, CD8, CD45RO, FOXP3, Granzyme B, CD15, CD20, S100, CD68, IL17, CD57, | microscope (Leica, Wetzlar, Germany) | TMAJ software (Johns Hopkins University, Baltimore, MD, USA) | [65] |
| CRC | FoxP3, CD8, CD66b, CD20, CD68 | Vectra 3 (PerkinElmer, Waltham, MA, USA) | inForm (PerkinElmer, Waltham, MA, USA) | [66] |
| CRC | SOX2, CD3, CD8 FoxP3, ALDH1, CD44v6, CD133, Lgr5, PD-L1 | Aperio XT Scanner (Leica Biosystems Inc., Richmond, IL, USA) | Aperio Imagescope (Leica Biosystems Inc., Richmond, IL, USA) | [67] |
| CRC | CD8, CD11c, PD-L1 | Pannoramic MIDI II (3Dhistech, Budapest, Hungary) | StrataQuest (TissueGnostics, Vienna, Austria) | [68] |
| CRC | CD8, CD4, CD20, Foxp3, CD45RO, | Vectra Polaris (PerkinElmer, Waltham, MA, USA) | inForm (PerkinElmer, Waltham, MA, USA) | [69] |
| CRC, CRCLM | CD20, CD3, Ki67, CD27 | TissueFAXS PLUS (TissueGnostics, Vienna, Austria) | HistoQuest, TissueQuest (TissueGnostics, Vienna, Austria) | [70] |
| CRC, CRCLM | CD8, Foxp3, CD68, CD31 | ScanScope (Aperio Technologies, Vista, CA, USA) | GENIE (Aperio Technologies, Vista, CA, USA) | [52] |
| CRCLM | CD45, CD20 | TissueFAXS PLUS (TissueGnostics, Vienna, Austria) | HistoQuest, TissueQuest (TissueGnostics, Vienna, Austria) | [71] |
| CRCLM | CD3, CD4, CD8, CD20, CD68 | NanoZoomer (Hamamatsu Photonics, Hamamatsu City, Japan) | Visilog 9.0 software (Noesis, Saclay, France) | [72] |
| CRCLM | CD3, CD8, CD45RO, Foxp3, CD20 | NanoZoomer (Hamamatsu Photonics, Hamamatsu City, Japan) | Developer XD (Definiens, Munich, Germany) | [73] |
| Gastric cancer | PD-L1, CD8 | digital slide scanner (3Dhistech, Budapest, Hungary); TissueFAXS (TissueGnostics, Vienna, Austria) | QuantCenter (3Dhistech, Budapest, Hungary); TissueQuest (TissueGnostics, Vienna, Austria) | [74] |
| Gastric cancer | CD68, CD163, CD3, MPO, Foxp3. | ScanScope CS (Aperio Technologies, Vista, CA, USA) | ImageScope (Aperio Technologies, Vista, CA, USA) | [75] |
| Gastric cancer | CD3, CD4, CD8, PD-1 | ScanScope CS2 (Aperio Technologies, Vista, CA, USA) | ImageScope (Aperio Technologies, Vista, CA, USA) | [75] |
| Gastric cancer | CD8, FoxP3 | ScanScope XT (Aperio Technologies, Vista, CA, USA) | image analysis system—ScanScope XT (Aperio Technologies, Vista, CA, USA) | [76] |
| Gastric cancer | CD8, Foxp3 | n.s. | Aperio image analysis system (Leica Biosystems Inc., Richmond, IL, USA) | [77] |
| Gastric cancer | CD8, Foxp3, CD3, CD56 | Vectra Multispectral Imaging System version 2 (PerkinElmer, Waltham, MA, USA) | inForm (PerkinElmer, Waltham, MA, USA) | [78] |
| Gastric and esophageal cancer | CD3, CD8 | n.s. | HALO (Indica Labs, Albuquerque, NM, USA | [79] |
| Gastric cancer and metastasis | PD-L1 | n.s. | Aperio Imagescope IHC Membrane Image Analysis software (Aperio Technologies, Vista, CA, USA) | [80] |
| HCC | CD3, CD8 | n.s. | ImagePro Plus (Media Cybernetics, Rockville, MD, USA) | [81] |
| HCC | CD3, CD8 | Nikon E600 (Nikon, Tokyo, Japan); | ImageJ software (NIH, Bethesda, MD, USA) | [82] |
| HCC | CD3, CD15, CD20, CD23, CD68, Foxp3, LTß | Ariol SL-50 (Applied Imaging) | Image analysis system (Applied Imaging) | [83] |
| HCC | CD3, CD8, PD-1, TIM3 | Vectra 3 (PerkinElmer, Waltham, MA, USA) | inForm (PerkinElmer, Waltham, MA, USA) | [84] |
| HCC | CD3, CD4, CD8, CD20, CD27, CD40, CD38, CD56, CD68, CD138, S100, Granzyme B, Ki67 | Mantra (PerkinElmer, Waltham, MA, USA) | ImagePro Plus (Media Cybernetics, Rockville, MD, USA) | [85] |
| HCC | CD3, CD8, CD45RO, | n.s. | ImagePro Plus (Media Cybernetics, Rockville, MD, USA) | [86] |
| HCC | FoxP3, CD4, CD8, CD34 | Olympus BX51 (Olympus, Tokyo, Japan) | ImagePro Plus (Media Cybernetics, Rockville, MD, USA) | [87] |
| HNSCC | FOXP3, CD8 | n.s. | Visiopharm image analysis software (Visiopharm, Copenhagen, Denmark) | [88] |
| HNSCC | CD3, CD8 | Aperio AT2 scanner (Leica Biosystems Inc., Richmond, IL, USA) | StrataQuest (TissueGnostics, Vienna, Austria) | [89] |
| Melanoma | PD-L1 | Philips Ultra Fast Scanner 300 (Philips, Amsterdam, Netherlands) | HALO (Indica Labs, Albuquerque, NM, USA | [90] |
| Melanoma | CD20 | TissueFAXS (TissueGnostics, Vienna, Austria) | HistoQuest (TissueGnostics, Vienna, Austria) | [91] |
| Melanoma | CD3, CD8, CD68, SOX10, Ki67 | Mantra (PerkinElmer, Waltham, MA, USA) | inForm (PerkinElmer, Waltham, MA, USA) | [92] |
| Melanoma | CD19, CD20, CD27, CD38, CD138, CD5, CD8, Foxp3, CD4, CD69, CD103, CD45RO, CXCL13, CD21, CD23, Bcl6 | Vectra Multispectral Imaging System version 2 (PerkinElmer, Waltham, MA, USA) | inForm (PerkinElmer, Waltham, MA, USA) | [93] |
| NSCLC | CD8, PD-1 | Philips Ultra Fast Scanner 300 (Philips, Amsterdam, Netherlands) | HALO (Indica Labs, Albuquerque, NM, USA | [94] |
| NSCLC | CD8 | NanoZoomer (Hamamatsu Photonics, Hamamatsu City, Japan) | Calopix software (TRIBVN Healthcare, Paris, France) | [95] |
| NSCLC | PD-L1, TIM, CD3, CD4, CD8, CD57, granzyme B, CD45RO, PD-1, FOXP3 | Aperio AT scanner (Leica Biosystems Inc., Richmond, IL, USA) | Aperio GENIE (Leica Biosystems Inc., Richmond, IL, USA) | [96] |
| NSCLC | CD8, CD4, FOXP3, CD163, CCL17, IL-13 | Vectra Automated Quantitative Pathology Imaging System (PerkinElmer, Waltham, MA, USA) | [97] | |
| NSCLC | CD3, CD4, CD8, CD57, granzyme B, CD45RO, PD-1, FOXP3, CD68 | Aperio AT scanner (Leica Biosystems Inc., Richmond, IL, USA) | Aperio GENIE (Leica Biosystems Inc., Richmond, IL, USA) | [98] |
| NSCLC | CD4, CD20, CD8, Foxp3 | NanoZoomer (Hamamatsu Photonics, Hamamatsu City, Japan) | Tissue Studio (Definiens, Munich, Germany) | [99] |
| NSCLC | CD68, CD163, PD-L1, | Mantra (PerkinElmer, Waltham, MA, USA) | inForm (PerkinElmer, Waltham, MA, USA) | [100] |
| NSCLC | CD8, CD4, Foxp3, CD68 | Vectra Multispectral Imaging System (PerkinElmer, Waltham, MA, USA) | inForm (PerkinElmer, Waltham, MA, USA) | [101] |
| NSCLC | CD3, CD8, Foxp3 | ScanScope CS (Aperio Technologies, Vista, CA, USA) | GENIE (Aperio Technologies, Vista, CA, USA) | [102] |
| NSCLC | CD8, PD-L1 | Aperio AT scanner (Leica Biosystems Inc., Richmond, IL, USA) | Developer XD (Definiens, Munich, Germany) | [103] |
| pulmonary squamous cell carcinoma | CD8, PD-1 | ScanScope (Aperio Technologies, Vista CA, USA) | ImageScope (Aperio Technologies, Vista, CA, USA) | [104] |
| pulmonary squamous cell carcinoma | CD20, CD21, CD23, PNAD, DC-LAMP | Vectra 3 (PerkinElmer, Waltham, MA, USA) | inForm (PerkinElmer, Waltham, MA, USA) | [105] |
| Oral squamous cell cancer | CD3, CD8, FoxP3, CD163, PD-L1 | Vectra (PerkinElmer, Waltham, MA, USA) | inForm (PerkinElmer, Waltham, MA, USA) | [106] |
| Ovarian cancer | CD8, MHC I, FAP ISH | Panoramic 250 (3Dhistech, Budapest, Hungary), | Developer XD (Definiens, Munich, Germany) | [107] |
| Ovarian cancer | CD8 | TissueFAXS (TissueGnostics, Vienna, Austria) | HistoQuest (TissueGnostics, Vienna, Austria) | [108] |
| Ovarian cancer | CD8, CD45RO, CD68 | Panoramic Flash (3Dhistech, Budapest, Hungary) | Tissue Studio (Definiens, Munich, Germany) | [109] |
| Ovarian cancer | CD4, CD8, CD20 | Aperio scanner (Leica Biosystems Inc., Richmond, IL, USA) | ImageScope (Aperio Technologies, Vista, CA, USA) | [110] |
| Ovarian cancer | CD8 | Vectra (PerkinElmer, Waltham, MA, USA) | inForm (PerkinElmer, Waltham, MA, USA) | [111] |
| Ovarian cancer | CD8, CD103 | TissueFAXS (TissueGnostics, Vienna Austria) | Fiji, Image J software (NIH, Bethesda, MD, USA) | [112] |
| Ovarian cancer | CD3, CD4, CD8 | n.s. | CD3 Quantifier (VM Scope, Berlin, Germany) | [113] |
| Pancreatic cancer | CD3, CD8, CD4, Foxp3, CK8 | Vectra Multispectral Imaging System version 2 (PerkinElmer, Waltham, MA, USA) | Nuance Image Analysis software; inForm (PerkinElmer, Waltham, MA, USA) | [114] |
| Pancreatic cancer | DC-LAMP, FoxP3, CD68, CD3, CD8, CD4, CD20 | Panoramic Flash (3Dhistech, Budapest, Hungary) | ImageJ software (NIH, Bethesda, MD, USA) | [115] |
| Pancreatic cancer | CD20, CD8, PD1 | dotSlide (Olympus, Tokyo, Japan) | ad hoc software | [116] |
| Pancreatic cancer | CD8 | NanoZoomer (Hamamatsu Photonics, Hamamatsu City, Japan) | HALO (Indica Labs, Albuquerque, NM, USA | [117] |
| Pancreatic cancer | CD8, PD-L1, CD44, CD133 | TissueFAXS (TissueGnostics, Vienna, Austria) | TissueQuest (TissueGnostics, Vienna, Austria) | [118] |
| Pancreatic cancer | CD3 | NanoZoomer (Hamamatsu Photonics, Hamamatsu City, Japan) | Tissue Studio (Definiens, Munich, Germany) | [119] |
| Pancreatic cancer | CD3, CD8, CD20, CD66b | n.s. | ImageJ software (NIH, Bethesda, MD, USA) | [120] |
| Pancreatic cancer | CD3, CD8 | Aperio AT scanner (Leica Biosystems Inc., Richmond, IL, USA) | ImageJ software (NIH, Bethesda, MD, USA) | [121] |
| Prostate cancer | CD3, CD8, CD20, CD56, CD68, Foxp3 | ScanScope XT(Aperio Technologies, Vista, CA, USA) | ImageScope (Aperio Technologies, Vista, CA, USA) | [122] |
| Prostate cancer | CD20 | ScanScope XT (Aperio Technologies, Vista, CA, USA) | ImageScope (Aperio Technologies, Vista, CA, USA) | [123] |
| Prostate cancer | CD3, CD8, Foxp3 | NanoZoomer (Hamamatsu Photonics, Hamamatsu City, Japan) | Aperio Digital Pathology software (Leica Biosystems Inc., Richmond IL, USA) | [124] |
| Clear cell renal cell carcinoma | CD8, PD-1, LAG-3, PD-L1, PD-L2 | NanoZoomer (Hamamatsu Photonics, Hamamatsu City, Japan) | Calopix software (TRIBVN Healthcare, Paris, France) | [125] |
CRC, colorectal cancer; CRCLM, colorectal cancer metastasis in the liver; HCC, hepatocellular carcinoma; HNSCC, head and neck squamous cell carcinoma; NSCLC, non-small cell lung cancer; n.s., not specified.
The examples summarized in Table 1, as well as the example shown in Figure 2 from Desbois et al. [107] indicate the immense power of the applications of this technique utilizing next-generation digital pathology for the assessment of the immune tumor microenvironment. In order to integrate the Immunoscore or other immune cell screening strategies also into clinical research, such fully automated next-generation digital pathology platforms should be implemented into the process of quantification of the rate of infiltration of various immune cell populations/markers. Ongoing clinical studies are aiming at the integration of such platforms in combination with the staining of a set of immune-related biomarkers including main subpopulation markers and immune checkpoint markers [51].
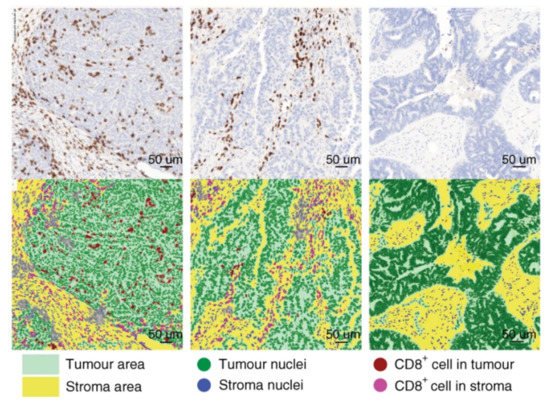
Figure 2. Analysis of the tumor immune microenvironment using next-generation digital pathology. A representative example of the automated detection of CD8+ immune cells within the tumor microenvironment of ovarian cancer by Developer XD (Definiens, Munich, Germany). Figure adapted from Desbois et al., 2020 [107].
To sum up, the need to automatically assess immune cell markers in situ, as well as analyzing spatial relationships, and thereby providing a better understanding of various immune cells populations and their interactions, is crucial for the detection of novel predictive and prognostic biomarkers as well as for clinical therapy strategy.
3. Detection of Blood Vessels
Neoangiogenesis and the resulting vascularization are equally required by the tumor, as in healthy tissues. In both types of tissue, normal and tumor cell survival and proliferation depend on oxygen and nutrition supply as well as on removal of carbon dioxide and metabolic wastes. In contrast to regulated neoangiogenesis in healthy tissues, tumor angiogenesis is characterized by an uncontrolled, ineffective, often incomplete (and therefore leaky) growth of new blood vessels within the tumor tissue in order to supply the tumor mass with oxygen and nutrition [126]. However, the in situ assessment of the density of blood vessels stained by specific markers such as CD31 or CD34 was shown to correlate with the aggressiveness of the tumor in a variety of tumor types such as CRC, breast cancer, gastric cancer, small cell and non-small cell lung cancer [127]. Furthermore, specific therapies such as neutralizing antibodies targeting anti-vascular endothelial growth factor are widely used in several cancer types [128]. However, inhibition of vessel growth has only been shown to provide limited or even no long-term improvement for cancer types including hepatocellular carcinoma and CRC [129][130]. However, the use of different non-standardized methods for detection and quantitation of blood vessel density leads to contradicting data in terms of influence on patient survival [131]. Therefore, the unbiased automated quantification of blood vessels could help to identify patient groups that would benefit from anti-angiogenic therapies.
Summarized in Table 2 are studies where next-generation digital pathology was used to detected blood vessels/blood vessel densities. Thereby we want to emphasize that the next-generation digital pathology approach is highly versatile and can be applied to various research needs and questions, not only to single cell detection or dot (RNA ISH) detection but also for the analysis of more complex structures such as blood vessels.
Table 2. Studies using next-generation digital pathology for the quantification of blood vessels.
| Cancer Type | Markers | Scanner/Microscope | Quantification System | References |
|---|---|---|---|---|
| Breast cancer | CD34 | Olympus BX41 (Olympus, Tokyo, Japan) | Cell D software (Olympus, Tokyo, Japan) | [132] |
| Breast cancer | CD34 | NanoZoomer (Hamamatsu Photonics, Hamamatsu City, Japan) | Slidepath Image Analysis system (Leica Biosystems Inc., Richmond, IL, USA) | [133] |
| Breast cancer | CD34 | TissueFAXS (TissueGnostics, Vienna, Austria) | HistoQuest (TissueGnostics, Vienna, Austria) | [134] |
| Breast cancer metastasis | CD31 | Panoramic 250 (3Dhistech, Budapest, Hungary) | Visiopharm image analysis software (Visiopharm, Copenhagen, Denmark) | [135] |
| CRC | CD31 | Mirax slide scanner system (3Dhistech, Budapest, Hungary) | Image J software (NIH, Bethesda, MD, USA) | [136] |
| CRC | CD31 | TissueFAXS (TissueGnostics, Vienna, Austria) | StrataQuest (TissueGnostics, Vienna, Austria) | [137] |
| ESCC | CD31 | TissueFAXS (TissueGnostics, Vienna, Austria) | HistoQuest, TissueQuest (TissueGnostics, Vienna, Austria) | [138] |
| Human tumor | CD31, CD34 | Aperio (Leica Biosystems Inc., Richmond, IL, USA) | Fiji, Image J software (NIH, Bethesda, MD, USA) | [139] |
| Melanoma | CD31 | Aperio CS Scanner (Leica Biosystems Inc., Richmond, IL, USA) | Aperio image analysis system (Leica Biosystems Inc., Richmond, IL, USA) | [140] |
| Pancreatic cancer | CD31 | n.s. | The Ariol™ image analysis system (Genetix, New Milton, England) | [141] |
| Renal cancer | CD34 | Zeiss Axio Scan.Z1 (Zeiss, Jena, Germany) | Developer XD, Tissue Studio (Definiens, Munich, Germany) | [142] |
| Rectal cancer | CD34 | ScanScope CS (Aperio Technologies, Vista, CA, USA) | ImageScope (Aperio Technologies, Vista, CA, USA) | [143] |
| Tongue cancer | PNAd | ScanScope T3 (Aperio Technologies, Vista, CA, USA) | Image J software (NIH, Bethesda, MD, USA) | [144] |
CRC, colorectal cancer; n.s., not specified; ESCC, esophageal squamous cell carcinoma.
This entry is adapted from the peer-reviewed paper 10.3390/genes12040538
References
- Wong, M.L.; Medrano, J.F. Real-time PCR for mRNA quantitation. BioTechniques 2005, 39, 75–85.
- Morley-Bunker, A.; Pearson, J.; Currie, M.J.; Morrin, H.; Whitehead, M.R.; Eglinton, T.; Walker, L.C. Assessment of intra-tumoural colorectal cancer prognostic biomarkers using RNA in situ hybridisation. Oncotarget 2019, 10, 1425–1439.
- Wang, F.; Flanagan, J.; Su, N.; Wang, L.C.; Bui, S.; Nielson, A.; Wu, X.; Vo, H.T.; Ma, X.J.; Luo, Y. RNAscope: A novel in situ RNA analysis platform for formalin-fixed, paraffin-embedded tissues. J. Mol. Diagn. JMD 2012, 14, 22–29.
- Grün, D.; van Oudenaarden, A. Design and Analysis of Single-Cell Sequencing Experiments. Cell 2015, 163, 799–810.
- Jin, L.; Lloyd, R.V. In situ hybridization: Methods and applications. J. Clin. Lab. Anal. 1997, 11, 2–9.
- Kenny, D.; Shen, L.P.; Kolberg, J.A. Detection of viral infection and gene expression in clinical tissue specimens using branched DNA (bDNA) in situ hybridization. J. Histochem. Cytochem. 2002, 50, 1219–1227.
- Thomsen, R.; Nielsen, P.S.; Jensen, T.H. Dramatically improved RNA in situ hybridization signals using LNA-modified probes. RNA 2005, 11, 1745–1748.
- Yin, V.P. In Situ Detection of MicroRNA Expression with RNAscope Probes. Methods Mol. Biol. 2018, 1649, 197–208.
- Cassidy, A.; Jones, J. Developments in in situ hybridisation. Methods 2014, 70, 39–45.
- Wang, H.; Su, N.; Wang, L.C.; Wu, X.; Bui, S.; Nielsen, A.; Vo, H.T.; Luo, Y.; Ma, X.J. Dual-color ultrasensitive bright-field RNA in situ hybridization with RNAscope. Methods Mol. Biol. 2014, 1211, 139–149.
- Carossino, M.; Loynachan, A.T.; James MacLachlan, N.; Drew, C.; Shuck, K.M.; Timoney, P.J.; Del Piero, F.; Balasuriya, U.B. Detection of equine arteritis virus by two chromogenic RNA in situ hybridization assays (conventional and RNAscope(®)) and assessment of their performance in tissues from aborted equine fetuses. Arch. Virol. 2016, 161, 3125–3136.
- Deleage, C.; Wietgrefe, S.W.; Del Prete, G.; Morcock, D.R.; Hao, X.P.; Piatak, M., Jr.; Bess, J.; Anderson, J.L.; Perkey, K.E.; Reilly, C.; et al. Defining HIV and SIV Reservoirs in Lymphoid Tissues. Pathog. Immun. 2016, 1, 68–106.
- Roe, C.J.; Siddiqui, M.T.; Lawson, D.; Cohen, C. RNA In Situ Hybridization for Epstein-Barr Virus and Cytomegalovirus: Comparison With In Situ Hybridization and Immunohistochemistry. Appl. Immunohistochem. Mol. Morphol. AIMM 2019, 27, 155–159.
- Wang, H.; Wang, M.X.; Su, N.; Wang, L.C.; Wu, X.; Bui, S.; Nielsen, A.; Vo, H.T.; Nguyen, N.; Luo, Y.; et al. RNAscope for in situ detection of transcriptionally active human papillomavirus in head and neck squamous cell carcinoma. J. Vis. Exp. JoVE 2014.
- Zhang, W.; Svensson Akusjärvi, S.; Sönnerborg, A.; Neogi, U. Characterization of Inducible Transcription and Translation-Competent HIV-1 Using the RNAscope ISH Technology at a Single-Cell Resolution. Front. Microbiol. 2018, 9, 2358.
- Venteicher, A.S.; Tirosh, I.; Hebert, C.; Yizhak, K.; Neftel, C.; Filbin, M.G.; Hovestadt, V.; Escalante, L.E.; Shaw, M.L.; Rodman, C.; et al. Decoupling genetics, lineages, and microenvironment in IDH-mutant gliomas by single-cell RNA-seq. Science 2017, 355.
- Zeisel, A.; Hochgerner, H.; Lönnerberg, P.; Johnsson, A.; Memic, F.; van der Zwan, J.; Häring, M.; Braun, E.; Borm, L.E.; La Manno, G.; et al. Molecular Architecture of the Mouse Nervous System. Cell 2018, 174, 999–1014.e1022.
- Lee, J.C.; Jeng, Y.M.; Su, S.Y.; Wu, C.T.; Tsai, K.S.; Lee, C.H.; Lin, C.Y.; Carter, J.M.; Huang, J.W.; Chen, S.H.; et al. Identification of a novel FN1-FGFR1 genetic fusion as a frequent event in phosphaturic mesenchymal tumour. J. Pathol. 2015, 235, 539–545.
- Wu, G.; Barnhill, R.L.; Lee, S.; Li, Y.; Shao, Y.; Easton, J.; Dalton, J.; Zhang, J.; Pappo, A.; Bahrami, A. The landscape of fusion transcripts in spitzoid melanoma and biologically indeterminate spitzoid tumors by RNA sequencing. Mod. Pathol. 2016, 29, 359–369.
- Nasir, A.; Reising, L.O.; Nedderman, D.M.; Fulford, A.D.; Uhlik, M.T.; Benjamin, L.E.; Schade, A.E.; Holzer, T.R. Heterogeneity of Vascular Endothelial Growth Factor Receptors 1, 2, 3 in Primary Human Colorectal Carcinoma. Anticancer Res. 2016, 36, 2683–2696.
- Wang, Z.; Portier, B.P.; Gruver, A.M.; Bui, S.; Wang, H.; Su, N.; Vo, H.T.; Ma, X.J.; Luo, Y.; Budd, G.T.; et al. Automated quantitative RNA in situ hybridization for resolution of equivocal and heterogeneous ERBB2 (HER2) status in invasive breast carcinoma. J. Mol. Diagn. JMD 2013, 15, 210–219.
- Barry, E.R.; Morikawa, T.; Butler, B.L.; Shrestha, K.; de la Rosa, R.; Yan, K.S.; Fuchs, C.S.; Magness, S.T.; Smits, R.; Ogino, S.; et al. Restriction of intestinal stem cell expansion and the regenerative response by YAP. Nature 2013, 493, 106–110.
- Jang, B.G.; Lee, B.L.; Kim, W.H. Distribution of LGR5+ cells and associated implications during the early stage of gastric tumorigenesis. PLoS ONE 2013, 8, e82390.
- Ziskin, J.L.; Dunlap, D.; Yaylaoglu, M.; Fodor, I.K.; Forrest, W.F.; Patel, R.; Ge, N.; Hutchins, G.G.; Pine, J.K.; Quirke, P.; et al. In situ validation of an intestinal stem cell signature in colorectal cancer. Gut 2013, 62, 1012–1023.
- Payne, R.E.; Wang, F.; Su, N.; Krell, J.; Zebrowski, A.; Yagüe, E.; Ma, X.J.; Luo, Y.; Coombes, R.C. Viable circulating tumour cell detection using multiplex RNA in situ hybridisation predicts progression-free survival in metastatic breast cancer patients. Br. J. Cancer 2012, 106, 1790–1797.
- Yu, M.; Bardia, A.; Wittner, B.S.; Stott, S.L.; Smas, M.E.; Ting, D.T.; Isakoff, S.J.; Ciciliano, J.C.; Wells, M.N.; Shah, A.M.; et al. Circulating breast tumor cells exhibit dynamic changes in epithelial and mesenchymal composition. Science 2013, 339, 580–584.
- Kim, S.Y.; Theunissen, J.W.; Balibalos, J.; Liao-Chan, S.; Babcock, M.C.; Wong, T.; Cairns, B.; Gonzalez, D.; van der Horst, E.H.; Perez, M.; et al. A novel antibody-drug conjugate targeting SAIL for the treatment of hematologic malignancies. Blood Cancer J. 2015, 5, e316.
- Naipal, K.A.; Verkaik, N.S.; Ameziane, N.; van Deurzen, C.H.; Ter Brugge, P.; Meijers, M.; Sieuwerts, A.M.; Martens, J.W.; O’Connor, M.J.; Vrieling, H.; et al. Functional ex vivo assay to select homologous recombination-deficient breast tumors for PARP inhibitor treatment. Clin. Cancer Res. 2014, 20, 4816–4826.
- Carossino, M.; Ip, H.S.; Richt, J.A.; Shultz, K.; Harper, K.; Loynachan, A.T.; Del Piero, F.; Balasuriya, U.B.R. Detection of SARS-CoV-2 by RNAscope(®) in situ hybridization and immunohistochemistry techniques. Arch. Virol. 2020, 165, 2373–2377.
- Boukerroucha, M.; Josse, C.; ElGuendi, S.; Boujemla, B.; Frères, P.; Marée, R.; Wenric, S.; Segers, K.; Collignon, J.; Jerusalem, G.; et al. Evaluation of BRCA1-related molecular features and microRNAs as prognostic factors for triple negative breast cancers. BMC Cancer 2015, 15, 755.
- Fabbri, E.; Brognara, E.; Montagner, G.; Ghimenton, C.; Eccher, A.; Cantù, C.; Khalil, S.; Bezzerri, V.; Provezza, L.; Bianchi, N.; et al. Regulation of IL-8 gene expression in gliomas by microRNA miR-93. BMC Cancer 2015, 15, 661.
- Lessard, L.; Liu, M.; Marzese, D.M.; Wang, H.; Chong, K.; Kawas, N.; Donovan, N.C.; Kiyohara, E.; Hsu, S.; Nelson, N.; et al. The CASC15 Long Intergenic Noncoding RNA Locus Is Involved in Melanoma Progression and Phenotype Switching. J. Investig. Dermatol. 2015, 135, 2464–2474.
- Xing, Z.; Park, P.K.; Lin, C.; Yang, L. LncRNA BCAR4 wires up signaling transduction in breast cancer. RNA Biol. 2015, 12, 681–689.
- Welti, J.; Rodrigues, D.N.; Sharp, A.; Sun, S.; Lorente, D.; Riisnaes, R.; Figueiredo, I.; Zafeiriou, Z.; Rescigno, P.; de Bono, J.S.; et al. Analytical Validation and Clinical Qualification of a New Immunohistochemical Assay for Androgen Receptor Splice Variant-7 Protein Expression in Metastatic Castration-resistant Prostate Cancer. Eur. Urol. 2016, 70, 599–608.
- Guedes, L.B.; Morais, C.L.; Almutairi, F.; Haffner, M.C.; Zheng, Q.; Isaacs, J.T.; Antonarakis, E.S.; Lu, C.; Tsai, H.; Luo, J.; et al. Analytic Validation of RNA In Situ Hybridization (RISH) for AR and AR-V7 Expression in Human Prostate Cancer. Clin. Cancer Res. 2016, 22, 4651–4663.
- Anderson, C.M.; Zhang, B.; Miller, M.; Butko, E.; Wu, X.; Laver, T.; Kernag, C.; Kim, J.; Luo, Y.; Lamparski, H.; et al. Fully Automated RNAscope In Situ Hybridization Assays for Formalin-Fixed Paraffin-Embedded Cells and Tissues. J. Cell. Biochem. 2016, 117, 2201–2208.
- Anderson, N.M.; Simon, M.C. The tumor microenvironment. Curr. Biol. CB 2020, 30, R921–R925.
- Du, Z.; Abedalthagafi, M.; Aizer, A.A.; McHenry, A.R.; Sun, H.H.; Bray, M.A.; Viramontes, O.; Machaidze, R.; Brastianos, P.K.; Reardon, D.A.; et al. Increased expression of the immune modulatory molecule PD-L1 (CD274) in anaplastic meningioma. Oncotarget 2015, 6, 4704–4716.
- Patel, K.R.; Liu, T.C.; Vaccharajani, N.; Chapman, W.C.; Brunt, E.M. Characterization of inflammatory (lymphoepithelioma-like) hepatocellular carcinoma: A study of 8 cases. Arch. Pathol. Lab. Med. 2014, 138, 1193–1202.
- De Monte, L.; Wörmann, S.; Brunetto, E.; Heltai, S.; Magliacane, G.; Reni, M.; Paganoni, A.M.; Recalde, H.; Mondino, A.; Falconi, M.; et al. Basophil Recruitment into Tumor-Draining Lymph Nodes Correlates with Th2 Inflammation and Reduced Survival in Pancreatic Cancer Patients. Cancer Res. 2016, 76, 1792–1803.
- Ukpo, O.C.; Thorstad, W.L.; Lewis, J.S., Jr. B7-H1 expression model for immune evasion in human papillomavirus-related oropharyngeal squamous cell carcinoma. Head Neck Pathol. 2013, 7, 113–121.
- Kim, J.; Li, N.; He, M.; Zhang, B.; Su, N.; Ma, X.-J.; Park, E. Abstract A24: Evaluation of the expression of immune functional markers in the tumor microenvironment. Cancer Immunol. Res. 2017, 5, A24.
- Dikshit, A.; Phatak, J.; Kernag, S.; Pimental, H.; Zong, H.; Todorov, C.; Hernandez, L.; Kim, J.; Zhang, B.; Anderson, C.; et al. Abstract 2706: Spatially resolve RNA and protein simultaneously in FFPE tumor samples by combining RNAscope in situ hybridization and immunohistochemistry assays. Cancer Res. 2020, 80, 2706.
- Staudt, N.D.; Jo, M.; Hu, J.; Bristow, J.M.; Pizzo, D.P.; Gaultier, A.; VandenBerg, S.R.; Gonias, S.L. Myeloid cell receptor LRP1/CD91 regulates monocyte recruitment and angiogenesis in tumors. Cancer Res. 2013, 73, 3902–3912.
- Shames, D.S.; Carbon, J.; Walter, K.; Jubb, A.M.; Kozlowski, C.; Januario, T.; Do, A.; Fu, L.; Xiao, Y.; Raja, R.; et al. High heregulin expression is associated with activated HER3 and may define an actionable biomarker in patients with squamous cell carcinomas of the head and neck. PLoS ONE 2013, 8, e56765.
- Lee, Y.; Shin, J.H.; Longmire, M.; Wang, H.; Kohrt, H.E.; Chang, H.Y.; Sunwoo, J.B. CD44+ Cells in Head and Neck Squamous Cell Carcinoma Suppress T-Cell-Mediated Immunity by Selective Constitutive and Inducible Expression of PD-L1. Clin. Cancer Res. 2016, 22, 3571–3581.
- bitesizebio.com. New-ISH on the Block: Introduction to RNAscope®. Available online: (accessed on 7 January 2021).
- Annese, T.; Tamma, R.; De Giorgis, M.; Ruggieri, S.; Maiorano, E.; Specchia, G.; Ribatti, D. RNAscope dual ISH-IHC technology to study angiogenesis in diffuse large B-cell lymphomas. Histochem. Cell Biol. 2020, 153, 185–192.
- Chan, S.; Filézac de L’Etang, A.; Rangell, L.; Caplazi, P.; Lowe, J.B.; Romeo, V. A method for manual and automated multiplex RNAscope in situ hybridization and immunocytochemistry on cytospin samples. PLoS ONE 2018, 13, e0207619.
- Yang, J.Q.; Wu, M.; Han, F.Y.; Sun, Y.M.; Zhang, L.; Liu, H.X. High risk HPV detection by RNAscope in situ hybridization combined with Cdc2 protein expression by immunohistochemistry for prognosis of oropharyngeal squamous cell carcinoma. Int. J. Clin. Exp. Pathol. 2020, 13, 2192–2200.
- Shakya, R.; Nguyen, T.H.; Waterhouse, N.; Khanna, R. Immune contexture analysis in immuno-oncology: Applications and challenges of multiplex fluorescent immunohistochemistry. Clin. Transl. Immunol. 2020, 9, e1183.
- Angell, H.K.; Gray, N.; Womack, C.; Pritchard, D.I.; Wilkinson, R.W.; Cumberbatch, M. Digital pattern recognition-based image analysis quantifies immune infiltrates in distinct tissue regions of colorectal cancer and identifies a metastatic phenotype. Br. J. Cancer 2013, 109, 1618–1624.
- Bindea, G.; Mlecnik, B.; Fridman, W.-H.; Galon, J. The prognostic impact of anti-cancer immune response: A novel classification of cancer patients. Semin. Immunopathol. 2011, 33, 335–340.
- Pagès, F.; Mlecnik, B.; Marliot, F.; Bindea, G.; Ou, F.S.; Bifulco, C.; Lugli, A.; Zlobec, I.; Rau, T.T.; Berger, M.D.; et al. International validation of the consensus Immunoscore for the classification of colon cancer: A prognostic and accuracy study. Lancet 2018, 391, 2128–2139.
- Seo, A.N.; Lee, H.J.; Kim, E.J.; Kim, H.J.; Jang, M.H.; Lee, H.E.; Kim, Y.J.; Kim, J.H.; Park, S.Y. Tumour-infiltrating CD8+ lymphocytes as an independent predictive factor for pathological complete response to primary systemic therapy in breast cancer. Br. J. Cancer 2013, 109, 2705–2713.
- García-Martínez, E.; Gil, G.L.; Benito, A.C.; González-Billalabeitia, E.; Conesa, M.A.; García García, T.; García-Garre, E.; Vicente, V.; Ayala de la Peña, F. Tumor-infiltrating immune cell profiles and their change after neoadjuvant chemotherapy predict response and prognosis of breast cancer. Breast Cancer Res. BCR 2014, 16, 488.
- Humphries, M.P.; Hynes, S.; Bingham, V.; Cougot, D.; James, J.; Patel-Socha, F.; Parkes, E.E.; Blayney, J.K.; O’Rorke, M.A.; Irwin, G.W.; et al. Automated Tumour Recognition and Digital Pathology Scoring Unravels New Role for PD-L1 in Predicting Good Outcome in ER-/HER2+ Breast Cancer. J. Oncol. 2018, 2018, 2937012.
- Rasmusson, A.; Zilenaite, D.; Nestarenkaite, A.; Augulis, R.; Laurinaviciene, A.; Ostapenko, V.; Poskus, T.; Laurinavicius, A. Immunogradient Indicators for Antitumor Response Assessment by Automated Tumor-Stroma Interface Zone Detection. Am. J. Pathol. 2020, 190, 1309–1322.
- Martinet, L.; Filleron, T.; Le Guellec, S.; Rochaix, P.; Garrido, I.; Girard, J.P. High endothelial venule blood vessels for tumor-infiltrating lymphocytes are associated with lymphotoxin β-producing dendritic cells in human breast cancer. J. Immunol. 2013, 191, 2001–2008.
- Martinet, L.; Garrido, I.; Filleron, T.; Le Guellec, S.; Bellard, E.; Fournie, J.J.; Rochaix, P.; Girard, J.P. Human solid tumors contain high endothelial venules: Association with T- and B-lymphocyte infiltration and favorable prognosis in breast cancer. Cancer Res. 2011, 71, 5678–5687.
- Sobral-Leite, M.; Van de Vijver, K.; Michaut, M.; van der Linden, R.; Hooijer, G.K.J.; Horlings, H.M.; Severson, T.M.; Mulligan, A.M.; Weerasooriya, N.; Sanders, J.; et al. Assessment of PD-L1 expression across breast cancer molecular subtypes, in relation to mutation rate, BRCA1-like status, tumor-infiltrating immune cells and survival. Oncoimmunology 2018, 7, e1509820.
- He, T.F.; Yost, S.E.; Frankel, P.H.; Dagis, A.; Cao, Y.; Wang, R.; Rosario, A.; Tu, T.Y.; Solomon, S.; Schmolze, D.; et al. Multi-panel immunofluorescence analysis of tumor infiltrating lymphocytes in triple negative breast cancer: Evolution of tumor immune profiles and patient prognosis. PLoS ONE 2020, 15, e0229955.
- Yoon, H.H.; Shi, Q.; Heying, E.N.; Muranyi, A.; Bredno, J.; Ough, F.; Djalilvand, A.; Clements, J.; Bowermaster, R.; Liu, W.W.; et al. Intertumoral Heterogeneity of CD3(+) and CD8(+) T-Cell Densities in the Microenvironment of DNA Mismatch-Repair-Deficient Colon Cancers: Implications for Prognosis. Clin. Cancer Res. 2019, 25, 125–133.
- Nearchou, I.P.; Lillard, K.; Gavriel, C.G.; Ueno, H.; Harrison, D.J.; Caie, P.D. Automated Analysis of Lymphocytic Infiltration, Tumor Budding, and Their Spatial Relationship Improves Prognostic Accuracy in Colorectal Cancer. Cancer Immunol. Res. 2019, 7, 609–620.
- Chen, Y.; Yuan, R.; Wu, X.; He, X.; Zeng, Y.; Fan, X.; Wang, L.; Wang, J.; Lan, P.; Wu, X. A Novel Immune Marker Model Predicts Oncological Outcomes of Patients with Colorectal Cancer. Ann. Surg. Oncol. 2016, 23, 826–832.
- Edin, S.; Kaprio, T.; Hagström, J.; Larsson, P.; Mustonen, H.; Böckelman, C.; Strigård, K.; Gunnarsson, U.; Haglund, C.; Palmqvist, R. The Prognostic Importance of CD20(+) B lymphocytes in Colorectal Cancer and the Relation to Other Immune Cell subsets. Sci. Rep. 2019, 9, 19997.
- Miller, T.J.; McCoy, M.J.; Hemmings, C.; Bulsara, M.K.; Iacopetta, B.; Platell, C.F. The prognostic value of cancer stem-like cell markers SOX2 and CD133 in stage III colon cancer is modified by expression of the immune-related markers FoxP3, PD-L1 and CD3. Pathology 2017, 49, 721–730.
- Miller, T.J.; Anyaegbu, C.C.; Lee-Pullen, T.F.; Spalding, L.J.; Platell, C.F.; McCoy, M.J. PD-L1+ dendritic cells in the tumor microenvironment correlate with good prognosis and CD8+ T cell infiltration in colon cancer. Cancer Sci. 2020.
- Herrera, M.; Mezheyeuski, A.; Villabona, L.; Corvigno, S.; Strell, C.; Klein, C.; Hölzlwimmer, G.; Glimelius, B.; Masucci, G.; Sjöblom, T.; et al. Prognostic Interactions between FAP+ Fibroblasts and CD8a+ T Cells in Colon Cancer. Cancers 2020, 12, 3238.
- Mungenast, F.; Meshcheryakova, A.; Beer, A.; Salzmann, M.; Tamandl, D.; Gruenberger, T.; Pietschmann, P.; Koperek, O.; Birner, P.; Kirsch, I.; et al. The Immune Phenotype of Isolated Lymphoid Structures in Non-Tumorous Colon Mucosa Encrypts the Information on Pathobiology of Metastatic Colorectal Cancer. Cancers 2020, 12, 3117.
- Meshcheryakova, A.; Tamandl, D.; Bajna, E.; Stift, J.; Mittlboeck, M.; Svoboda, M.; Heiden, D.; Stremitzer, S.; Jensen-Jarolim, E.; Grünberger, T.; et al. B cells and ectopic follicular structures: Novel players in anti-tumor programming with prognostic power for patients with metastatic colorectal cancer. PLoS ONE 2014, 9, e99008.
- Tanis, E.; Julié, C.; Emile, J.F.; Mauer, M.; Nordlinger, B.; Aust, D.; Roth, A.; Lutz, M.P.; Gruenberger, T.; Wrba, F.; et al. Prognostic impact of immune response in resectable colorectal liver metastases treated by surgery alone or surgery with perioperative FOLFOX in the randomised EORTC study 40983. Eur. J. Cancer 2015, 51, 2708–2717.
- Mlecnik, B.; Van den Eynde, M.; Bindea, G.; Church, S.E.; Vasaturo, A.; Fredriksen, T.; Lafontaine, L.; Haicheur, N.; Marliot, F.; Debetancourt, D.; et al. Comprehensive Intrametastatic Immune Quantification and Major Impact of Immunoscore on Survival. J. Natl. Cancer Inst. 2018, 110, 97–108.
- Ma, J.; Li, J.; Qian, M.; Han, W.; Tian, M.; Li, Z.; Wang, Z.; He, S.; Wu, K. PD-L1 expression and the prognostic significance in gastric cancer: A retrospective comparison of three PD-L1 antibody clones (SP142, 28–8 and E1L3N). Diagn. Pathol. 2018, 13, 91.
- Kim, J.W.; Nam, K.H.; Ahn, S.H.; Park, D.J.; Kim, H.H.; Kim, S.H.; Chang, H.; Lee, J.O.; Kim, Y.J.; Lee, H.S.; et al. Prognostic implications of immunosuppressive protein expression in tumors as well as immune cell infiltration within the tumor microenvironment in gastric cancer. Gastric Cancer 2016, 19, 42–52.
- Kim, K.J.; Lee, K.S.; Cho, H.J.; Kim, Y.H.; Yang, H.K.; Kim, W.H.; Kang, G.H. Prognostic implications of tumor-infiltrating FoxP3+ regulatory T cells and CD8+ cytotoxic T cells in microsatellite-unstable gastric cancers. Hum. Pathol. 2014, 45, 285–293.
- Koh, J.; Ock, C.Y.; Kim, J.W.; Nam, S.K.; Kwak, Y.; Yun, S.; Ahn, S.H.; Park, D.J.; Kim, H.H.; Kim, W.H.; et al. Clinicopathologic implications of immune classification by PD-L1 expression and CD8-positive tumor-infiltrating lymphocytes in stage II and III gastric cancer patients. Oncotarget 2017, 8, 26356–26367.
- Wang, M.; Huang, Y.K.; Kong, J.C.; Sun, Y.; Tantalo, D.G.; Yeang, H.X.A.; Ying, L.; Yan, F.; Xu, D.; Halse, H.; et al. High-dimensional analyses reveal a distinct role of T-cell subsets in the immune microenvironment of gastric cancer. Clin. Transl. Immunol. 2020, 9, e1127.
- Svensson, M.C.; Warfvinge, C.F.; Fristedt, R.; Hedner, C.; Borg, D.; Eberhard, J.; Micke, P.; Nodin, B.; Leandersson, K.; Jirström, K. The integrative clinical impact of tumor-infiltrating T lymphocytes and NK cells in relation to B lymphocyte and plasma cell density in esophageal and gastric adenocarcinoma. Oncotarget 2017, 8, 72108–72126.
- Kim, H.-N.; Jang, J.; Heo, Y.J.; Kim, B.; Jung, H.; Jang, Y.; Kang, S.Y.; Kim, S.T.; Lee, J.; Kang, W.K.; et al. PD-L1 expression in gastric cancer determined by digital image analyses: Pitfalls and correlation with pathologist interpretation. Virchows Arch. 2020, 476, 243–250.
- Sun, C.; Xu, J.; Song, J.; Liu, C.; Wang, J.; Weng, C.; Sun, H.; Wei, H.; Xiao, W.; Sun, R.; et al. The predictive value of centre tumour CD8⁺ T cells in patients with hepatocellular carcinoma: Comparison with Immunoscore. Oncotarget 2015, 6, 35602–35615.
- Gabrielson, A.; Wu, Y.; Wang, H.; Jiang, J.; Kallakury, B.; Gatalica, Z.; Reddy, S.; Kleiner, D.; Fishbein, T.; Johnson, L.; et al. Intratumoral CD3 and CD8 T-cell Densities Associated with Relapse-Free Survival in HCC. Cancer Immunol. Res. 2016, 4, 419–430.
- Finkin, S.; Yuan, D.; Stein, I.; Taniguchi, K.; Weber, A.; Unger, K.; Browning, J.L.; Goossens, N.; Nakagawa, S.; Gunasekaran, G.; et al. Ectopic lymphoid structures function as microniches for tumor progenitor cells in hepatocellular carcinoma. Nat. Immunol. 2015, 16, 1235–1244.
- Ma, J.; Zheng, B.; Goswami, S.; Meng, L.; Zhang, D.; Cao, C.; Li, T.; Zhu, F.; Ma, L.; Zhang, Z.; et al. PD1(Hi) CD8(+) T cells correlate with exhausted signature and poor clinical outcome in hepatocellular carcinoma. J. Immunother. Cancer 2019, 7, 331.
- Garnelo, M.; Tan, A.; Her, Z.; Yeong, J.; Lim, C.J.; Chen, J.; Lim, K.H.; Weber, A.; Chow, P.; Chung, A.; et al. Interaction between tumour-infiltrating B cells and T cells controls the progression of hepatocellular carcinoma. Gut 2017, 66, 342–351.
- Yao, Q.; Bao, X.; Xue, R.; Liu, H.; Liu, H.; Li, J.; Dong, J.; Duan, Z.; Ren, M.; Zhao, J.; et al. Prognostic value of immunoscore to identify mortality outcomes in adults with HBV-related primary hepatocellular carcinoma. Medicine 2017, 96, e6735.
- Huang, Y.; Wang, F.M.; Wang, T.; Wang, Y.J.; Zhu, Z.Y.; Gao, Y.T.; Du, Z. Tumor-infiltrating FoxP3+ Tregs and CD8+ T cells affect the prognosis of hepatocellular carcinoma patients. Digestion 2012, 86, 329–337.
- Amin, D.; Richa, T.; Mollaee, M.; Zhan, T.; Tassone, P.; Johnson, J.; Luginbuhl, A.; Cognetti, D.; Martinez-Outschoorn, U.; Stapp, R.; et al. Metformin Effects on FOXP3(+) and CD8(+) T Cell Infiltrates of Head and Neck Squamous Cell Carcinoma. Laryngoscope 2020, 130, E490–E498.
- Zhang, X.M.; Song, L.J.; Shen, J.; Yue, H.; Han, Y.Q.; Yang, C.L.; Liu, S.Y.; Deng, J.W.; Jiang, Y.; Fu, G.H.; et al. Prognostic and predictive values of immune infiltrate in patients with head and neck squamous cell carcinoma. Hum. Pathol. 2018, 82, 104–112.
- Koelzer, V.H.; Gisler, A.; Hanhart, J.C.; Griss, J.; Wagner, S.N.; Willi, N.; Cathomas, G.; Sachs, M.; Kempf, W.; Thommen, D.S.; et al. Digital image analysis improves precision of PD-L1 scoring in cutaneous melanoma. Histopathology 2018, 73, 397–406.
- Garg, K.; Maurer, M.; Griss, J.; Brüggen, M.C.; Wolf, I.H.; Wagner, C.; Willi, N.; Mertz, K.D.; Wagner, S.N. Tumor-associated B cells in cutaneous primary melanoma and improved clinical outcome. Hum. Pathol. 2016, 54, 157–164.
- Gartrell, R.D.; Marks, D.K.; Hart, T.D.; Li, G.; Davari, D.R.; Wu, A.; Blake, Z.; Lu, Y.; Askin, K.N.; Monod, A.; et al. Quantitative Analysis of Immune Infiltrates in Primary Melanoma. Cancer Immunol. Res. 2018, 6, 481–493.
- Griss, J.; Bauer, W.; Wagner, C.; Simon, M.; Chen, M.; Grabmeier-Pfistershammer, K.; Maurer-Granofszky, M.; Roka, F.; Penz, T.; Bock, C.; et al. B cells sustain inflammation and predict response to immune checkpoint blockade in human melanoma. Nat. Commun. 2019, 10, 4186.
- Thommen, D.S.; Koelzer, V.H.; Herzig, P.; Roller, A.; Trefny, M.; Dimeloe, S.; Kiialainen, A.; Hanhart, J.; Schill, C.; Hess, C.; et al. A transcriptionally and functionally distinct PD-1+ CD8+ T cell pool with predictive potential in non-small-cell lung cancer treated with PD-1 blockade. Nat. Med. 2018, 24, 994–1004.
- Goc, J.; Germain, C.; Vo-Bourgais, T.K.; Lupo, A.; Klein, C.; Knockaert, S.; de Chaisemartin, L.; Ouakrim, H.; Becht, E.; Alifano, M.; et al. Dendritic cells in tumor-associated tertiary lymphoid structures signal a Th1 cytotoxic immune contexture and license the positive prognostic value of infiltrating CD8+ T cells. Cancer Res. 2014, 74, 705–715.
- Sepesi, B.; Cuentas, E.P.; Canales, J.R.; Behrens, C.; Correa, A.M.; Vaporciyan, A.; Weissferdt, A.; Kalhor, N.; Moran, C.; Swisher, S.; et al. Programmed Death Cell Ligand 1 (PD-L1) Is Associated With Survival in Stage I Non-Small Cell Lung Cancer. Semin. Thorac. Cardiovasc. Surg. 2017, 29, 408–415.
- Kinoshita, T.; Kudo-Saito, C.; Muramatsu, R.; Fujita, T.; Saito, M.; Nagumo, H.; Sakurai, T.; Noji, S.; Takahata, E.; Yaguchi, T.; et al. Determination of poor prognostic immune features of tumour microenvironment in non-smoking patients with lung adenocarcinoma. Eur. J. Cancer 2017, 86, 15–27.
- Parra, E.R.; Behrens, C.; Rodriguez-Canales, J.; Lin, H.; Mino, B.; Blando, J.; Zhang, J.; Gibbons, D.L.; Heymach, J.V.; Sepesi, B.; et al. Image Analysis-based Assessment of PD-L1 and Tumor-Associated Immune Cells Density Supports Distinct Intratumoral Microenvironment Groups in Non-small Cell Lung Carcinoma Patients. Clin. Cancer Res. 2016, 22, 6278–6289.
- Kinoshita, T.; Muramatsu, R.; Fujita, T.; Nagumo, H.; Sakurai, T.; Noji, S.; Takahata, E.; Yaguchi, T.; Tsukamoto, N.; Kudo-Saito, C.; et al. Prognostic value of tumor-infiltrating lymphocytes differs depending on histological type and smoking habit in completely resected non-small-cell lung cancer. Ann. Oncol. 2016, 27, 2117–2123.
- Cao, L.; Che, X.; Qiu, X.; Li, Z.; Yang, B.; Wang, S.; Hou, K.; Fan, Y.; Qu, X.; Liu, Y. M2 macrophage infiltration into tumor islets leads to poor prognosis in non-small-cell lung cancer. Cancer Manag. Res. 2019, 11, 6125–6138.
- Barua, S.; Fang, P.; Sharma, A.; Fujimoto, J.; Wistuba, I.; Rao, A.U.K.; Lin, S.H. Spatial interaction of tumor cells and regulatory T cells correlates with survival in non-small cell lung cancer. Lung Cancer 2018, 117, 73–79.
- O’Callaghan, D.S.; Rexhepaj, E.; Gately, K.; Coate, L.; Delaney, D.; O’Donnell, D.M.; Kay, E.; O’Connell, F.; Gallagher, W.M.; O’Byrne, K.J. Tumour islet Foxp3+ T-cell infiltration predicts poor outcome in nonsmall cell lung cancer. Eur. Respir. J. 2015, 46, 1762–1772.
- Althammer, S.; Tan, T.H.; Spitzmüller, A.; Rognoni, L.; Wiestler, T.; Herz, T.; Widmaier, M.; Rebelatto, M.C.; Kaplon, H.; Damotte, D.; et al. Automated image analysis of NSCLC biopsies to predict response to anti-PD-L1 therapy. J. Immunother. Cancer 2019, 7, 121.
- Kim, M.Y.; Koh, J.; Kim, S.; Go, H.; Jeon, Y.K.; Chung, D.H. Clinicopathological analysis of PD-L1 and PD-L2 expression in pulmonary squamous cell carcinoma: Comparison with tumor-infiltrating T cells and the status of oncogenic drivers. Lung Cancer 2015, 88, 24–33.
- Siliņa, K.; Soltermann, A.; Attar, F.M.; Casanova, R.; Uckeley, Z.M.; Thut, H.; Wandres, M.; Isajevs, S.; Cheng, P.; Curioni-Fontecedro, A.; et al. Germinal Centers Determine the Prognostic Relevance of Tertiary Lymphoid Structures and Are Impaired by Corticosteroids in Lung Squamous Cell Carcinoma. Cancer Res. 2018, 78, 1308–1320.
- Feng, Z.; Bethmann, D.; Kappler, M.; Ballesteros-Merino, C.; Eckert, A.; Bell, R.B.; Cheng, A.; Bui, T.; Leidner, R.; Urba, W.J.; et al. Multiparametric immune profiling in HPV- oral squamous cell cancer. JCI Insight 2017, 2.
- Desbois, M.; Udyavar, A.R.; Ryner, L.; Kozlowski, C.; Guan, Y.; Dürrbaum, M.; Lu, S.; Fortin, J.P.; Koeppen, H.; Ziai, J.; et al. Integrated digital pathology and transcriptome analysis identifies molecular mediators of T-cell exclusion in ovarian cancer. Nat. Commun. 2020, 11, 5583.
- Bachmayr-Heyda, A.; Aust, S.; Heinze, G.; Polterauer, S.; Grimm, C.; Braicu, E.I.; Sehouli, J.; Lambrechts, S.; Vergote, I.; Mahner, S.; et al. Prognostic impact of tumor infiltrating CD8+ T cells in association with cell proliferation in ovarian cancer patients--a study of the OVCAD consortium. BMC Cancer 2013, 13, 422.
- Montfort, A.; Owen, S.; Piskorz, A.M.; Supernat, A.; Moore, L.; Al-Khalidi, S.; Böhm, S.; Pharoah, P.; McDermott, J.; Balkwill, F.R.; et al. Combining measures of immune infiltration shows additive effect on survival prediction in high-grade serous ovarian carcinoma. Br. J. Cancer 2020, 122, 1803–1810.
- Kroeger, D.R.; Milne, K.; Nelson, B.H. Tumor-Infiltrating Plasma Cells Are Associated with Tertiary Lymphoid Structures, Cytolytic T-Cell Responses, and Superior Prognosis in Ovarian Cancer. Clin. Cancer Res. 2016, 22, 3005–3015.
- Webb, J.R.; Milne, K.; Kroeger, D.R.; Nelson, B.H. PD-L1 expression is associated with tumor-infiltrating T cells and favorable prognosis in high-grade serous ovarian cancer. Gynecol. Oncol. 2016, 141, 293–302.
- Komdeur, F.L.; Wouters, M.C.; Workel, H.H.; Tijans, A.M.; Terwindt, A.L.; Brunekreeft, K.L.; Plat, A.; Klip, H.G.; Eggink, F.A.; Leffers, N.; et al. CD103+ intraepithelial T cells in high-grade serous ovarian cancer are phenotypically diverse TCRαβ+ CD8αβ+ T cells that can be targeted for cancer immunotherapy. Oncotarget 2016, 7, 75130–75144.
- Stanske, M.; Wienert, S.; Castillo-Tong, D.C.; Kreuzinger, C.; Vergote, I.; Lambrechts, S.; Gabra, H.; Gourley, C.; Ganapathi, R.N.; Kolaschinski, I.; et al. Dynamics of the Intratumoral Immune Response during Progression of High-Grade Serous Ovarian Cancer. Neoplasia 2018, 20, 280–288.
- Carstens, J.L.; Correa de Sampaio, P.; Yang, D.; Barua, S.; Wang, H.; Rao, A.; Allison, J.P.; LeBleu, V.S.; Kalluri, R. Spatial computation of intratumoral T cells correlates with survival of patients with pancreatic cancer. Nat. Commun. 2017, 8, 15095.
- Balachandran, V.P.; Łuksza, M.; Zhao, J.N.; Makarov, V.; Moral, J.A.; Remark, R.; Herbst, B.; Askan, G.; Bhanot, U.; Senbabaoglu, Y.; et al. Identification of unique neoantigen qualities in long-term survivors of pancreatic cancer. Nature 2017, 551, 512–516.
- Castino, G.F.; Cortese, N.; Capretti, G.; Serio, S.; Di Caro, G.; Mineri, R.; Magrini, E.; Grizzi, F.; Cappello, P.; Novelli, F.; et al. Spatial distribution of B cells predicts prognosis in human pancreatic adenocarcinoma. Oncoimmunology 2016, 5, e1085147.
- Danilova, L.; Ho, W.J.; Zhu, Q.; Vithayathil, T.; De Jesus-Acosta, A.; Azad, N.S.; Laheru, D.A.; Fertig, E.J.; Anders, R.; Jaffee, E.M.; et al. Programmed Cell Death Ligand-1 (PD-L1) and CD8 Expression Profiling Identify an Immunologic Subtype of Pancreatic Ductal Adenocarcinomas with Favorable Survival. Cancer Immunol. Res. 2019, 7, 886–895.
- Hou, Y.C.; Chao, Y.J.; Hsieh, M.H.; Tung, H.L.; Wang, H.C.; Shan, Y.S. Low CD8⁺ T Cell Infiltration and High PD-L1 Expression Are Associated with Level of CD44⁺/CD133⁺ Cancer Stem Cells and Predict an Unfavorable Prognosis in Pancreatic Cancer. Cancers 2019, 11, 541.
- Ino, Y.; Oguro, S.; Yamazaki-Itoh, R.; Hori, S.; Shimada, K.; Hiraoka, N. Reliable evaluation of tumor-infiltrating lymphocytes in pancreatic cancer tissue biopsies. Oncotarget 2019, 10, 1149–1159.
- Miksch, R.C.; Schoenberg, M.B.; Weniger, M.; Bösch, F.; Ormanns, S.; Mayer, B.; Werner, J.; Bazhin, A.V.; D’Haese, J.G. Prognostic Impact of Tumor-Infiltrating Lymphocytes and Neutrophils on Survival of Patients with Upfront Resection of Pancreatic Cancer. Cancers 2019, 11, 39.
- Tahkola, K.; Leppänen, J.; Ahtiainen, M.; Väyrynen, J.; Haapasaari, K.M.; Karttunen, T.; Kellokumpu, I.; Helminen, O.; Böhm, J. Immune cell score in pancreatic cancer-comparison of hotspot and whole-section techniques. Virchows Arch. 2019, 474, 691–699.
- Gannon, P.O.; Poisson, A.O.; Delvoye, N.; Lapointe, R.; Mes-Masson, A.M.; Saad, F. Characterization of the intra-prostatic immune cell infiltration in androgen-deprived prostate cancer patients. J. Immunol. Methods 2009, 348, 9–17.
- Woo, J.R.; Liss, M.A.; Muldong, M.T.; Palazzi, K.; Strasner, A.; Ammirante, M.; Varki, N.; Shabaik, A.; Howell, S.; Kane, C.J.; et al. Tumor infiltrating B-cells are increased in prostate cancer tissue. J. Transl. Med. 2014, 12, 30.
- Kaur, H.B.; Guedes, L.B.; Lu, J.; Maldonado, L.; Reitz, L.; Barber, J.R.; De Marzo, A.M.; Tosoian, J.J.; Tomlins, S.A.; Schaeffer, E.M.; et al. Association of tumor-infiltrating T-cell density with molecular subtype, racial ancestry and clinical outcomes in prostate cancer. Mod. Pathol. 2018, 31, 1539–1552.
- Giraldo, N.A.; Becht, E.; Pagès, F.; Skliris, G.; Verkarre, V.; Vano, Y.; Mejean, A.; Saint-Aubert, N.; Lacroix, L.; Natario, I.; et al. Orchestration and Prognostic Significance of Immune Checkpoints in the Microenvironment of Primary and Metastatic Renal Cell Cancer. Clin. Cancer Res. 2015, 21, 3031–3040.
- Wang, M.; Zhao, J.; Zhang, L.; Wei, F.; Lian, Y.; Wu, Y.; Gong, Z.; Zhang, S.; Zhou, J.; Cao, K.; et al. Role of tumor microenvironment in tumorigenesis. J. Cancer 2017, 8, 761–773.
- Winter, J.; Kneitz, H.; Bröcker, E.B. Blood vessel density in Basal cell carcinomas and benign trichogenic tumors as a marker for differential diagnosis in dermatopathology. J. Skin Cancer 2011, 2011, 241382.
- Jain, R.K. Antiangiogenesis strategies revisited: From starving tumors to alleviating hypoxia. Cancer Cell 2014, 26, 605–622.
- Lugano, R.; Ramachandran, M.; Dimberg, A. Tumor angiogenesis: Causes, consequences, challenges and opportunities. Cell. Mol. Life Sci. CMLS 2020, 77, 1745–1770.
- Tolaney, S.M.; Boucher, Y.; Duda, D.G.; Martin, J.D.; Seano, G.; Ancukiewicz, M.; Barry, W.T.; Goel, S.; Lahdenrata, J.; Isakoff, S.J.; et al. Role of vascular density and normalization in response to neoadjuvant bevacizumab and chemotherapy in breast cancer patients. Proc. Natl. Acad. Sci. USA 2015, 112, 14325–14330.
- Iakovlev, V.V.; Gabril, M.; Dubinski, W.; Scorilas, A.; Youssef, Y.M.; Faragalla, H.; Kovacs, K.; Rotondo, F.; Metias, S.; Arsanious, A.; et al. Microvascular density as an independent predictor of clinical outcome in renal cell carcinoma: An automated image analysis study. Lab. Investig. 2012, 92, 46–56.
- Niemiec, J.; Sas-Korczynska, B.; Harazin-Lechowska, A.; Martynow, D.; Adamczyk, A. Lymphatic and Blood Vessels in Male Breast Cancer. Anticancer Res. 2015, 35, 1041–1048.
- Mohammed, Z.M.A.; Orange, C.; McMillan, D.C.; Mallon, E.; Doughty, J.C.; Edwards, J.; Going, J.J. Comparison of visual and automated assessment of microvessel density and their impact on outcome in primary operable invasive ductal breast cancer. Hum. Pathol. 2013, 44, 1688–1695.
- Haisan, A.; Rogojanu, R.; Croitoru, C.; Jitaru, D.; Tarniceriu, C.; Danciu, M.; Carasevici, E. Digital microscopy assessment of angiogenesis in different breast cancer compartments. BioMed Res. Int. 2013, 2013, 286902.
- Entenberg, D.; Oktay, M.H.; D’Alfonso, T.; Ginter, P.S.; Robinson, B.D.; Xue, X.; Rohan, T.E.; Sparano, J.A.; Jones, J.G.; Condeelis, J.S. Validation of an Automated Quantitative Digital Pathology Approach for Scoring TMEM: A Prognostic Biomarker for Metastasis. Cancers 2020, 12, 846.
- Den Uil, S.H.; van den Broek, E.; Coupé, V.M.H.; Vellinga, T.T.; Delis-van Diemen, P.M.; Bril, H.; Belt, E.J.T.; Kranenburg, O.; Stockmann, H.B.A.C.; Belien, J.A.M.; et al. Prognostic value of microvessel density in stage II and III colon cancer patients: A retrospective cohort study. BMC Gastroenterol. 2019, 19, 146.
- Buchberger, E.; Payrhuber, D.; El Harchi, M.; Zagrapan, B.; Scheuba, K.; Zommer, A.; Bugyik, E.; Dome, B.; Kral, J.B.; Schrottmaier, W.C.; et al. Inhibition of the transcriptional repressor complex Bcl-6/BCoR induces endothelial sprouting but does not promote tumor growth. Oncotarget 2017, 8, 552–564.
- Tzeng, H.T.; Tsai, C.H.; Yen, Y.T.; Cheng, H.C.; Chen, Y.C.; Pu, S.W.; Wang, Y.S.; Shan, Y.S.; Tseng, Y.L.; Su, W.C.; et al. Dysregulation of Rab37-Mediated Cross-talk between Cancer Cells and Endothelial Cells via Thrombospondin-1 Promotes Tumor Neovasculature and Metastasis. Clin. Cancer Res. 2017, 23, 2335–2345.
- Kather, J.N.; Marx, A.; Reyes-Aldasoro, C.C.; Schad, L.R.; Zöllner, F.G.; Weis, C.A. Continuous representation of tumor microvessel density and detection of angiogenic hotspots in histological whole-slide images. Oncotarget 2015, 6, 19163–19176.
- Marinaccio, C.; Giudice, G.; Nacchiero, E.; Robusto, F.; Opinto, G.; Lastilla, G.; Maiorano, E.; Ribatti, D. Interval sentinel lymph nodes in melanoma: A digital pathology analysis of Ki67 expression and microvascular density. Clin. Exp. Med. 2016, 16, 383–389.
- Di Maggio, F.; Arumugam, P.; Delvecchio, F.R.; Batista, S.; Lechertier, T.; Hodivala-Dilke, K.; Kocher, H.M. Pancreatic stellate cells regulate blood vessel density in the stroma of pancreatic ductal adenocarcinoma. Pancreatology 2016, 16, 995–1004.
- Schraml, P.; Athelogou, M.; Hermanns, T.; Huss, R.; Moch, H. Specific immune cell and lymphatic vessel signatures identified by image analysis in renal cancer. Mod. Pathol. 2019, 32, 1042–1052.
- Arimoto, A.; Uehara, K.; Tsuzuki, T.; Aiba, T.; Ebata, T.; Nagino, M. Role of bevacizumab in neoadjuvant chemotherapy and its influence on microvessel density in rectal cancer. Int. J. Clin. Oncol. 2015, 20, 935–942.
- Lee, S.Y.; Chao-Nan, Q.; Seng, O.A.; Peiyi, C.; Bernice, W.H.M.; Swe, M.S.; Chii, W.J.; Jacqueline, H.S.G.; Chee, S.K. Changes in specialized blood vessels in lymph nodes and their role in cancer metastasis. J. Transl. Med. 2012, 10, 206.