The controversy between the performance of public and private ownership of water and wastewater services is common worldwide. In most cases, this discussion is biased due to ideological issues or insufficiency or inconsistency of information. This study aims to compare the performance of private water utilities with that of public water utilities, using rich, robust, and audited information from Portuguese operators. The benchmarking exercise focuses on three distinct areas, namely, the efficiency and effectiveness of the investments made, the quality of service provided, and the tariffs and prices implemented. From the analysis performed, it is concluded that, on average, the performance of private water utilities exceeds that of public water utilities, and prejudice in most cases is unjustified regarding private ownership. Anyway, water, as an essential service, should always be provided, regardless of utility ownership.
- water services
- public and private ownership
- value for money
Performance of the Public and Private Sectors
Overview
In Portugal, the provision of these services may be the responsibility of different operators, with either public or private ownership. However, there is the biased idea that water services are always very profitable activities and their provision by private entities is achieved with lower quality and performance and with excessive profits [1][2].
This idea that prevails in Portuguese society and internationally has no substantive basis. Performance studies and analyses (including, for example, studies promoted by the regulator itself) do not conclude that the performance of private operators is lower, but quite the contrary [3][4].
In a recent audit, the TC raised a number of issues that had consequences for the image and credibility of the private management model in Portugal, although criticism was not the intention, since the issues were not different from those that were addressed in other audits of public entities. In spite of that, at no time does the TC state that private management should not be implemented or that it shows a worse performance than public management [5].
Hence, the aim of this article was to test the three hypotheses or perspectives that were mentioned in the introduction concerning effectiveness of investments (H1), quality of service provided (H2), and tariffs adopted (H3). This was done in the clearest possible way while using information based on the RASARP published by ERSAR [6]. In some cases, and to analyze the most updated information, the most recent accounts reports of the operators and other complementary information were also examined. Therefore, the performance comparison of the sample of private companies with those of different management models using statistical analysis provides evidence of the most efficient management model. The three different hypotheses for diverse perspectives (investments, quality of service, and tariffs) aim to avoid and counterweight that a good performance in a particular perspective can be compensated by the lower or higher performance in other perspective, for example, a higher level of quality of service and a higher tariff.
Analysis of the Investments Made (H1)
Stakeholders, in general, see private companies as investing poorly, often overvaluing the estimates of investments or making investments that are not useful in an attempt to take advantage of their implementation, given that some of the companies belong (or belonged) to or have preferential relations with the construction industry [7].
These arguments do not get much support, since all investments are approved by the holder (municipality) and are subject to the opinion of the regulatory agency, in addition to the fact that some of the companies see these investments in infrastructure as a cost. Besides, these companies are generally responsible for the operation and maintenance of investments, and the investments made must be efficient and effective.
Thus, hypothesis or perspective 1 (H1) considers that the investments made by private operators show lower productivity than those that are made by public operators, denoting a greater waste of resources and a lower value for money. Accounting for this thesis, the effectiveness and efficiency of investments made both by the private and the public sectors were analyzed. Note that the analysis of investments was focused on the period between 2000 and 2013 (for PEAASAR I and II). Nevertheless, the main source of information refers to PENSAAR 2020 (pp 38 and 52), where the values of investment made in the WSS in the “retail” segment by both the private and public sectors are detailed, while assuming that this investment is continuous and that the invested amounts are constant in the period considered and with slightly different percentages for water supply (40%) and wastewater (60%). The size of the public and private sectors is also taken into account.
It is necessary to assess not only the amount spent, but also the evolution of the WSS level of coverage in order to analyze the effectiveness and efficiency of the investment made.
Despite the significant growth of the private sector in the water sector in Portugal, currently reaching approximately 20% of the population, the investment per inhabitant by the private sector seems to be significantly higher than that by the public sector, as shown in the following Table 1 and Table 2.
Table 1. Investments made and efficiency of investments in water service.
| Water (2000–2013) |
Investment (106 €) |
Expenditure by Increase in Coverage/Inhabitant (€/inhab.) |
|---|---|---|
| Private | 433,92 | 1.10325 |
| Public | 630,80 | 1.15398 |
Table 2. Investments made and efficiency of investments in wastewater service.
| Wastewater (2000–2013) |
Investment (106 €) |
Expenditure by Increase in Coverage/Inhabitant (€/inhab.) |
|---|---|---|
| Private | 650.88 | 763.08 |
| Public | 946.20 | 893.55 |
The analysis of Table 1 and Table 2 shows that although the private sector serves only approximately 20% of the population, it has a level of investment that is very close to that of the public sector. This analysis identified the values of 1085 M€ for the private sector and 1577 M€ for the public sector. This means that despite the lower population served, the private sector is able to achieve a relative weight of nearly 40% of the total investment made.
Thus, there appears to be greater effectiveness and efficiency in the accomplishment of investments in WSS by the private sector, while taking the lower expenditure made for an increase in coverage into account (€/inhabitant). Although this difference is significant, it would be much greater if European Union funding were considered, which, as pointed out, constituted the lion’s share of investments in the public sector and were virtually insignificant in the private sector.
The large investment made by private operators has been reflected, as expected, in an accelerated growth in their coverage over the period 2000–2013, with increases of 23%, 25%, and 27% in the level of coverage of water service, wastewater collection, and wastewater treatment, respectively.
The public sector, in turn, has lower WSS coverage growth values, which can also be explained, at least partially, by several factors, including the starting level, the capacity to make investment in the sector, and the type of investments made.
Regarding the starting level, in 2000, the average level of coverage of the public sector was already much higher than that observed in the private sector, instigated by the (almost total) public management in the metropolitan regions of Lisbon and Porto. This was also one of the reasons that justified the private sector participation in some municipalities with very low levels of coverage.
This might mean that, for the increase in coverage, investments may be higher (infrastructure in the most rural areas), and some of these investments may end up having another aim beyond increasing coverage (which includes the network optimization, etc.). Figure 1 illustrates the evolution of the investment made and the WSS coverage by management model in the period between 2000 and 2013.
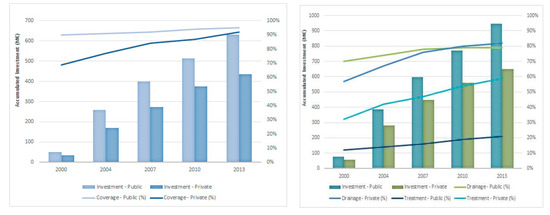
Figure 1. Evolution of water service coverage (left) and wastewater (right) and of the investments made.
While analyzing the figure mentioned, there is a much faster growth in the level of coverage by private operators than by public operators.
After examining the previous Table 1 and Table 2 and Figure 1 and with the abovementioned cautions, it seems possible to confirm the evidence that the private operators are, in fact, more effective and more efficient in carrying out investments in WSS, with lower expenditures per inhabitant and per percentage of increase in service coverage in both water and wastewater services. The savings of resources by the private sector, per inhabitant, as observed, are close to 5% for water services and 15% for wastewater services.
Thus, when considering the analysis of the investments made and their effects in increasing WSS coverage, it is possible to reject H1, given the evidence that private operators have been more effective and efficient in implementing planned investments than public sector operators.
Analysis of the Quality of Service (H2)
Another myth regarding the water sector in Portugal concerns the quality of service provided by private operators. It is commonly said that private companies aim for profit, meaning that the best way to increase or guarantee profit is by saving resources while reducing the quality of service provided. This assertion reveals some prejudice, and it is strongly ideological [8][9].
First, a poor or worse quality of service does not necessarily lead to lower expenses. Usually, what is observed is precisely the opposite, since the operational expenses (OPEX) increases (e.g., major bursts, interruptions, and water losses). Second, the regulatory agency regulates the quality of service, and the standards are established by contract, so performance is not exclusively a result of the choices of private managers, which are constrained by legal and contractual requirements.
Finally, what is suggested is precisely the opposite; that is, due to prejudice, political interference, and a preconceived public image, private companies have additional incentives to provide a high quality of service and, therefore, a better quality of service should be expected from these entities.
Thus, the assessment of hypothesis or perspective 2 (H2), which assumes that private operators provide a worse quality of service to customers than public operators, indicates that private operators may be motivated to reduce their operating and capital expenses and, thus, maximize their profits.
The analysis of this perspective was developed using a set of key performance indicators (KPIs) for the various WSS management models, comprising the different perspectives of services provision, such as the protection of users’ interests, the financial sustainability of the operator, and environmental sustainability.
The set of KPIs adopted fundamentally comprises the KPIs used by ERSAR, taking into account the reference values (benchmarks) that were recommended by that entity and the weighted averages. The sample includes all the mainland country, only excluding the islands (have a different regulator) and a couple of outliers. Table 3 below shows the selected KPIs.
Table 3. Quality of service assessment indicators.
| KPI | |
|---|---|
| Water | Wastewater |
| Physical accessibility (%) | Physical accessibility (%) |
| Reply to written suggestions and complaints (%) | Reply to written suggestions and complaints (%) |
| Mains failures (No./1.000 connections) | Flooding occurrences (No./1.000 connections) |
| Energy efficiency [kWh/(m3·100 m)] | Energy efficiency [kWh/(m3·100 m)] |
| Safe water (%) | Compliance with discharge parameters (%) |
| Non-revenue water (%) | |
| Water losses on mains [l/(km·h)] | |
Coverage Level
The coverage level, using the indicator of physical accessibility, aims to evaluate the population’s access to WSS through the total number of households connected. Figure 2 illustrates the evolution of the indicator between 2011 and 2015. The annual reports of ERSAR are the source for the data.
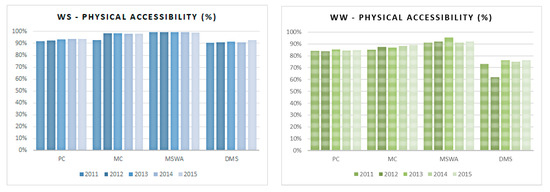
Figure 2. Evolution of coverage levels in water (left) and wastewater services (right).
As expected, the investment in coverage expansion in the rural environment does not have the same effect as that in urban areas. In this sense, ERSAR recommends different reference levels, depending on the features of the region (urban or rural). Thus, ERSAR considers that, in predominantly urban areas, operators must have a coverage level of at least 95% and that, in predominantly rural areas, they must have a coverage level of at least 80%, while for wastewater the values are 90% and 70%, respectively.
By analyzing Figure 2, it seems that there was a clear effort of all the operators to achieve the targets that were proposed by ERSAR, since nearly all of them, on average, obtained the classification of ’good’ in the indicator for water service, although some exceptions remain.
However, the focus is on the private sector, whose activity takes place mostly in rural areas (as compared to public operators) and ends up presenting a level of coverage that is very close to the reference level for predominantly urban areas (i.e., almost 95%). Thus, this seems to indicate a better performance of the private operators concerning the water services coverage level. The same scenario can be observed for wastewater, even though the results, in general, are worse for all operators.
Customer Service
Customer service is evaluated by means of the ERSAR’s indicator response to complaints and suggestions, which can be observed through the management of complaints and suggestions received and duly forwarded. Figure 3 illustrates the evolution of this indicator. Data are based on ERSAR’s annual reports (RASARP).
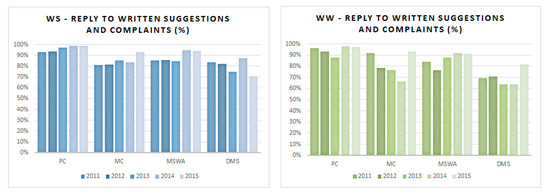
Figure 3. Customer service in water (left) and wastewater services (right).
Since these are essential public services, it is recommended that the users′ requirements and complaints are adequately treated. Therefore, a ’good’ performance level, according to ERSAR, is assigned when the operators respond to all of the complaints and suggestions from users in due time (i.e., 100% response). In turn, the average performance is assigned between 85% and 100%.
By analyzing Figure 3, it can be observed that no management model, on average, reaches the ’good’ level of performance. However, the private sector stands out as the only sector that, during the period under review, has always increased the quality of service and, in 2015, only three of the 29 operators did not achieve the “good” level of performance, showing higher concern for the issues and problems identified by its users.
Service Failures
Concerning water supply, service failures are evaluated by means of a KPI, whose aim is to assess the frequency of interruptions. Figure 4 shows the performance evolution of the various operators. ERSAR’s annual reports are the data source.
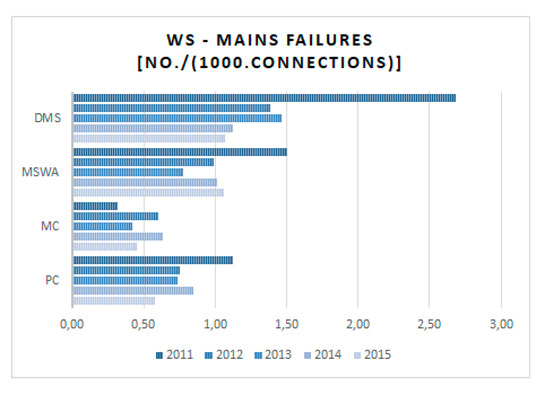
Figure 4. Evolution of water supply failures.
For this KPI, the reference level of ERSAR is the occurrence of one failure per 1000 connections, and the average performance is defined by the results that were achieved between 1 and 2.5 failures per 1000 connections. In this context, both private operators and MCs show good performance. However, the private sector once again stands out, as it mainly operates in rural areas. This is another sign of the quality of the operation and maintenance carried out by private operators and of the effectiveness of the investments made.
As far as wastewater service is concerned, the KPI relative to floods aims to evaluate the occurrence of floods originating in the drainage network. The ERSAR’s reference value for this KPI is that a maximum of 0.25 floods occur per year for every 1000 connections. In turn, the average performance is defined by the occurrence of floods between 0.25 and one per 1000 connections. Figure 5 illustrates the evolution of this indicator for the different operators. The annual reports of ERSAR are the source for the data.
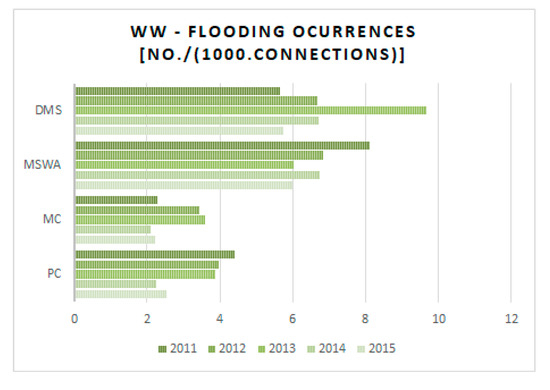
Figure 5. Evolution of floods in wastewater service.
It is observed that none of the management models, on average, are able to reach the level of performance considered to be satisfactory (by ERSAR), and this is a situation that, of course, should be reviewed and improved. Despite the negative performance of most operators, a generally positive evolution of private operators is noticeable, in contrast with the trend shown by the other operators. Moreover, the best results are achieved by the private sector alongside the MCs.
Energy Efficiency
Energy efficiency aims to assess the level of use of energy resources by operators, particularly the energy consumption that is necessary to pump water or wastewater. Figure 6 shows the performance evolution of the energy efficiency indicator.
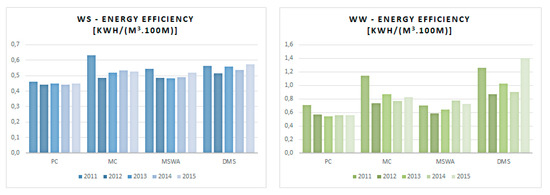
Figure 6. Evolution of energy efficiency in water (left) and wastewater services (right).
A good level of performance for this indicator in the water service, in accordance with ERSAR’s guidelines, is achieved when the operators are able to pump 1 m3 of water over 100 meters, consuming a maximum of 0.4 kWh of electricity (and a minimum of 0.27 kWh). In turn, the average performance level is determined by energy consumption between 0.4 and 0.54 kWh per m3 and per 100 meters head. For wastewater, the values are 0.45 and 0.45 and 0.68 kWh per m3 and per 100 meters head, respectively.
Figure 6 shows that the different operators, on average, are not able to achieve a “good” performance in this indicator. Additionally, private sector performance should be emphasized, because despite not achieving a “good” performance rating, on average, it has the best result among all management models. Data are based on ERSAR’s annual reports.
Non-Revenue Water
The non-revenue water indicator tries to reflect the level of financial and physical losses of water that enters into the system and that is not billed to customers. Figure 7 illustrates the evolution of the indicator for non-revenue water by the various management models.
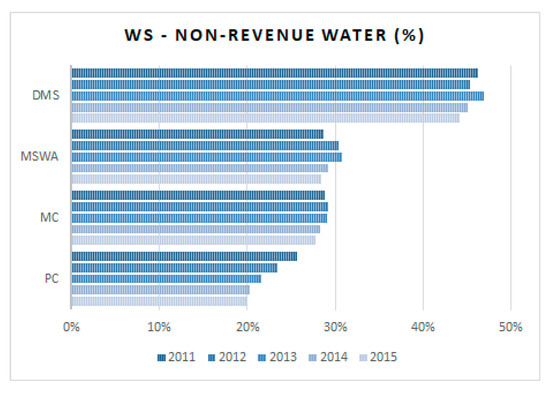
Figure 7. Evolution of non-revenue water.
The reference value for “good” performance is up to 20% for non-revenue water, while the average performance corresponds to results between 20 and 30%, according to ERSAR.
As Figure 7 shows, no management model achieves “good” performance. With the exception of DMS, all other models have satisfactory efficiency. The annual reports of ERSAR are the source for the data.
However, the results accomplished by the private sector must be underlined. In addition to a very positive evolution over the period analyzed between 2011 and 2015, the private sector achieved a much higher performance than the other management models, being close to the threshold of good performance set by e ERSAR. While private operators, on average, reached a level of 20.2% of non-revenue water in 2015, MCs accomplished approximately 27.7%, MSWA 28.4%, and DMS 44.2%.
Network Losses
Water losses in the network can be considered to be a KPI that is complementary to the non-revenue water indicator.
Figure 8 illustrates the evolution of water losses in the network per management model.
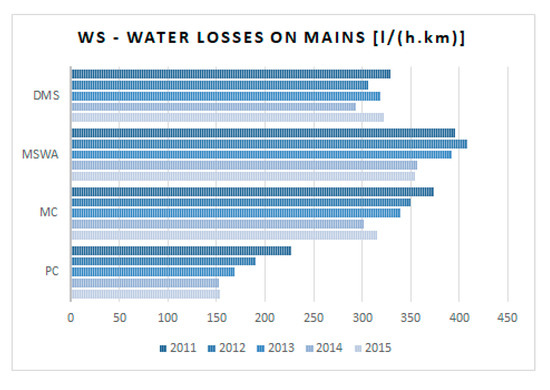
Figure 8. Evolution of water losses in the network.
Although without reference in the ERSAR’s quality of service regulation model, this KPI shows, once again, good performance for private operators, being far ahead of the other operators. Data are based on ERSAR’s annual reports.
Water Quality
The water quality KPI intends to assess whether the water that is supplied to customers complies with all the legal requirements, including those that are defined by ERSAR. Figure 9, below, illustrates the evolution of the water quality indicator.
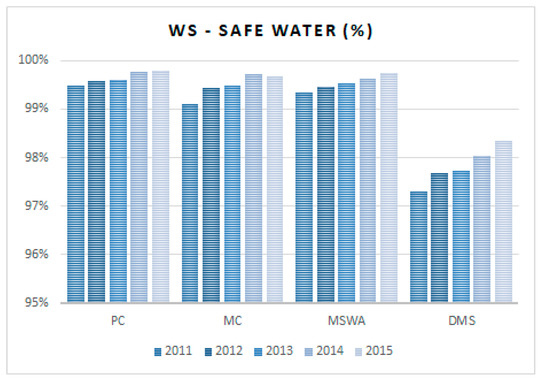
Figure 9. Evolution of the safe water indicator.
The reference value corresponds to results equal to or greater than 98.5%, according to ERSAR. The average performance is set for water quality compliance levels that are equal to or greater than 94.5 and below 98.5%.
The various management models (except for DMS) had a “good” water quality performance and highlighted a very positive evolution, as Figure 9 shows. However, the private sector must be underlined, as it has been providing good water quality since 2011, achieving the best results among the different management models. Data are based on ERSAR’s annual reports.
Compliance with Discharge Parameters
The KPI of compliance with discharge parameters is associated with wastewater treatment and destination and, therefore, with compliance with the legal parameters of discharge. Figure 10, below, illustrates the evolution of this indicator for the various management models. The annual reports of ERSAR are the source for the data.
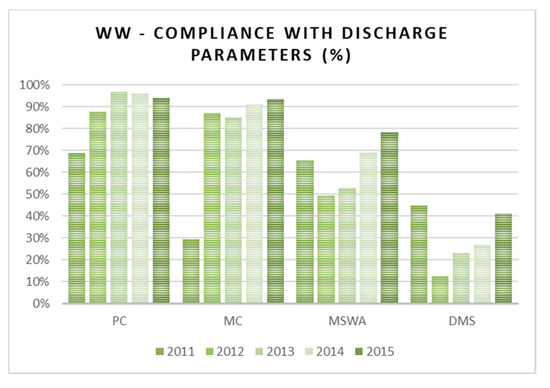
Figure 10. Evolution of compliance with the legal discharge parameters.
The reference level of this indicator corresponds to full compliance with the legal parameters of wastewater discharge (i.e., 100%), according to ERSAR. The average reference corresponds to performance levels between 95 and 100% compliance.
Analyzing the previous figure, it is observed that private management model and MCs have shown a much better evolution than direct management models (DMS and MSWA). The private sector stands out, once again, with the best result regarding compliance with the discharge parameters, being the only management model that achieves an average level of performance. This circumstance might highlight the best practices of operation and maintenance of private management.
In short, H2 considered that private operators would provide a worse quality of service than public operators, with regard to both water and wastewater services. This could perhaps be motivated by their lower expenses, allowing for them to maximize their profits.
However, after detailed analysis of the set of KPIs, it is possible to conclude that the private sector achieves the best results in eight of the 12 KPIs considered and it is in line with the other management models concerning the remaining KPIs.
For the reasons given above, it is possible to categorically refute H2 that private operators provide a worse quality of service than public operators, since they represent the management model that, overall, shows the best performance.
Analysis of the Prices and Tariffs Implemented (H3)
Finally, it should also be noted that there is a preconceived idea in society and among water sector stakeholders that the tariffs put into practice by private operators are higher than those that were implemented by their public counterparts and that private operators are mostly profit-oriented [2][10].
However, while private operator tariffs in some cases may be higher than those of public operators, when they are, generally they are not associated with excessive profits but reflect compliance with the contractual obligations, which often are disproportionate to the economic, financial, and even social reality of WSS.
High rents or even investment plans with significant amounts and without European Community funding have to be recovered by means of tariffs, which inevitably imply a tariff increase. Additionally, the need to depreciate investments in the concession term when public operators can do so in longer periods leads to higher costs, which is particularly penalizing in large WSS works with high investments (e.g., dams).
Moreover, the option for private partnership in most situations does not arise due to the benefit of the option, but rather due to the so-called scissors effect, related to the existence of very serious problems (e.g., very indebted municipalities, rural systems, low coverage, or very poor technical conditions requiring large investments). Contrarily, in other countries, the private sector participation takes place in urban areas and when the systems are new and in good technical conditions, meaning that they are very profitable which is not the typical case in Portugal.
The last hypothesis or perspective to be tested, hypothesis 3 (H3), presupposes that private operators apply higher tariffs than public operators, thereby maximizing their profits.
At this stage, the aim is to analyze the financial performance of the different operators through the average tariff and the associated cost recovery.
Cost Coverage
The cost coverage KPI aims to assess the level of financial sustainability of operators by covering the total costs. Figure 11 illustrates the evolution of this indicator.
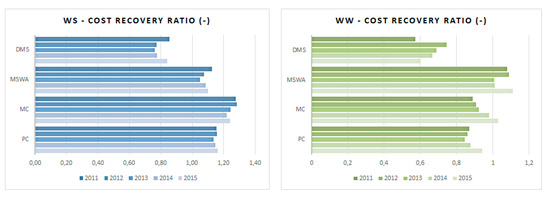
Figure 11. Evolution of cost coverage in water (left) and wastewater services (right).
The KPI of cost coverage for both water supply and wastewater, according to ERSAR’s guidelines, presents reference values between 1.0 and 1.1, which means a level of profitability between 0% and 10%. In turn, the average performance level corresponds to the results between 0.9 and 1.0 and between 1.1 and 1.2, thus penalizing both the overvaluation and undervaluation of tariffs. Performance at other values is considered to be unsatisfactory by ERSAR. The source for the data is the annual reports of ERSAR.
Figure 11 seems to show that private sector operators have robust financial sustainability and a relatively adjusted level of cost coverage in water service, although slightly above the reference value. On the one hand, the level of excessive profitability of MCs and, on the other hand, the under-profitability of the DMSs in terms of financial performance and cost recovery, must also be stressed. It is observed that the majority of wastewater operators are in deficit, a situation that might be explained by the fact that this activity is subsidized by the water service.
It is observed that private operators’ performance is overall good if subsidization between services is considered and the joint cost coverage in the WSS is analyzed, according to ERSAR’s guidelines. In contrast, the DMSs’ poor performance emphasizes the fragile economic situation as a consequence of putting “political prices” in practice.
Tariffs in Force
The tariffs of operators are closely linked to their economic and financial sustainability, so tariff levels should never be analyzed by themselves, but the factors determining the prices charged should also be considered, such as operating costs (e.g., water production costs) and capital costs (investments, etc.), or, when private sector participation exists, rents paid to municipalities and financing needs.
Table 4 shows the average monthly charges by management model. DMSs that did not recover at least 80% of the total costs were not considered. Data are based on ERSAR’s annual reports.
Table 4. Average monthly WSS household charges.
| Average Charges (10 m3) | Water (€) | Wastewater (€) | Total (€) |
|---|---|---|---|
| Private Operator | 12.84 | 8.67 | 21.51 |
| MC | 10.78 | 10.26 | 21.04 |
| MSWA | 11.72 | 9.24 | 20.96 |
| DMS | 9.61 | 7.28 | 16.90 |
The average charges were computed when considering an average household consumption of 10 m3 of water per month. When observing the table, the first analysis gives the idea that private operators actually apply higher tariffs than other operators. However, it emphasizes an “apples with oranges” comparison, since there are some requirements that the private sector is obliged to assume (taxes, rent payments, depreciation rules, …) and respect, which, of course, are reflected in the final price charged to users.
Concerning the investment obligations of private operators, if they were able to finance themselves mainly using European Community funds, as is the case with public operators, they would have a margin for reducing the tariffs by approximately € 0.15/m3 (taking the financial statements of the different concessionaires into account).
Additionally, if the rents paid to the municipalities by many concessionaires were removed, there would be savings of € 0.19/m3 (as saved by public operators).
Table 5 below shows the potential average monthly WSS charge if the amounts private operators pay in rents were transformed into a discount in the tariff and if the investments were subsidized, as they are for public operators. The annual reports of ERSAR and the financial statements of the operators are the source for the data.
Table 5. Average monthly WSS charges removing the rent and investment subsidy effects.
| Average Charges (10 m3) | Total (€) |
|---|---|
| Private Operator | 18.11 |
| MC | 21.04 |
| MSWA | 20.96 |
| DMS | 16.90 |
Thus, after updating tariffs by removing the impact of rent and subsidy, it is observed that private operators seem to be able to implement a lower tariff than MCs and MSWAs. Note that, even when removing these two fundamental aspects of WSS costs, there are still other costs that the private sector redistributes to the public interest and that are not counted here, for example, those that are included in the tax burden that in public management models do not exist or are less penalizing (e.g., income tax).
To sum up, H3 presupposes that private operators apply higher tariffs than public operators, thereby maximizing their profits. After an analysis to the costs of the different management models, by removing the exogenous particularities of private management for the comparison between the various models to be fair and possible to perform, the private operators, on average, seem to implement lower or, at least, reasonable tariffs, and they could pose lower charges to customers if they enjoyed the same conditions, so H3 can also and should be refuted.
Finally, it should be emphasized that these results are naturally related not to the fact that private operators do not seek and do not enjoy profits, but to the fact that they are more efficient and productive and they provide more value for money for the WSS.
Discussion
The comparison of the various management models and the performance evaluation of the private sector in WSS provision was achieved through the formulation of three hypotheses or perspectives (H1, H2, and H3) corresponding to the main ’myths’ about the performance of the private ownership of the WSS in Portugal. Thus, this analysis provides some contributions to elucidate the most skeptical and dismiss uncertainties related to three key issues: the effectiveness and efficiency of the investments made, the level of quality of service provided, and the tariffs implemented.
Regarding the investment made in the “retail” system, the private sector seems to show better performance, both in water and wastewater services, and it uses less financial resources per new inhabitant served. While the private sector takes total responsibility for the investments made, the public sector mainly uses European Community funds, which encourages the private sector to seek greater efficiency and effectiveness.
Concerning the quality of service, it is observed that private operators seem to perform better in most of the indicators adopted in the analysis, obtaining better scores than the other management models in eight of the 12 KPIs studied. When considering the four KPIs in which the private sector does not obtain the best results, the sector shows an average performance in line with that of the other management models.
With regard to the tariffs, although private operators apply higher tariffs due to the stricter requirements that they have to comply with, in particular the rents paid and the lack of subsidization of investments, they actually seem to perform better in terms of tariff balance.
In summary, the three hypotheses were rejected based on the results of the analyses performed for WSS in Portugal. More than estimating whether private management is more efficient than public management or vice versa, this study helps to dismiss the ’myths’ and ’dogmas’ that exist in the water sector in Portugal and in other countries, which, due to a set of circumstances, have persisted without coherent justification. It is believed that, for the sustainable development of the water sector in any country, all of the management models can be relevant and make their contributions, and viable and credible options should not be ruled out.
Conclusions
This article aims to demystify some ideas and concepts that have proliferated and become consolidated in society and among water sector stakeholders, namely, the principle that WSS private operators cannot efficiently and effectively provide services at reasonable prices [11]. Therefore, this study looked at central issues, such as investments made for the expansion and modernization of WSS (H1), the quality of service provided (2), and the tariffs charged to ensure sustainability services (H3).
In view of the hypotheses listed, the data seem to show that private operators in Portugal are more efficient and effective in making investments (H1), provide a better quality of service (H2), and, under similar conditions, offer tariffs that are more reasonable (H3).
Thus, it is concluded that the private sector is an important stakeholder in the Portuguese water sector, complementing the role of the public sector. It has also served as a lever of the water sector in Portugal, through effectively implementing planned investments, increasing WSS access, and transferring know-how to the public sector, either through shareholder participation in municipal companies or through the concession model. Before the 1990’s, when the participation of private sector was not possible, the performance of the Portuguese water sector was rather poor; however, with the water reforms in 1993 and the following that allowed private sector participation and considerably enhanced the market structure and the rules of the game, the improvement of the main indicators, both physical and quality (access and drinking and water resources quality) and operational indicators (e.g., water losses) of the sector was substantial [12].
Finally, although, in theoretical terms, the option of private management has advantages when compared to public management in the current context, and despite the requirements of WSS functioning, there are very good private operators, but also others that are less competent, just as there are good public operators and those with a mediocre performance. Moreover, the particular operational environment of the WSS does matter and it can make the difference. In this article, besides having removed the outliers, the average performance of the samples was compared, so that the particular effect of the WSS characteristics will probably be mitigated and the existing bias will not alter the results trend. However, diverse WSS characteristics can indeed result in different performance and the best conditions for private and public ownership are still an open question.
Thus, it is very important for the WSS in Portugal and, globally, to be able to consider and even expand private sector participation. However, for this to be possible, it is necessary to reveal and dispel the bias that exists in society and among the sector stakeholders that private companies are always malicious and only focused on profit, providing WSS with poor quality of service. This study intended to address this misconception and contribute to a balanced perspective to this area.
This entry is adapted from the peer-reviewed paper 10.3390/w12051477
References
- Okke Braadbaart; Private versus public provision of water services: does ownership matter for utility efficiency?. Journal of Water Supply: Research and Technology-Aqua 2002, 51, 375-388, 10.2166/aqua.2002.0034.
- Pérard, E; Water supply: Public or private? An approach based on cost of funds, transaction costs, efficiency and political costs. Policy Soc. 2009, 27, 193–219, .
- Pedro M. S. Carvalho; Rui Cunha Marques; Sanford V. Berg; A meta-regression analysis of benchmarking studies on water utilities market structure. Utilities Policy 2012, 21, 40-49, 10.1016/j.jup.2011.12.005.
- Vilanova, M.; Balestieri, P; Does public or private ownership defines the performance of water supply systems. Evid. Literature. Rev. Bras. De Gestão E Desenvolv. Reg. 2014, 10, 138, .
- TC. Regulação de PPP no Sector das Águas; Relatório no. 3–2 Secção; Tribunal de Contas: Lisbon, Portugal, 2014.
- RASARP. Relatório Anual dos Serviços de Águas e Resíduos em Portugal; Entidade Reguladora de Serviços de Águas e Resíduos (ERSAR): Lisbon, Portugal, 2017.
- Naren Prasad; Privatisation Results: Private Sector Participation in Water Services After 15 Years. Development Policy Review 2006, 24, 669-692, 10.1111/j.1467-7679.2006.00353.x.
- Marin, P. Public-Private Partnerships for Urban Water Utilities. Public-Priv. Partnersh. Urban Water Util. 2009.
- Odeh R. Al-Jayyousi; Scenarios for Public-Private Partnerships in Water Management: A Case Study from Jordan. International Journal of Water Resources Development 2003, 19, 185-201, 10.1080/0790062032000089310.
- Simon Porcher; The ‘hidden costs’ of water provision: New evidence from the relationship between contracting-out and price in French water public services. Util. Policy 2017, 48, 166–175, .
- Comair, F. Private public partnership in the water sector-ESCWA Region. In Proceedings in Seminar on Water Governance: Role of Stakeholders; UN: Beirut, Lebanon, 2005.
- Baptista, J. Lessons learnt from the water reforms in Portugal; Presentation in the visit organized for the Bahamas Water and Sewerage Corporation; LisWater and LNEC: Lisbon, Portigal, 2019.