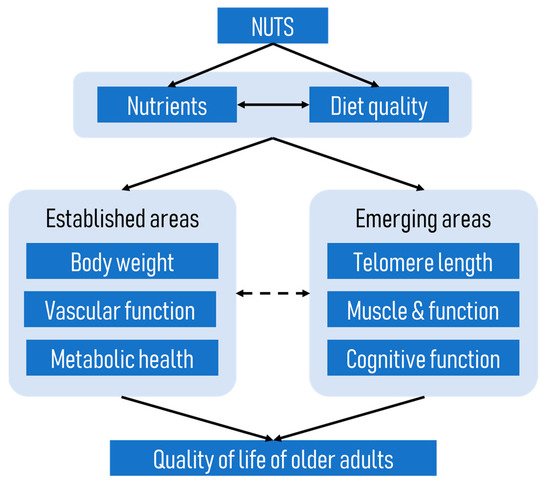
Although the beneficial effects of nuts on cardiometabolic diseases have been well established, little is known about the effects of nuts on age-related diseases. Given that age-related diseases share many biological pathways with cardiometabolic diseases, it is plausible that diets rich in nuts might be beneficial in ameliorating age-related conditions. Overall, the currently available evidence suggests that nut consumption, particularly when consumed as part of a healthy diet or over a prolonged period, is associated with positive outcomes such as longer telomere length, reduced risk of sarcopenia, and better cognition in older adults.
- nuts
- older adults
- quality of life
- diet quality
1. Background
2. Nut Consumption and Telomere Length
2.1. Evidence from Observational Studies
2.1.1. Nut-Specific Studies
2.1.2. Studies on Dietary Patterns That Include Nuts
| Author, Year | Study Design | Study Participants | Dietary Assessment Method | Dietary Patterns Assessed | Measure of Telomere | Outcomes |
|---|---|---|---|---|---|---|
| Boccardi, 2013 (Italy) | Cross-sectional | n = 217 elderly Caucasians (n = 115 men, n = 102 women); age range: 81–87 years, mean 78.0 ± 2.7 years | Dietary questionnaire | Mediterranean Diet Score (MDS) (Trichopoulou 2003) | Leukocyte telomere length and telomerase activity PBL/qPCR (Cawthon, 2002) | Greater adherence to MDS associated with longer LTL (p = 0.003) and higher telomerase activity (p = 0.013), and remained significant after adjustment. Every year increase in age LTL decreased by 0.072 Kb, 0.057 Kb, and 0.051 Kb in low, medium, and high adherence respectively (p = 0.001). |
| Crous-Bou, 2014 (USA) | Cross-sectional from the Nurses’ Health Study | n = 4676 females; age range: 42–70 years, mean 59 ± 6.6 years | Semi-quantitative FFQ | Alternative Mediterranean Diet Score (AMDS) (Trichopoulou 2003) | Leukocyte telomere length PBL/qPCR (Cawthon, 2002) | Greater adherence to the AMDS was associated with LTL z-score (p for trend = 0.02 (without adjustment); and p for trend = 0.004 after adjustment). No independent association with nut consumption (p for trend = 0.24). |
| Garcia-Calzon, 2016 (Spain) | Cross-sectional analysis of the PREDIMED-NAVARRA trial | n = 520 (n = 234 male, n = 286 female) at high risk of CVD; age range 60–80 years females, 55–80 years males; mean age 67 ± 6.0 years | FFQ and 14-item questionnaire to evaluate adherence to Mediterranean dietary pattern | Mediterranean diet adherence score (MedDiet) | Leukocyte telomere length PBL/qPCR (Cawthon, 2002) | Higher adherence to MedDiet was associated with greater age-adjusted z-score LTL) and a lower risk of having short telomeres in women, but not men. Nut intake was not associated with LTL. |
| Gu, 2015 (USA) | Cross-sectional | n = 1743, aged ≥65 years; n = 506 white, n = 536 African American, n = 679 Hispanic, n = 22 other | Semi-quantitative FFQ | Mediterranean Diet Score | Leukocyte telomere length PBL/qPCR (Cawthon, 2009) | No association overall between MDS and telomere length. There was a positive association among Whites, 1 unit increase in MDS corresponds to 48 bp increase in LTL, but not African Americans or Hispanics. No association between nuts and telomere length. |
| Leung, 2018 (USA) | Cross-sectional analysis of NHANES 1999–2002 | n = 4758 (n = 2208 males, n = 2550 females), age range 20–75 years, mean age 39.5 years | Single 24 h recall | Healthy Eating Index 2010 scores (HEI-2010); Alternative Healthy Eating Index 2010 scores (AHEI-2010); Mediterranean Diet scores (MDS), Dietary Approaches to Stop Hypertension (DASH) score | LTL from whole blood (Cawthon, 2002) | Comparison of the top and bottom quintiles showed higher scores for all diet quality indices were associated with longer telomere length in women, but not men. |
| Meinilä, 2019 (Finland) | Cross-sectional and prospective (mean follow up period 9.9 y for females and 9.7 y for males) | n = 1046 (n = 456 men, n = 590 women); mean age 61 years | Semi-quantitative FFQ | Baltic Sea diet score (BSDS); modified Mediterranean diet score (mMed); Dietary Inflammation index (DII) | Leukocyte telomere length PBL/qPCR (Cawthon, 2009) | Adherence to the any of the 3 dietary indices was not associated with LTL in the cross-sectional analysis. In the prospective analysis adherence to mMed was associated with slightly higher rates of shortening in women (largely driven by the fruit and nut food component)—this was not considered clinically important. |
| Milte, 2018 (Australia) | Cross-sectional | n = 679 (n = 330 men, n = 349), age range 55–65 years, mean age 62.7 years | FFQ | Dietary Guideline Index; Recommended Food Score; Mediterranean Diet Score (MDS) | LTL from whole blood (Cawthon, 2002) | There were no associations between any of the diet indices and LTL. |
| Ojeda-Rodriguez, 2019 (Spain) | Cross-sectional (SUN Project) | n = 886 (n = 645 males, n = 241 females), aged ≥55 years | Semi-quantitative FFQ | Prime Diet Quality Score (PDQS); Fat Quality Index (FQI); Alternative Healthy Eating Index 2010 scores (AHEI-2010); Mediterranean Diet Adherence Screener (MEDAS), Dietary Approaches to Stop Hypertension (DASH) | Salivary telomere length PBL/qPCR (Cawthon, 2009) | There were fewer participants with short telomeres in the top tertile for each diet quality index, specifically the PDQS, MEDAS and DASH in crude and adjusted models; and all indices for adjusted models. |
| Ventura Marra, 2019 (USA) | Cross-sectional | n = 96 (n = 41 men, n = 55 women), aged 45–60 years, with at least one risk factor for CVD | Three 24 h recalls for the HEI-2015 index and aMed; 24-item questionnaire for the DST | Healthy Eating Index 2015 (HEI-2015); alternative Mediterranean diet score (aMed); Dietary Screening Tool (DST) | LTL from whole blood (Cawthon, 2002) | There were no associations between the HEI-2015 or aMed and LTL. Those scoring “at risk” by the DST were more likely to have short LTL. |
| Chan, 2010 (Hong Kong) | Cross-sectional | n = 2006 (n = 976 men, n = 1030 females), aged ≥65 years | FFQ | Included food group nuts/legumes/seeds | LTL from whole blood (Cawthon, 2002) with modifications | No association between the nuts/legumes/seeds group and LTL. |
| Gong, 2017 (China) | Cross-sectional | n = 553 (n = 281 men, n = 272 women); mean age: 45.1 years men; 48.3 years women | FFQ | PCA was used to derive 4 dietary patterns: Vegetable-rich (higher in fruits, vegetables, whole grains, dairy products, nuts, eggs, tea); Macho; Traditional; High energy-density | Leukocyte telomere length (Zhao, 2009) | Only the Vegetable-rich dietary pattern was associated with longer TL in women, but not men. The longer length of 160 bp corresponded with a difference of 4 years of aging |
| Karimi, 2018 (Iran) | Cross-sectional | n = 300 men, aged 25–40 years | Semi-quantitative FFQ | PCA was used to derive 4 dietary patterns: healthy diet pattern, Western pattern, traditional pattern, vegetarian diet pattern. Nuts and seeds were examined as a food group | LTL from whole blood (Cawthon, 2002) | Nuts and seeds were negatively, but not statistically significantly, associated with LTL. |
| Lee, 2015 (Korea) | Prospective (10 y follow up) | n = 1958 (n = 1018 men, n = 940 women), age range 40–69 years baseline | Semi-quantitative FFQ | Factor analysis characterised a Prudent dietary pattern and a Western dietary pattern | LTL from whole blood (Cawthon, 2002) | The Prudent dietary pattern was positively associated with LTL. The Western diet was not associated with LTL. Nuts were one food component positively associated with LTL. |
| Nettleton, 2008 (USA) | Cross-sectional of the Multi-Ethnic Study of Atherosclerosis (MESA) study | n = 840 (n = 434 women, n = 406 men), n = 157 whites, n = 228 African Americans, n = 455 Hispanics), age range 45–84 years | Semi-quantitative FFQ | PCA was used to derive 2 dietary patterns: fats and processed meat; and whole grains and fruits (including nuts). Nuts or seeds were also analysed as a food group component. | LTL from whole blood (Cawthon, 2002) | No association between dietary pattern andLTL. The food group nuts or seeds was not associated with LTL. |
| Zhou, 2016 (China) | Cross-sectional | n = 556 (n = 213 males, n = 343 females), mean age early 50s | Semi-quantitative FFQ | Nuts and seeds food group was examined | Leukocyte telomere length PBL/qPCR (Cawthon 2009) | Intakes of nuts or seeds were highest among those in the upper tertile for telomere length. Intakes of nuts and seeds were positively associated with telomere length. |
Studies Using a Mediterranean Diet Quality Score
Studies Using Other Diet Quality Scores
Posteriori Dietary Patterns
Studies on Food Group Including Nuts
2.1.3. Summary of Studies on Dietary Quality and Patterns
2.2. Evidence from Interventional Studies
2.2.1. Nut-Specific Studies
2.2.2. Studies on Dietary Patterns That Include Nuts
2.3. Summary
3. Nut Consumption and Sarcopenia and Related Factors
| Author (Year) Study Location |
Study Design | Study Participants | Dietary Assessment Method | Nuts/Dietary Patterns Assessed | Measure of Functional or Related Outcomes | Results |
|---|---|---|---|---|---|---|
| Nut-specific studies | ||||||
| Arias-Fernández, 2019 (Spain) |
Prospective study: Seniors-ENRICA cohort Cohort was established in 2008–2010, with 7.2 years of follow-up |
3289 individuals aged ≥60 years | A validated computerised diet history was used to assess nut consumption in 2008–2010 and 2012. Average nut consumption at baseline (2008–2010) and in the first follow-up wave of data collection (2012) was calculated to represent cumulative intake over follow-up. | Diet history included 20 types of nuts, which were grouped as follows: almonds, hazelnuts, peanuts, chestnuts, walnuts, pine nuts, sunflower seeds, pistachios, sesame seeds, cashews, macadamia nuts, and other types of nuts. | Five domains were considered to characterise participants’ physical function: (1) Agility: Rosow and Breslau scale (self-reported) (n = 1502) (2) Mobility: Rosow and Breslau scale (self-reported) (n = 1502) (3) Overall physical function: physical component summary (PCS) score of the 12-Item Short-Form Health Survey SF-12 (self-reported) (n = 1665) (4) Grip strength: highest value in two consecutive measures on the dominant hand (objective measure of muscle strength) (n = 1256) (5) Gait speed: 3 m walking speed test (objective measure of physical performance) (n = 1233) |
In men, compared with no consumption, an intake of nuts ≥11.5 g/d (median) in nut consumers was associated with lower risk of self-reported impaired agility (fully-adjusted HR = 0.59, 95% CI: 0.39–0.90) and mobility (fully-adjusted HR = 0.50, 95% CI: 0.28–0.90). In women, compared with no consumption, the fully-adjusted HR (95% CI) of impaired self-reported overall physical function was 0.65 (0.48–0.87) for intake ≥11.5 g/d. No association was found between nut consumption and grip strength and gait speed. |
| Studies on dietary patterns that include nuts (as a food group) | ||||||
| Bradlee, 2018 (United States) | Prospective study: Framingham Offspring Study Began in 1972, with a median follow-up of 13.0 years |
5124 offspring were enrolled in 1972 For skeletal muscle mass outcomes, participants aged 40 years or older were included. For functional status outcomes, participants aged 50 years or older at the time of the dietary assessments were included; follow-up for functional status outcomes continued for up to 16 years. |
Diet records (six days) | Protein-source foods: Legumes, Soy, Nuts, Seeds | Skeletal muscle mass was estimated using BIA. Functional status was measured using standardised instruments: (1) Rosow–Breslau scale measures gross-mobility capacity (2) Nagi scale assesses self-reported functional limitations |
Higher intake of “legumes, soy, nuts and seeds” was associated with higher percent skeletal muscle mass over 9 years. In men, compared with consumption <0.25 serving/day of legumes, soy, nuts and seeds, those who consumed ≥1.25 serving/day had higher percent skeletal muscle mass (36.8% vs. 37.5%, p = 0.0197). In women, compared with consumption <0.25 serving/day of legumes, soy, nuts and seeds (27.3%), those who consumed 0.25 to <1.25 serving/day and ≥1.25 serving/day had higher percent skeletal muscle mass (28.2% and 28.1% respectively, both p ≤ 0.0156). In the multivariable Cox proportional hazards models, “legumes, soy, nuts and seeds” was not a predictor of limitation in two or more functional tasks from the Rosow–Breslau and Nagi scales (HR = 0.96, 95% CI: 0.72, 1.30). |
| Hai, 2017 (China) |
Cross-sectional study | 848 individuals aged ≥60 years who lived in the community for more than 12 months. Data from 834 participants were used for the analysis. |
A validated simplified FFQ was used. Frequency units: day, week, month or never. | Nine food categories based on the Chinese Food Guide Pagoda: (1) Grain or cereals (2) Vegetables (3) Fruit (4) Meat (pork, beef, poultry, and mutton) (5) Eggs (6) Fish and shrimp (7) Milk and milk products (8) Legumes (9) Nuts |
Sarcopenia, i.e., presence of low muscle mass, plus low muscle strength or low physical performance. Muscle mass was measured using BIA. Grip strength was measured using a dynamometer. Usual gait speed (m/s) on a 6 m course was used to measure physical performance and a slow walking speed was defined as a walking speed <0.8 m/s. |
In females, participants with sarcopenia had significantly lower frequency of nut consumption than those without sarcopenia (0.05 times vs. 0.81 times per week, p = 0.022). This was not found in male participants (p = 0.135). After adjusting for potential confounders, there was a significant association between prevalence of sarcopenia and frequency of nut consumption per week (OR = 0.724, 95% CI: 0.532, 0.985, p < 0.05). |
| Lim, 2020 (Korea) |
Cross-sectional study. 2008 to 2011 Korea National Health and Nutrition Examination Survey (KNHANES). |
3350 elderly over 65 years, 862 had sarcopenia. | 24 h dietary intake | Food intake analysis was based on the guideline of 15 food groups: (1) Cereals (2) Potato and starches (3) Sugars and sweeteners (4) Pulses (5) Nuts and seeds (6) Vegetables (7) Fungi and mushrooms (8) Fruits (9) Meat (10) Eggs (11) Fish and shellfish (12) Seaweeds (13) Milk (14) Oil and fat (15) Beverages |
Sarcopenia was defined as muscle mass excluding bones and fats of limbs measured by dual energy X-ray absorptiometry divided by weight in the form of percent is under the twice of standard deviation. | In males, the sarcopenia group had significantly lower intake of nuts and seeds than the non-sarcopenia group (5.2 g/day vs. 3.1 g/day, p = 0.002). This was not found in female participants (p = 0.258). Logistic regression analyses showed no significant association between prevalence of sarcopenia and tertiles of nut and seed intake in both males and females. |
| Studies on dietary patterns that include nuts (diet quality indices) | ||||||
| Ballesteros, 2020 (Spain) |
Prospective study: Seniors-ENRICA cohort Cohort was established in 2008–2010, with a median follow-up of 3.5 years |
3289 individuals aged ≥60 years 2071 included in the analysis |
A validated computer-assisted face-to-face dietary history. | Mediterranean Diet Adherence Screener (MEDAS) score was used to determine the adherence to the Mediterranean diet, with a higher score indicating greater adherence. | Risk of falling | There was an inverse dose-response relationship between the MEDAS score and the risk of falling in older adults (p for trend = 0.04). Compared with the people in the lowest tertile of the MEDAS score, those in the second tertile (OR = 0.93, 95% CI: 0.71–1.21) and highest tertile (OR = 0.72, 95% CI: 0.53–0.98) showed lower risk of falling after adjustment for potential confounders. |
| Schacht, 2019 (Denmark) |
Cross-sectional study | 184 Danish older individuals aged 65 years and above participated in the “Counteracting Age-related Loss of Skeletal Muscle Mass” (CALM) study. | 3 days weighed food diaries from Wednesday to Friday. Average daily consumption of different food products was calculated. | Dietary index characterised by higher intakes of whole grains, dairy products, fish, legumes, nuts, fruit, and vegetables. | Muscle function (1) 30s chair stands (2) 400 m gait speed (3) Handgrip strength (dynamometer DHD-1 [SH100]) (4) Knee extensor maximal voluntary contractions was measured using an isokinetic dynamometer |
Dietary index was associated with faster 400 m walking speed (p for trend = 0.021). No associations were found between dietary index and 30s chair stands, handgrip strength, knee extensor maximal voluntary contractions (all p for trend > 0.05). |
| Hashemi, 2015 (Iran) |
Cross-sectional study | 300 elderly men and women aged 55 years and older | Semi-quantitative Food Frequency Questionnaire, frequency of 117 common Iranian food items by standard serving size | Mediterranean pattern was defined as a dietary pattern with high factor loadings (>0.4) in food groups such as olives and olive oil, low and high carotenoid vegetables, tomatoes, whole grains, nuts, fish, fresh and dried fruits, and pickles. | Sarcopenia is defined as low appendicular muscle mass with either low muscle strength or low muscle performance. Muscle mass (DXA) was calculated as the ratio of total lean mass of legs and arms (ASM) to squared height. Muscle strength was measured using a handgrip dynamometer. Muscle performance was measured using a 4 m walk gait speed test. Low muscle performance was defined as gait speed <0.8 m/s. |
There was a significant association between Mediterranean dietary pattern and prevalence of low gait speed (p = 0.02). The percentage of participants with low gait speed (< 0.8 m/s) in the top tertile was 29.3%, second tertile was 47.5%, and lowest tertile was 43.9%. After adjusting for potential confounders, Mediterranean diet was associated with lower odds of having sarcopenia. Odds ratio (95% CI): T1: 1.00 T2: 0.84 (0.40–1.70) T3: 0.40 (0.17–0.97) P for trend: 0.04 |
3.1. Evidence from Observational Studies
3.1.1. Nut-Specific Studies
3.1.2. Studies on Dietary Patterns That Include Nuts
Studies on Dietary Patterns That Include Nuts (as a Food Group)
Studies Using Diet Quality Indices
3.2. Summary
This entry is adapted from the peer-reviewed paper 10.3390/ijerph18041848