Tunicates occupy the evolutionary position at the boundary of invertebrates and vertebrates. It exhibits adaptation to broad environmental conditions and is distributed globally. Despite hundreds of years of embryogenesis studies, the genetic basis of the invasive habits of ascidians remains largely unknown. The leathery sea squirt, Styela clava, is an important invasive species. We used the chromosomal‐level genome and transcriptome of S. clava to explore its genomic‐ and molecular‐network‐based mechanisms of adaptation to environments. Compared with Ciona intestinalis type A (C. robusta), the size of the S. clava genome was expanded by 2‐fold, although the gene number was comparable. An increase in transposon number and variation in dominant types were identified as potential expansion mechanisms. In the S. clava genome, the number of genes encoding the heat‐shock protein 70 family and members of the complement system was expanded significantly, and cold‐shock protein genes were transferred horizontally into the S. clava genome from bacteria. The expanded gene families potentially play roles in the adaptation of S. clava to its environments. The loss of key genes in the galactan synthesis pathway might explain the distinct tunic structure and hardness compared with the ascidian Ciona species. And to explore the role of transcription factors (TFs) in embryonic development and environmental adaptation, we systematically identified and analyzed TFs in S. clava genome. We reported 553 TFs categorized into 60 families from S. clava, based on the whole genome data. Comparison of TFs analysis among the tunicate species revealed that the gene number in the zinc finger superfamily displayed the most significant discrepancy, indicating this family was under the highly evolutionary selection and might be related to species differentiation and environmental adaptation. The greatest number of TFs was discovered in the Cys2His2-type zinc finger protein (zf-C2H2) family in S. clava. From the point of temporal view, more than half the TFs were expressed at the early embryonic stage. The expression correlation analysis revealed the existence of a transition for TFs expression from early embryogenesis to the later larval development in S. clava. Eight Hox genes were identified to be located on one chromosome, exhibiting different arrangement and expression patterns, compared to Ciona robusta.
- Styela clava
- leathery sea squirt
- genome sequencing
- environmental adaptation
- invasive species
- transcription factor
- zinc-finger protein
- hox
- forkhead box
I. Genome of S. clava
1. Introduction
Tunicates occupy the phylogenetic position at the boundary of invertebrates and vertebrates. They display diverse developmental processes and adaptive strategies, and serve as suitable models for exploring the origins of vertebrates and the molecular mechanisms of development. Tunicates are divided into three classes, including Ascidiacea, Appendicularia, and Thaliacea. Several ascidian genomes have been sequenced, such as those of Ciona intestinalis type A (Ciona robusta) [1][2], C. savignyi [3], Botryllus schlosseri [4], Molgula spp. [5], and Botrylloides leachii [6]. The genome resources of these organisms and some gene annotations of Phallusia, Corella and Halocynthia are now available in ANISEED, which is the main database for the worldwide community of scientists working on tunicates [7]. The genome data revealed that most of the vertebrate gene families could be identified in ascidians, suggesting that ascidians contain most of the ancestral genes involved in chordate development. The majority of the sequenced solitary ascidian genomes are relatively compact with sizes in the range of 100–200 Mb. Recently, a nearly complete genome assembly of C. intestinalis type A (C. robusta) was also constructed at the chromosome level [2]. The sequenced ascidian genome larger than 200 Mb occurred in colonial species, which is B. schlosseri, with a genome size of about 600 Mb [4]. Except for ascidians, Oikopleura dioica, an Appendicularia species, has a quite compact (only 70 Mb) and faster evolving genome compared to other tunicates [8][9]. Salpa thompsoni, a Thaliacea species, has a relatively larger genome (>600 Mb) than most of the sequenced solitary ascidians [10].
Ascidians exhibit adaptations to diverse environmental conditions and are distributed in shallow seawaters globally [11]. Moreover, many are considered as invasive species [12]. Despite the great impact of invasive tunicates on biodiversity and agriculture over the past decades, the genetic adaptations and evolution of invading populations remain poorly understood [13]. Among the recognized mechanisms underlying the rapid and adaptable responses to stress, heat‐shock proteins (hsps), a group of evolutionarily conserved protein families, are one of the crucial molecules that facilitate coping with environmental fluctuations in organisms through the correction of protein folding or the maintenance of protein homeostasis [14]. Genome‐level studies could greatly facilitate the deciphering of the molecular mechanisms underpinning the invasion process [15] and provide the genomic data for application in population genetic studies [16].
Ascidians, like most metazoans, have a biphasic lifespan. The fertilized eggs first develop into swimming larvae, which then attach to a substrate and metamorphose into adult‐like juveniles. Considerable changes also occur during the metamorphosis stages in ascidians [17], including the regression of their notochord. Such abrupt change in body structure during development provides metazoans with two opportunities for adapting to their environment. The cellular basis of larval metamorphosis has been investigated and summarized based on observations from several ascidian species [18]. At the molecular level, signaling pathways, such as the mitogen‐activated protein kinase pathway, the c‐Jun N‐terminal kinase pathway, and the extracellular regulated kinase (ERK) pathway, are involved in Ciona larval metamorphosis [19]. Moreover, the phosphorylated form of ERK transduces the apoptosis‐activating signal for tail regression in tail tissues of Ciona [19]. However, the signaling pathways and regulators of larval metamorphosis in ascidians still need to be further studied.
Styela has a morphology stereotypic of adult solitary ascidians, which was apparently established at least 500 Mya. The Cheungkongella ancestralis, a member of the Chengjiang fauna in Southern China has been reported to be a kind of tunicate [20]. The fossil tunicate, Shankouclava, which was found in South China, was also reported as the first tunicate from the Early Cambrian and is approximately 520 million years old [21]. The fossil, representing the earliest reported tunicate fossil specimen, resembles the ascidian morphologically. In addition, Styela has also long been used as a developmental model. Edwin G. Conklin made a milestone contribution to embryonic cell‐lineage tracking using Styela partita 100 years ago [22].
Over the course of several decades, Styela, especially the leathery sea squirt S. clava, has also been shown to be an important ecological species because of its invasive potential and ability to adapt to new environments [23][24][25]. S. clava is native to the northwestern region of the Pacific [11], but currently occurs globally, because of anthropogenic transport. Its global spread has had a major impact on the regional marine biodiversity and on aquaculture industries because of fouling. However, appropriate genomic resources remain scarce for this species and the genetic basis of its invasive characteristics are largely unknown.
In the present study, we sequenced the whole genome of S. clava using Pacific Bioscience (PacBio) sequencing platforms and, by combining it with a HiC approach, we achieved a chromosomal‐level assembly of 340 Mb (scaffold N50 of 20.77 Mb) with 17,480 protein‐coding genes. Using both genomic and transcriptomic data, in addition to in situ hybridization and chemical drug inhibition experiments, we expect to aid our understanding of the molecular basis of their broad environmental adaptations of S. clava.
2. Results and Discussion
2.1. S. clava has a larger genome size and increased gene length compared with C.intestinalis type A (C. robusta)
2.1.1. Genome sequencing and annotation
The genome of S. clava was sequenced using the PacBio RSII and Illumina Hiseq2500 platforms. A total of SMRT sequencing subreads representing over 40.73 Gb (approximately 100 × coverage) were obtained after quality filtering and were used for genome assembly. An additional Illumina pair‐end sequencing reads covering 31.74 Gb were obtained after filtering and were used for sequence correction. The genome size was estimated at 406.87 Mb based on a k‐mer analysis. The FALCON strategy [26] was used for contig assembly, and a reference genome with 340.42 Mb and 710 contigs was constructed. The assembled genome size was smaller than the one by k‐mer analysis. This could be caused by the removement of the highly overlapped contigs during assembly. The assembled contigs displayed high continuity, with an N50 length of 758 Kb, which is one of the longest N50 length among the sequenced genomes of ascidians and other marine invertebrates listed in this article. Over 93% of the clean reads from the Illumina short‐insert library could be successfully mapped to the reference genome. Among the 978 Benchmarking Universal Single Copy Orthologs (BUSCOs) [27] used for assessing genome completeness, 90% of the complete BUSCOs could be covered by the reference genome. The data showed that the assembled genome of S. clava had high integrity and accuracy.
We used a Hi‐C approach to acquire a chromosome‐level assembly. The contigs were successfully clustered into 16 groups (Figure 1a), which was consistent with previous karyotype analyses of S. clava and S. plicata [28][29][30]. The clustered contigs corresponded to a length of 317.55 Mb (93.28% of the length of the contigs). The final assembled genome had 210 scaffolds with an N50 length of 20.77 Mb, providing a chromosomal‐level reference genome based on Hi‐C data.
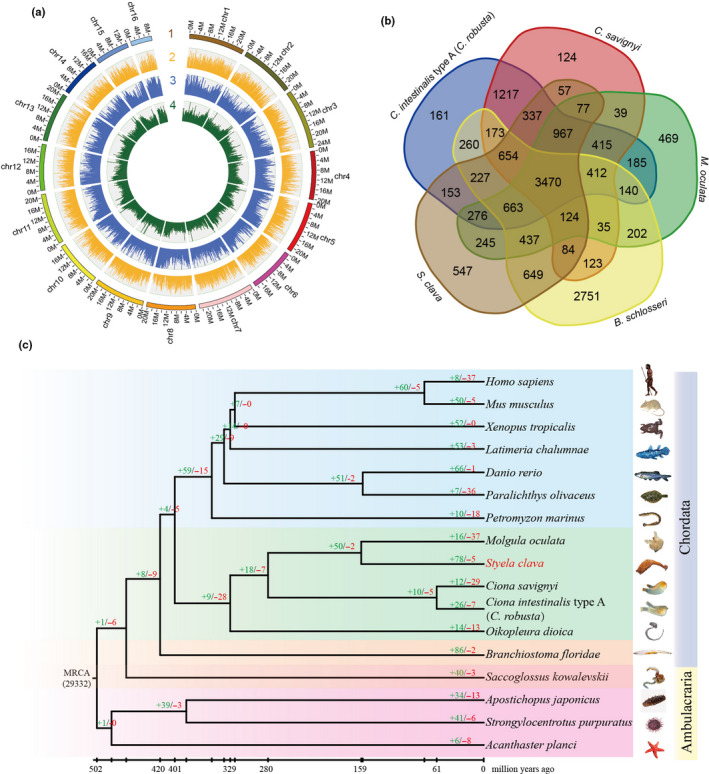
Figure 1.Genome map, gene family and phylogenetic position of Styela clava. a, Chromosome‐level genome map of S.clava. From outer to inner circles: 1, 16 chromosomes at megabase scales; 2, gene density across the genome (brown); 3, abundance of repetitive sequences across the genome (blue); 4, GC content across the genome drawn in 0.1 Mb nonoverlapping windows (green). b, Venn diagram of common and unique gene families among five ascidian species, i.e., C. intestinalis type A (C. robusta), C. savignyi, Molgula oculata, B. schlosseri, and S. clava. 3,470 gene families were shared among the five ascidians and 547 gene families existed exclusively in the S.clava genome. c, The phylogenetic position, divergence time estimation and gene family analysis of S. clava. The green and red colored numbers indicate the expanded gene families and the contracted gene families, respectively. The divergence years are displayed below the phylogenetic tree.
The genome of S. clava showed approximately 1.72% heterozygosity based on the k‐mer analysis of short‐insert library reads. Repeat sequences made up 46.69% of the assembled genome. A total of 17,428 protein‐coding genes were identified, 15,734 of which could be annotated in databases including NR, Swiss‐Prot, KEGG, GO, and Pfam. Various noncoding small RNAs were also found in the genome, including 120 micro‐RNAs, 2,680 tRNAs, and 837 rRNAs.
3.1.2. Gene family and phylogenetic analysis
The gene families among five ascidians were determined via an all‐to‐all blastp search against the full protein‐coding genes. In general, 15,673 gene families were detected among the five ascidian genomes (Figure 1b). 3,470 of them were shared by five species, and 11,621 of them were identified in at least two species. In a previous study, 8,716 families of homologous genes were present in the deuterostome ancestor [31].
The gene families were also determined via an all‐to‐all blastp search against the full protein‐coding genes among 17 metazoans. We classified the gene families into single‐copy, multiple‐copy, unique, and other orthologs. The single‐copy family included one‐to‐one orthologous genes, the multiple‐copy family included orthologous genes with multiple copies in all the species, the unique family included genes that only appeared in one species, and other orthologs included the other orthologous genes present in at least two species. To determine the phylogenetic position of S. clava, a genome‐wide phylogenetic tree was constructed based on single‐copy genes from 17 genomes (Figure 1c). The results showed that S. clava was closest to M. oculata and that the estimated divergence time was 159 Mya. S. clava and M. oculata belong to the order Enterogona while Ciona to the order of Pleurogona. This result was consistent with that of a previous study [32]. In total, 78 gene families were expanded in S. clava, whereas five gene families were contracted. The expanded gene families included the pulmonary surfactant‐associated protein collectin, cytochrome P450 2U1, and ficolin solute carrier family 22. Positively selected genes in S. clava were also identified by comparison with C. intestinalis type A (C. robusta), C. savignyi, M. oculate, and O. dioica. The top two genes (aladin‐like and DNA mismatch repair protein Mlh1‐like) were both related to DNA repair, which indicated the adaptation of S. clava to environment.
3.1.3. Genome structure characteristics
Compared with the reported reference genomes of Ciona and Molgula, S. clava has a similar gene number but a larger genome size. A statistical analysis revealed that S. clava had a larger average gene length and gene distance length (Figure 2a). Moreover, the gene length and gene distance distribution revealed that S. clava had more genes with a larger intron size (>10 Kb) and a greater number of large intergenic regions (>10 Kb) compared with those from C. intestinalis type A (C. robusta) (Figure 2a). A gene structure comparison analysis revealed that the difference in average intron length was the major reason for the variation in gene length among tunicates. Further analysis also showed that the intron elongation inside each gene was not homogeneous. S. clava tended to have one large intron inside each gene. There were also less intron‐less genes in S. clava.
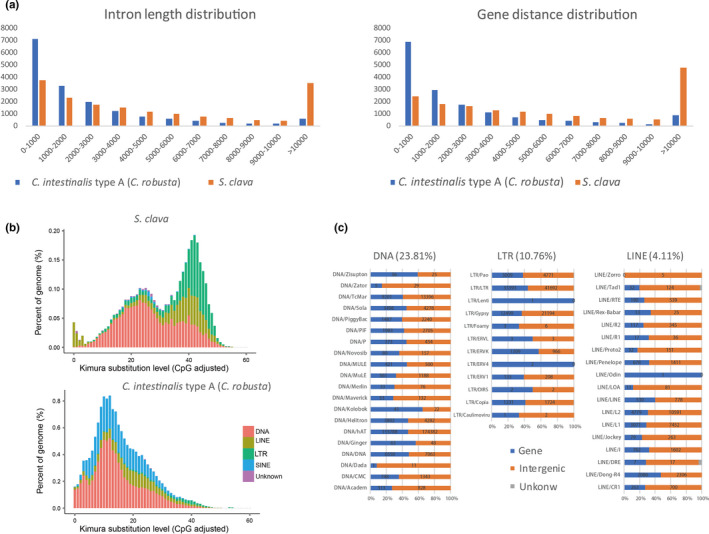
Figure 2. Gene structure and transposable element (TE) expansion in the S. clava genome. a, Intron length and gene distance distribution in the S. clava and C. intestinalis type A (C. robusta) genomes. The x‐axis indicates the length intervals, while the y‐axis indicates the number of genes. The blue and orange bars represent the intron length and gene distance distribution in C. intestinalis type A (C. robusta) and S. clava genomes, respectively. b, Classification and substitution level of TEs in the S. clava and C. intestinalis type A (C. robusta) genomes. The x‐axis represents the kimura substitution level (CpG adjusted) of TEs. The y‐axis represents the percentages of TEs in the genome. The different colors represent different types of transposons. The DNA elements are the main transposon types in both S. clava and C. intestinalis type A (C. robusta) genomes. However, the number of SINEs was decreased, while that of LTRs and LINEs was increased significantly in S. clava genomes. c, Distribution of the different types of transposons in the S. clava genome. The proportions of DNA, LTR, and LINE transposons in the S. clava genome were 23.81%, 10.76%, and 4.11%, respectively. The blue bars represent the numbers of transposons that are distributed in gene regions. The orange bars represent the number of transposons that are distributed in intergenic regions.
Considering that 46.69% of the S. clava genome consisted of repeat sequences, and that 45.92% of the sequences were annotated as transposable elements (TEs), we first compared the TEs between S. clava and C. intestinalis type A (C. robusta) to probe the mechanisms underlying the larger average gene length and gene distance observed in this species. The classification of TEs revealed that DNA elements, LTRs, and LINEs were the main TEs in S. clava, while DNA elements and SINEs were the major ones in C. intestinalis type A (C. robusta) [33](Figure 2b). The amount of TEs, such as SINEs, is strongly correlated with tunicate genome size in larvaceans [34]. Here, we found that the composition of TEs also affected the genome size of a different species of ascidian. The appearance of LTRs and the absence of SINEs in the S. clava genome contributed to the genome size variation. A distribution analysis of TEs in the genome of S. clava showed that the major TEs were distributed in both intragenic and intergenic regions (Figure 2c). We inferred that insertions of TEs had a great effect on the doubling of the Styela gene size compared with in Ciona, and that insertions of TEs into intergenic regions resulted the more dispersive distribution of genes observed in S. clava. TEs are believed to evolve in the fashion of a molecular clock, as they are identical at the time of integration and then gradually diverge because of the accumulation of mutations [35][36]. The LINEs dominated the lowest substitution level in S. clava(Figure 2b), indicating that they were active recently in the genome. Consistent with this expectation, LINEs were also identified from the transcriptome data and expressed at RNA‐Seq levels.
A rapid genome evolution and, in particular, active TEs potentially facilitate the adaptation of invasive species to new environments [37]. It is possible that such plasticity in genome characteristics, particularly through transposon diversity, facilitates the observed invasive success of S. clava and other tunicate species.
3.2. Gene gain and gene loss shed light on the molecular basis of the environmental adaptation of S. clava
3.2.1. Hsp70 gene expansion
Among the known mechanisms underlying the rapid and adaptable responses to stress, heat‐shock proteins form the crucial molecular pathways. Heat‐shock proteins are a group of evolutionarily conserved protein families, which facilitate the coping with environmental fluctuations through the correction of protein folding or the maintenance of protein homeostasis [14]. For example, the heat‐shock protein 70 (Hsp70) is central to the adaptation of oysters to sessile life in the highly stressful intertidal zone [38].
The Hsp70 family of genes exhibited a remarkable genome‐wide gene duplication in S. clava (Figure 3a). Forty‐two Hsp70 genes were identified by searching the whole genome. Thirty‐two of them were located in the same chromosome (chromosome ID: Hic_asm_6) indicating that these genes were likely tandem duplicated. Thirteen of the genes were located on the same contig. In C. intestinalis type A (C. robusta), only eight genes are classified into the Hsp70 gene family [39]and are dispersed in different scaffolds. The search for Hsp70 genes in other tunicate genomes also revealed that S. clava has expanded Hsp70 genes (Figure 3a). To investigate the temporal expression of Hsp70 genes, we analyzed the transcriptomic data during embryogenesis and larval development of S. clava. The results showed that most of the Hsp70 genes in S. clava were expressed during embryogenesis and larval development. Twelve Hsp70 genes were upregulated from the neurula to the tailbud stages, which indicated their participation for successful development. We inferred that the expression of Hsp70 at the tailbud stage was correlated with the adaptation to environmental stress, because the hatched embryos lost the protection from the envelope. The expansion and tandem duplication of Hsp70 genes may affect the adaptation to environmental stress in S. clava.
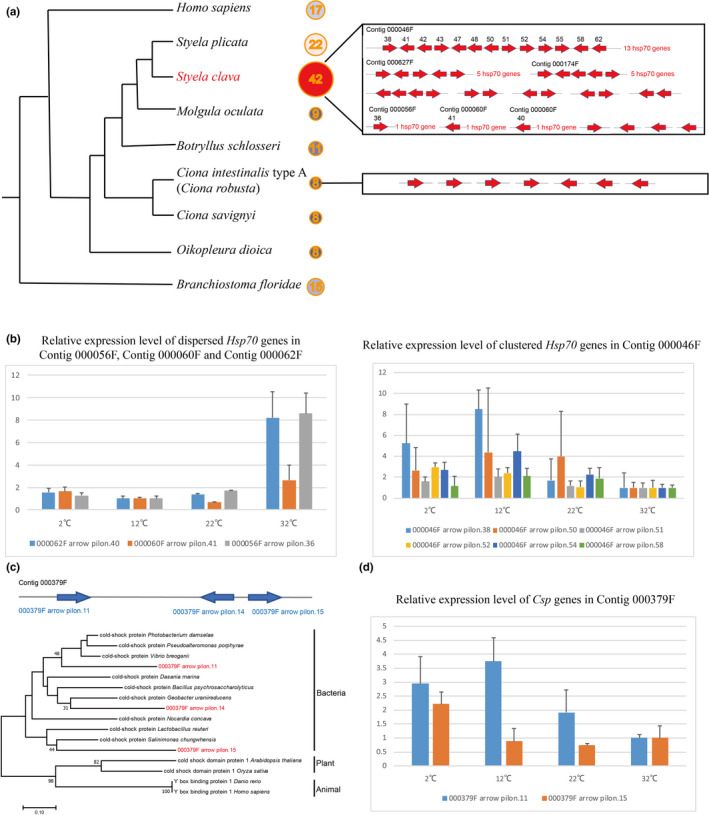
Figure 3. Expansion of heat‐shock protein 70 (Hsp70) genes and horizontally transferred cold‐shock protein (Csp) genes in the S. clava genome. a, Number of Hsp70 genes in different chordate animals. S. clava had the greatest number of Hsp70 genes among these species. The Hsp70 genes in the S. clava genome were both clustered and interspersed, while the Hsp70 genes in the C. intestinalis type A (C. robusta) genome were all interspersed. b, Expression levels of Hsp70 genes at different temperatures. The three dispersed Hsp70 genes were upregulated in high‐temperature stress, while the six‐tandem repeat Hsp70 genes were upregulated under low‐temperature stress and downregulated under high‐temperature stress. c, Positioning in the genome and phylogenetic analysis of Cspgenes in S. clava. The three identified Csp genes were aligned in the same contig. The phylogenetic tree was constructed using the neighbor‐joining method. The three Csp genes in S. clava are labelled in red color and were clustered with bacteria Csp genes. d, The Csp genes were upregulated under lower‐temperature stress.
To investigate whether the expansion of Hsp70 genes contributed to the plasticity of thermal stress adaptation, we examined their expression at different temperatures using qPCR. The relative expression levels revealed that the dispersive genes were upregulated at 32°C, while the clustered genes were upregulated at 12°C and 2°C (Figure 3b). Previous studies have focused on the expression dynamics of Hsp70 genes under acute temperature stress at both the transcription and translation levels [39][40]. The oyster genome contains 88 Hsp70 genes, which was regarded as crucial roles in protecting cells against heat and other stresses [38]. Although studies have shown that Hsp70 genes could be transcriptionally induced by heat stress in two ascidians [39][41][42], our results showed that numerous, but not all, Hsp70 genes responded to either heat or cold temperature related‐environmental stresses.
3.2.2. Horizontally transferred genes
The living environment of S. clava is complex, with various parasitic or symbiotic microorganisms, and their interaction may offer a path for the horizontal transfer of functional genes in the course of their evolutionary history. Horizontal gene transfer (HGT) may spread rapidly evolutionarily success across lineages and facilitate the exploitation of recipient organisms of new niches or other resources. Although numerous cases of HGT have been documented in prokaryotes and unicellular eukaryotes [43], it is common belief that HGT is rare in multicellular eukaryotes, such as animals and plants[44] . However, HGT occurs frequently in ascidians. Among all the protein‐coding genes in C. intestinalis type A (C. robusta), 169 were likely derived from algae, 92 of them with high probability [45]. The best‐known example is the cellulose synthase genes in ascidians, which were transferred from bacteria responsible for tunic formation [46][47][48].
The methods used for detecting HGT generally rely on the analysis of phylogenetic conflict [43]. Here, we detected HGT events in S. clava at the whole‐genome level. Three cold‐shock protein‐like (Csp) genes in the same contig were screened. Two of the three genes had introns. The phylogenic tree also revealed that they were horizontally transferred from bacteria (Figure 3c). In addition, we used blastx to search for their homologous genes in the NR database. The results showed that the top 10 annotations of the three genes all came from bacteria. The Illumina sequencing coverage analysis of Csp genes also showed that the genes had a coverage that was similar to that of the surrounding sequences.
Csps are small, abundant proteins that are essentially composed of one cold‐shock domain (CSD). Some members of the family are strongly induced after cold shock and are involved in adaptation to low temperatures [49][50]. CSDs have been found in many other bacterial and eukaryotic proteins, such as the well characterized eukaryotic Y‐box proteins [51][50]. However, reports of Csp genes in the animal kingdom are scarce. To validate the functions of the horizontally transferred Csp genes in the Styela genome, their expression levels under low‐temperature stress were also examined using qPCR. The results showed that the expression of Csp genes was upregulated at both 12°C and 2°C (Figure 3d). The HGT events of Csp genes provide one of the possible molecular mechanisms for S. clava adaptation to environmental stress, particularly low‐temperature stress.
3.2.3. The tunic structure of ascidians
The integument is an important defense system for sessile organisms, who cannot move from stressful environmental conditions, such as irradiation, drying, predation, infection, bio‐fouling [52]. The name Tunicata is derived from the integumentary tissue called the tunic, which covers the entire epidermis in ascidians [53]. As the tunic has multiple functional roles [52], it is hypothesized to be one of the features underlying the high adaptability and tolerance observed in ascidians. Cellulose constitutes the main structure of the tunic that surrounds the adult body. Tunicates are the only animal population that can produce cellulose by themselves [54][55][56][57].
The hardness of the tunic was associated with protection from the environmental stresses. However, there is great variation in the hardness and transparency of the tunic among the different species of ascidians. We inferred that the varying hardness of the tunic was caused by its composition. According to a previous study, the tunic is mainly composed of complex carbohydrates [53]. The tunic structures could be described as cellulose‐protein fibrils cemented by sulfated mucopolysaccharides or sulfated glycans and lipids. In tunics, cellulose is the dominant carbohydrate [54][53]. Therefore, we assessed the content of different saccharides in the tunic of different species of ascidians. The results showed that the sulfated polysaccharide contents, particularly galactose, is more abundant in the order Phlebobranchia (e.g., C. intestinalis type A (C. robusta) and C. savignyi) than in Stolidobranchia (e.g., S. clava and H. roretzi) (Figure 4a). Reasonably, the higher contents of other sugars detected in the soft tunics imply higher content of sulfated glycans, which renders the structures more flexible compared with hard tunics.
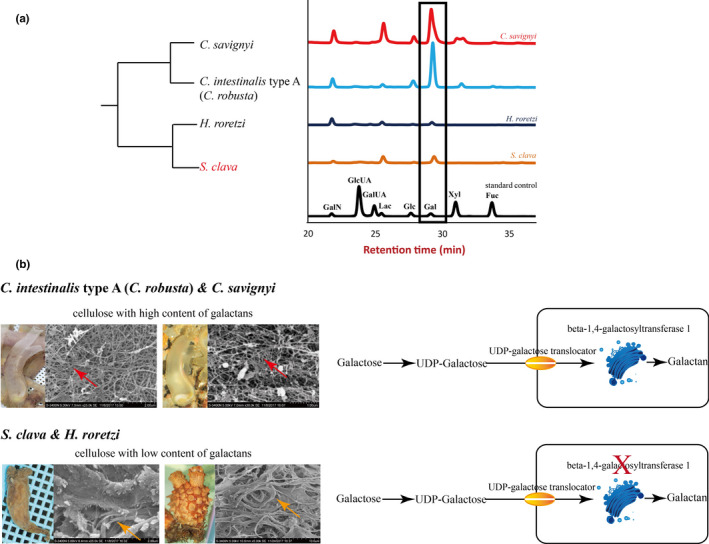
Figure 4. Tunic structure, monosaccharide composition, and galactan synthesis among different ascidians. a, Monosaccharide composition of the tunic in different ascidians. Both C. savignyi and C. intestinalis type A (C.robusta) had high levels of galactose, while H. roretzi and S. clava had relatively low levels of galactose. The rectangle represents the levels of galactose in different ascidians, as detected using mass spectrometry. The black line indicates the standard control. b, Tunic structures and galactan synthesis pathway in different ascidians. The main constituent of the tunic was cellulose. However, the cellulose structures with high galactans content were more scattered (red arrows) in C. intestinalis type A (C. robusta) and C. savignyi, while the cellulose structures with low galactan content were more bundled in H. roretzi and S. clava (orange arrows). In both C. intestinalistype A (C. robusta) and S. clava, galactose was first transferred into UDP‐galactose and then transported inside the cells through a UDP‐galactose translocator located in the cell membrane. The enzymes in the Golgi apparatus were responsible for the synthesis of polysaccharides. The key gene in this process, beta‐1,4‐galactosyltransferase 1, could only be identified in the genome of C. intestinalis type A (C. robusta) and C. savignyi, and not in the genome of S. clava.
We used a scanning electron microscope to observe the detailed structures of tunics from C. intestinalistype A (C. robusta), C. savignyi, S. clava, and H. roretzi. The fibers in C. intestinalis type A (C. robusta) and C. savignyi were much thinner, while the fibers in S. clava and H. roretzi were bundled together (Figure 4b). Our results are consistent with results of previous studies of the morphology of a H. roretzitunic, which reported that the tunic surface was entirely covered with a cuticular layer that had a very dense structure of bundled fibers, and that the tunic matrix was distributed between the fibers [58]To compare the molecular basis of the tunic, a whole‐genome level of GlycosylTransferase (GT) domain analysis was conducted. The cellulose synthase genes in different ascidians were similar among the various ascidians. Considering the difference in galactose contents between Phlebobranchia and Stolidobranchia, we compared the galactan synthesis‐related genes in the species and found conserved UDP‐galactose translocator genes in the four species, implying that the galactose transport ability is conserved (Figure 4b). After transportation into cells, many glycan structures of glycoproteins and glycolipids are assembled in the Golgi apparatus by families of glycosyltransferases [55]. The beta‐1,4‐galactosyltransferase (beta4GalT) is responsible for the synthesis of sulfated galactans. Each subfamily member is expressed in a tissue‐specific manner and exhibits differences in oligosaccharide acceptor specificity and tissue‐specific expression [59] . The comparison of the family members of beta4GalT genes showed that beta4GalT1 was only observed in C. intestinalis type A (C. robusta) and C. savignyi, and not in S. clava and H. roretzi(Figure 4b). The gene is unique among the beta4GalT genes because it encodes an enzyme that participates in the biosynthesis of both glycoconjugates and lactose. The loss of beta4GalT1 in Phlebobranchia may be related to the low level of sulfated galactans in the tunic structure. These findings suggest a molecular basis for the formation of distinct tunic structures among different tunicate species.
3.3. Thyroid hormone pathway and complement system genes participated in the regulation of the metamorphosis of S. clava
3.3.1. Transcriptome sequencing of different developmental stages of S. clava
Ascidians have a distinctive pattern of embryogenesis and larval development: zygotes first develop into larvae with a notochord, then, the notochord regresses after the attachment of larvae, thus providing a suitable model for developmental studies of metamorphosis. The larval developmental process is also referred to as retrogressive metamorphosis. To explore the molecular basis of the process, we performed a transcriptome analysis of 2–8–cell embryos (2–8 cells), gastrula embryos (gast), neurula embryos (neu), tailbud‐stage embryos (tb), hatched swimming larvae (hsl), tail‐regressed larvae (trl), and metamorphic juveniles (mj) (Figure 5a). There were three replicates at each stage. According to the results of a weighted correlation network analysis (WGCNA), (Figure 5b), genes were grouped using a clustering approach. Gene expression heat maps for each module were shown in Figure 5b.
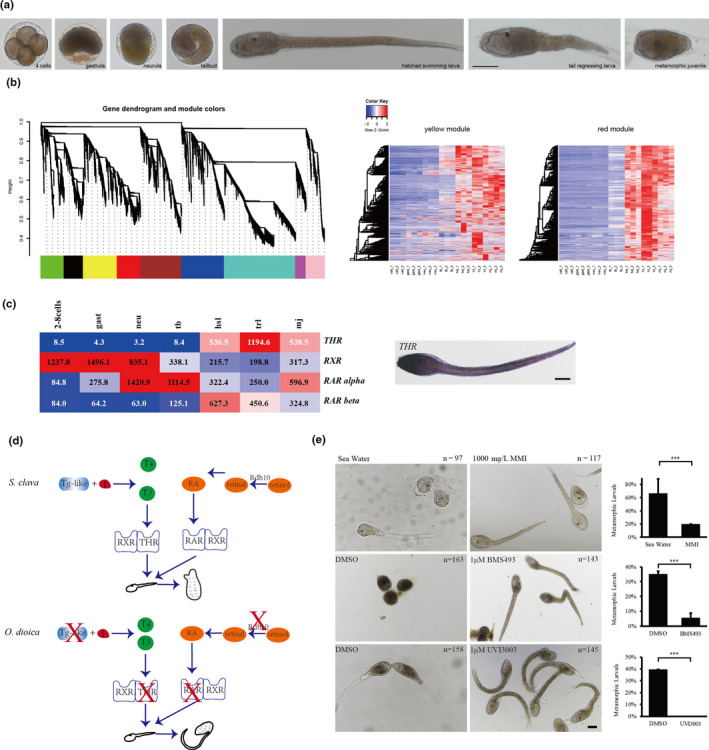
Figure 5. Thyroid hormone and retinoic acid signaling pathways. a, The seven developmental stages of S. clava embryos and larvae; i. e., 4‐cell stage, gastrula, neurula, tailbud, hatched swimming larvae, tail‐regressing larvae, and metamorphic juvenile. b, Weighted correlation network analysis (WGCNA) of the genes based on the transcriptomics data at different developmental stages. Different colors indicated different gene modules. The gene expression heat maps for yellow and red modules were also shown. c, The gene expression heatmap of thyroid hormone receptor (THR), retinoic acid receptor (RAR alpha), retinoic acid receptor beta (RAR beta) and retinoid X receptor (RXR) in S. clava. The numbers inside the grids indicate the FPKM values of each gene at different stages. The red color indicates genes that are highly expressed, while the blue color indicates genes that are relatively weakly expressed. THR was expressed in the epithelia of the head and terminal parts of the tail in the hatched larvae, according to in situ hybridization. d, Comparison of the thyroid hormone (TH) and retinoic acid (RA) signaling pathways between the tail‐regressing S. clava and the tail‐preserved O. dioica. The key genes for TH and RA synthesis and their receptors could be identified and were expressed in S. clava, while the retinol dehydrogenase 10 (rdh10) gene, the TH, and RA receptor genes were absent in the O. dioica genome. e, Inhibition of the THR, RAR and RXR signaling pathways led to the failture of tail regression in S. clava larvae. The groups treated with MMI (an inhibitor of TH synthesis), BMS493 (an inhibitor of RAR), and UVI3003 (an inhibitor of RXR) exhibited significantly reduced the metamorphic levels compared with the controls.
3.3.2. Thyroid hormone receptor (THR) was enriched in tail regression transcriptomic data
One of these modules, here depicted in red, yielded some interesting results: 1,725 genes were clustered into this module (Figure 5b), which contained genes specifically expressed in hatched swimming larvae, tail‐regressing larvae, and metamorphic juveniles. Among these genes, the thyroid hormone receptor (THR) gene was highly upregulated during tail regression (Figure 5c). In addition, RAR was also highly expressed during tail regression (Figure 5c). The connectivity value of THR ranked the second among the transcription factors and in the top 10% among all genes in this module, representing a potential hub gene for network regulation. To understand this potentially central role of THR during metamorphosis, we decided to investigate the expression and function of THR.
3.3.3. TH signaling plays essential roles in the metamorphosis of S. clava
The THR gene was upregulated by 64‐fold in hatched swimming larvae and by 142‐fold in tail‐regressing larvae compared with tailbud‐stage embryos. In situ results showed that THR was expressed in the epithelia of the head and tail part of the larvae (Figure 5c). It has been demonstrated that TH signals are obligatory for vertebrate metamorphosis and function through the activation of a complex hierarchical cascade of target genes [60]. Moreover, comparative genomics and transcriptomics analyses of flatfish identified the cross‐talk role between TH and retinoic acid signaling during metamorphosis [61]. These data suggest that TH and RA are required for tail regression in tunicates too. To test this hypothesis at the genomic level, we investigated the genome of O. dioica, which belongs to the class Appendicularian, keeps its notochord throughout its lifespan. This provides a suitable comparative study model. After searching its genome, we found no hits for the THR and retinoic acid receptor (RAR) genes in the genome of O. dioica (Figure 5d). Moreover, the key genes that are related to the synthesis of TH and retinoic acid, such as rdh10 genes, were also absent in the genome of O. dioica(Figure 5d). These results support our hypothesis that the THR and RAR genes are associated with the processes of tail regression in tunicates.
We substantiated further our hypothesis using inhibitor experiments. MMI (an inhibitor of TH synthesis, 1 g/L) [62] and BMS493 (an inhibitor of RAR signaling, 1 μm/L) [63] treatment resulted in significantly lower larval metamorphic rates compared with the rates observed in the control, while UVI3003 (an inhibitor of the retinoid X receptor (RXR), 1 μm/L) [64] signaling treatment inhibited metamorphosis in S. clava (Figure 5e). The results presented above suggest that TH and RA signaling play essential roles in the metamorphosis of Styela larvae.
3.3.4. Complement system genes
Among the genes that were highly expressed during metamorphosis (e.g. in hatched swimming larvae, tail regressed larvae, and metamorphic juveniles), many of them were immune‐related genes. Although there is no evidence of adaptive immunity in tunicates, a search of the S. clava genome revealed a variety of genes that could mediate innate immunity, particularly complement system genes. There is also a high number of potential complement genes in C. intestinalis type A (C.robusta), including the C1q and C6 genes [65]. However, a comparison between S. clavaand other four tunicate species revealed a varying composition in complement system genes (Figure 6a). Pattern‐recognition genes, including the Mannose‐binding lectin (MBL) and ficolin genes, were expanded in S. clava. Twenty‐five MBL genes and 54 ficolin genes were identified. For proteases and receptors, 17 factor B genes and 16 complement receptor 1 genes were identified. Moreover, a great proportion of the expanded genes in S. clava exhibited high levels of expression during metamorphosis (Figure 6b). The results of whole‐mount in situ hybridization showed that component 3 (C3) and complement receptor 1 (CR1) genes were both highly expressed in epithelia cells of the trunk and the posterior part of the tail in the hatched larvae. C3 was also expressed in the neck region while CR1 expression was not seen in the neck region of swimming Styela larvae (Figure 6b).
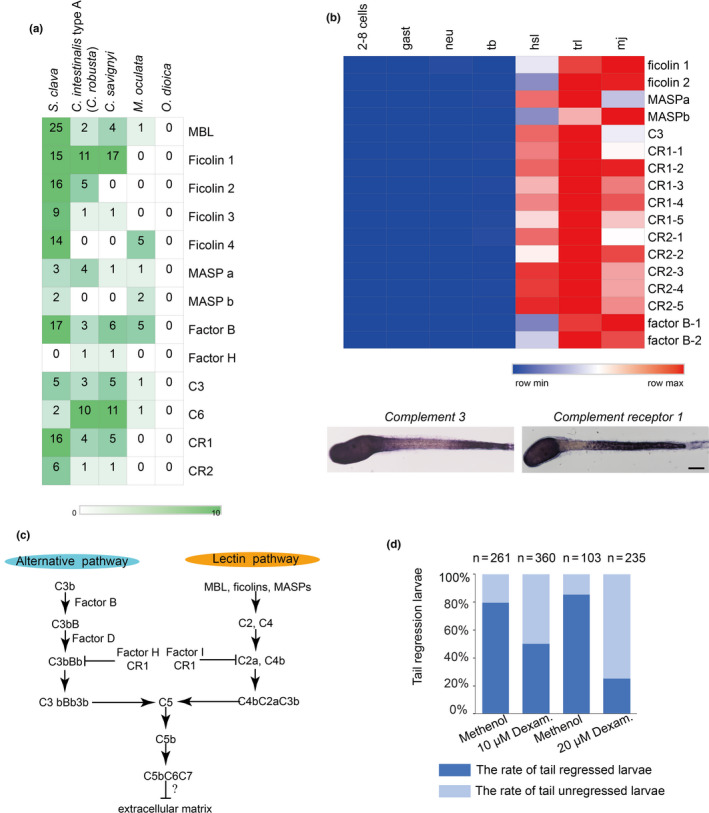
Figure 6. Expanded complement system genes and their upregulation in the hatched larvae of S. clava. a, The identified complement system‐related genes were expanded in S. clava, compared with other tunicate species. The rows represent the gene number in each genome. The numbers inside the grids indicate the number of genes in the genome. b, The gene expression heatmap of the selected complement pathway genes in S. clava transcriptomes. 2–8 cells, gast, neu, tb, hsl, trl, mj represent the gene expression of 2–8‐cell embryos, gastrula embryos, neurula embryos, tailbud‐stage embryos, hatched swimming larvae, tail‐regressing larvae, and metamorphic juveniles, respectively. The scale bar indicates the FPKM values. Most of the genes were highly expressed during tail regression. The complement 3 (C3) and complement receptor 1 (CR1) were expressed in epithelial cells of the trunk and terminal parts of the tail in the hatched larvae. c, Putative alternative and lectin complement pathways in S. clava. d, Inhibition of complement signaling pathways led to the failture of tail regression in S. clava larvae. Fertilized eggs were treated with 10 and 20 μm dexamethasone, and phenotypes were observed at 22 hpf. The larval tail‐regression rate was sigificantly decreased in drug‐treated groups under the two treatment concentrations.
The expression patterns and upregulated expression of complement system genes in Styela support our speculation that complement system gene signaling may occur in response to high levels of stress linked to the death and reorganization of larval tissues. In another species of solitary ascidians, Boltenia villosa, innate immune signaling during metamorphosis has been reported to be involved in coordinating the resorption of larval tissues, the maturation of the tunic, or the adhesion and migration of mesenchymal cells [66]. The expanded MBL‐complement pathways in Styela could be important in the detection of the environmental cues that initiate settlement just like the situation in B. villosa[67] (Figure 6c).
The expression patterns of the complement 3 gene and its receptor resembled those of the fibroblast growth factor and Wnt Signaling genes (Roberts et al., 2007), indicating that complement pathways may participate in the regulation of larval tissue development. As complement molecules were highly expressed in the metamorphic stages, we speculated that they were involved in the regulation of larval metamorphosis in S. clava. Therefore, we used dexamethasone [68][69] to inhibit the activity of the complement system in Styela larvae, and observed that inhibitor‐treated larvae failed to regress their tails (Figure 6d). These results suggest that the complement signaling pathway is essential for Styela larvae tail regression.
3. Conclusion
Here, we reported the chromosome‐level assembly of the genome of the leathery sea squirt, S. clava, and constructed the transcriptomic profiles in development of S. clava. Expansion of DNA, LTR, and LINE transposons was more closely related to the doubled genome size of S. clava than to that of C. intestinalistype A (C. robusta). Moreover, the expanded Hsp 70 family and horizontally transferred cold‐shock proteins responded to acute temperature stress, while different types of galactan synthesis genes were associated with the tunic structure and hardness. An integrated TH synthesis pathway was also found, and the associated genes were highly expressed during tail regression. A functional analysis demonstrated that the pathway was associated with ascidian metamorphosis. The complement system genes were expanded in the S. clava genome, and potentially participated in both immunology and the regulation of metamorphosis in this species. The present study provides insights into the mechanisms of adaptation to changes in the environment and the mechanisms of larval metamorphosis in invasive tunicates.
II. Transcription factor of S. clava
1. Introduction
Transcription factors (TFs) specifically recognize the DNA sequence through DNA-binding domains (DBDs) on itself, controlling transcription, and performing the first step in decoding the DNA sequence[70]. All TFs have at least one DBD, through which they attach to a specific sequence of DNA fragment adjacent to the genes, and then the transcriptions of these genes are either activated or repressed[71]. DBD is a crucial standard for the identification and classification of TFs. The DBD, regulatory regions, and biological functions of TFs are largely conserved across metazoans, although the number and diver- sity of TFs in different organism are variable[71][72][73]. TFs play extensively and essentially regulatory functions in diversely biological processes, such as cell differentiation[74], organ development[75], inflammatory response[76], and body-axis building[77]. In metazoans, TFs were identified and classified into 78 TF families in the REGULATOR database[78]. Genome-wide TFs databases are also available, such as the Animal Transcription Factor DataBase (Animal TFDB)[79]. In these databases, TFs of the representative species, such as Homo sapiens and Drosophila melanogaster are identified and classified.
Tunicates occupy a crucially phylogenetic status between invertebrate and vertebrate, which are closely related to the vertebrates in evolution. The characteristic development process makes them a great study model for developmental biology. In Ciona robusta (C. intestinalis type A), TFs were identified at the genome level[80][81][82][83][84][85]. Most Ciona TFs are expressed maternally and were demonstrated to regulate early embryonic development. For example, brachyury, belonging to the T-box TF family, regulates the notochord cell spec- ification and morphogenesis, through the downstream genes mediated by cis-regulatory modules[86][87][88][89], such as the nuclear factor of activated T cells 5 (nfat5), T-box2/3 (Tbx2/3), and signal transducer and activator of transcription 5 (stat5)[90][91]. Whereas, FoxD activates the expression of the zinc finger of the cerebellum-like (ZicL) part, which binds and promotes the expression of brachyury[92][93][94].
The various TFs in different animals were evolutionarily related to their regulatory ways. For example, hox genes were conserved throughout vertebrates[95][96], but in tunicates, the number and arrangement of hox genes were quite different, indicating the different roles of hox genes in tunicates[95][96].
Styela clava is a globally distributed ascidian species that shows a strong environmental adaptation[97][24][11]. In this study, we performed genome-wide identification and analysis for TFs in S. clava. The expanded and contracted TF families were also identified through comparison with other species. Furthermore, the expression profiles of TFs in S. clava were also analyzed. These results provided insights into the understanding of the regulatory mechanisms of TFs in embryogenesis and environmental adaptation in tunicates, and the evolution of the TF families.
2.Results
2.1. Identification of TFs in the S. clava Genome
A total of 17,428 protein-coding genes were identified, 15,734 of which were annotated in the S. clava genome[97]. Based on our previous study, we further identified 553 TF genes, which were distributed in 60 TF families in the S. clava genome, according to the domain annotation of proteins and the types of DBD. In these 60 TF families, the Cys2His2-type zinc finger protein (zf-C2H2) family had the largest number of TFs, with 154 genes (27.85% of total TFs) (Table 1). The Homeodomain family and the basic helix–loop–helix (bHLH) family were the second and third largest TF family, with 73 (13.20%) and 41 (7.41%) TFs, respectively (Table 1). There were 16 orphan TFs, belonging to the TF family with only one member including the ALL1-fused gene from chromosome 4 (AF-4), the CCAAT-binding transcription factor subunit B_nuclear transcription factor Y subunit alpha (CBFB_NFYA), and interferon regulatory factors-3 (IRF-3), etc. (Table 1).
Table 1. Number of TFs and TF families in S. clava, C. robusta, M. oculata, O. dioica, B. leachii, B. schlosseri, H. sapiens, B. floridae, and C. elegans.
|
TF superfamily |
TF family |
S. clava |
C. robusta |
M. oculata |
O. dioica |
B. leachii |
B. schlosseri |
H. sapiens |
B. floridae |
C. elegans |
|
|
AF-4 |
1 |
1 |
1 |
1 |
1 |
1 |
8 |
1 |
0 |
||
|
ARID |
4 |
5 |
7 |
4 |
4 |
2 |
15 |
4 |
5 |
||
|
BTD |
2 |
2 |
2 |
2 |
2 |
3 |
6 |
2 |
1 |
||
|
bZIP |
bZIP_1 |
13 |
16 |
12 |
21 |
15 |
7 |
37 |
14 |
11 |
|
|
bZIP_2 |
6 |
7 |
7 |
8 |
6 |
2 |
12 |
8 |
17 |
||
|
CBF_beta |
1 |
1 |
1 |
1 |
1 |
1 |
1 |
1 |
1 |
||
|
NF-Y |
CBFB_NFYA |
1 |
1 |
0 |
1 |
1 |
0 |
1 |
1 |
2 |
|
|
CBFD_NFYB_HMF |
8 |
9 |
8 |
13 |
8 |
4 |
45 |
16 |
9 |
||
|
CG-1 |
0 |
1 |
1 |
0 |
0 |
0 |
2 |
1 |
1 |
||
|
CP2 |
2 |
3 |
2 |
2 |
2 |
3 |
8 |
2 |
1 |
||
|
CSD |
9 |
5 |
4 |
7 |
4 |
4 |
17 |
2 |
5 |
||
|
CSRNP_N |
1 |
1 |
0 |
2 |
1 |
2 |
3 |
1 |
1 |
||
|
MH1 |
CTF_NFI |
2 |
1 |
0 |
0 |
1 |
0 |
4 |
1 |
0 |
|
|
MH1 |
4 |
5 |
7 |
11 |
4 |
5 |
11 |
4 |
7 |
||
|
E2F_TDP |
2 |
4 |
4 |
3 |
3 |
2 |
20 |
4 |
5 |
||
|
ETS |
Ets |
12 |
15 |
12 |
11 |
14 |
12 |
29 |
12 |
10 |
|
|
ETS_PEA3_N |
0 |
0 |
0 |
0 |
0 |
0 |
4 |
1 |
0 |
||
|
Forkhead box |
23 |
25 |
24 |
26 |
27 |
27 |
55 |
28 |
16 |
||
|
GCFC |
2 |
2 |
2 |
1 |
2 |
2 |
3 |
1 |
2 |
||
|
GCM |
0 |
0 |
0 |
0 |
0 |
0 |
2 |
1 |
0 |
||
|
GTF2I |
0 |
1 |
0 |
0 |
0 |
0 |
15 |
0 |
0 |
||
|
bHLH |
bHLH |
41 |
39 |
36 |
22 |
37 |
20 |
102 |
73 |
38 |
|
|
Myc_N |
0 |
1 |
1 |
0 |
0 |
1 |
4 |
1 |
0 |
||
|
SIM_C |
0 |
0 |
0 |
0 |
0 |
0 |
2 |
0 |
0 |
||
|
HMG_box |
20 |
20 |
14 |
19 |
18 |
21 |
102 |
29 |
16 |
||
|
Homeobox |
Homeodomain |
73 |
76 |
74 |
70 |
74 |
45 |
264 |
108 |
85 |
|
|
CUT |
2 |
1 |
3 |
3 |
3 |
2 |
8 |
3 |
7 |
||
|
PBC |
1 |
1 |
1 |
1 |
1 |
5 |
11 |
1 |
2 |
||
|
Pou |
2 |
3 |
3 |
5 |
3 |
2 |
17 |
6 |
3 |
||
|
HPD |
2 |
2 |
1 |
1 |
1 |
1 |
3 |
0 |
1 |
||
|
HSF_DNA-binding |
1 |
1 |
0 |
4 |
1 |
2 |
9 |
5 |
1 |
||
|
HTH_psq |
6 |
2 |
3 |
0 |
9 |
0 |
2 |
5 |
1 |
||
|
IRF |
IRF |
5 |
5 |
6 |
2 |
8 |
5 |
3 |
4 |
0 |
|
|
IRF-3 |
1 |
3 |
2 |
0 |
4 |
9 |
9 |
4 |
0 |
||
|
LAG1-DNAbinding |
0 |
0 |
0 |
0 |
0 |
1 |
0 |
0 |
0 |
||
|
LRRFIP |
0 |
1 |
3 |
1 |
1 |
1 |
5 |
1 |
1 |
||
|
MBD |
3 |
2 |
4 |
0 |
3 |
2 |
7 |
3 |
2 |
||
|
Myb_DNA-binding |
12 |
13 |
11 |
7 |
13 |
11 |
25 |
16 |
7 |
||
|
NCU-G1 |
1 |
0 |
1 |
0 |
1 |
2 |
1 |
1 |
0 |
||
|
NDT80_PhoG |
1 |
1 |
3 |
0 |
1 |
2 |
2 |
1 |
2 |
||
|
Nrf1_DNA-binding |
1 |
1 |
1 |
0 |
1 |
1 |
1 |
3 |
0 |
||
|
P53 |
3 |
2 |
1 |
1 |
3 |
5 |
3 |
2 |
1 |
||
|
PAX |
7 |
6 |
5 |
8 |
5 |
2 |
9 |
5 |
9 |
||
|
PC4 |
1 |
1 |
0 |
1 |
1 |
1 |
3 |
2 |
1 |
||
|
RFX_DNA_binding |
2 |
3 |
3 |
1 |
3 |
2 |
10 |
5 |
1 |
||
|
RHD_DNA_binding |
3 |
2 |
3 |
2 |
4 |
5 |
13 |
2 |
0 |
||
|
Runt |
1 |
1 |
1 |
1 |
1 |
2 |
3 |
1 |
1 |
||
|
SAND |
3 |
2 |
1 |
2 |
1 |
2 |
7 |
4 |
4 |
||
|
SRF-TF |
3 |
2 |
2 |
3 |
2 |
1 |
5 |
3 |
2 |
||
|
STAT |
STAT_alpha |
0 |
0 |
0 |
1 |
0 |
2 |
2 |
0 |
0 |
|
|
STAT_binding |
2 |
2 |
2 |
2 |
2 |
2 |
5 |
1 |
2 |
||
|
STAT_int |
0 |
1 |
0 |
0 |
0 |
0 |
0 |
2 |
0 |
||
|
TAFH |
2 |
1 |
1 |
1 |
1 |
1 |
6 |
3 |
1 |
||
|
T-box |
10 |
8 |
8 |
8 |
8 |
13 |
19 |
10 |
19 |
||
|
TEA |
1 |
1 |
1 |
2 |
1 |
1 |
4 |
1 |
1 |
||
|
TF_AP-2 |
1 |
2 |
1 |
1 |
1 |
2 |
5 |
1 |
4 |
||
|
TF_Otx |
0 |
0 |
0 |
0 |
0 |
0 |
1 |
0 |
0 |
||
|
TIG |
11 |
7 |
6 |
12 |
16 |
29 |
18 |
15 |
4 |
||
|
TSC22 |
2 |
1 |
1 |
0 |
2 |
1 |
4 |
1 |
5 |
||
|
Tub |
1 |
1 |
1 |
2 |
1 |
1 |
5 |
2 |
2 |
||
|
Vert_HS_TF |
0 |
0 |
0 |
0 |
0 |
0 |
3 |
0 |
0 |
||
|
zinc finger |
THAP |
21 |
8 |
27 |
0 |
40 |
49 |
9 |
7 |
3 |
|
|
GATA |
5 |
4 |
4 |
5 |
5 |
2 |
17 |
7 |
12 |
||
|
DM |
5 |
2 |
0 |
2 |
7 |
3 |
7 |
8 |
11 |
||
|
Nuclear Receptor |
Hormone_receptor |
6 |
6 |
6 |
7 |
5 |
9 |
28 |
10 |
151 |
|
|
Androgen_receptor |
0 |
0 |
0 |
0 |
0 |
0 |
1 |
0 |
0 |
||
|
Oest_receptor |
0 |
0 |
0 |
0 |
0 |
0 |
1 |
0 |
0 |
||
|
Prog_receptor |
0 |
0 |
0 |
0 |
0 |
0 |
1 |
0 |
0 |
||
|
GCR |
0 |
0 |
0 |
0 |
0 |
0 |
1 |
0 |
0 |
||
|
zf-C4 |
15 |
12 |
14 |
33 |
11 |
21 |
32 |
21 |
124 |
||
|
zf-BED |
17 |
2 |
6 |
0 |
8 |
9 |
3 |
0 |
9 |
||
|
zf-C2H2 |
154 |
95 |
193 |
72 |
110 |
310 |
748 |
742 |
58 |
||
|
zf-C2HC |
5 |
3 |
2 |
2 |
4 |
5 |
8 |
2 |
1 |
||
|
zf-LITAF-like |
4 |
1 |
2 |
5 |
3 |
2 |
4 |
11 |
14 |
||
|
zf-MIZ |
2 |
2 |
3 |
2 |
1 |
0 |
6 |
2 |
2 |
||
|
zf-NF-X1 |
1 |
1 |
2 |
0 |
1 |
1 |
1 |
1 |
1 |
||
|
Total TFs |
553 |
456 |
557 |
425 |
522 |
693 |
1867 |
1240 |
703 |
||
|
Total TF families |
60 |
64 |
57 |
51 |
61 |
60 |
74 |
64 |
55 |
||
2.2. Comparison Analysis of S. clava TFs
To compare the TFs in S. clava with other species, the same approach was utilized to identify TFs in the species genomes. Three species, including human (H. sapiens), cephalochordate (the lancelet, Branchiostoma floridae), nematode (Caenorhabditis elegans), and five tunicates, including C. robusta, Molgula oculata, Oikopleura dioica, Botrylloides leachii, and Botryllus schlosseri were selected for comparison analysis. The results showed that there were 51 families shared by S. clava, H. sapiens, B. floridae, and C. elegans (Figure 7A). There were also 51 families shared among the five ascidian species (Figure 7B). There were 44 gene families shared between these two groups. Seven gene families including Transcriptional Coactivator p15 (PC4), Cysteine/serine-rich nuclear protein N-terminus (CSRNP_N), DM, CBFB_NFYA, Helix-turn-helix (HTH_psq), Heat shock factor type DNA binding (HSF_DNA-binding), and the MIZ-type zinc finger (zf-MIZ) were only shared among the species in Figure 1A, while the other seven gene families including RHD_DNA_binding, BEAF and DREF-type zinc finger protein (zf-BED), AF-4, Homeo-prospero domain (HPD), IRF-3, IRF, and NLS-bindingm and DNA-binding, and the dimerization domains of Nrf1 (Nrf1_DNA-binding) were only shared among the species in Figure 7B.
To explore the expansion and contraction of TFs families, we compared the TFs families in tunicates with other species. Nine human TF families could not be found in tunicates and C. elegans (Table 1). Among these nine families, two were found in B. floridae (Table 1). The thanatos-associated proteins (THAP) family was increased in Stolidobranchia ascidians, including S. clava, M. oculata, B. leachii, and B. schlosseri, compared to H. sapiens (Table 1). Compared to B. floridae and C. elegans, general transcription factor IIi (GTF2I), Signal Transducer, and the Activator of Transcription binding (STAT_binding) families were only found in tunicates (Figure 7A, Table 1).
In the S. clava genome, six TF families had the largest number of TFs among the six tunicates, including the bHLH, the Cold shock domain (CSD), the CTF/NF-I family transcription modulation region (CTF_NFI), NHR1 homology to TAF (TAFH), zf-BED, and Sp100, AIRE-1, NucP41/75, and DEAF-1 (SAND) families (Table 1). Two TF families in the S. clava genome had the least number of TFs among the six tunicates, including the forkhead box (fox) and Leucine-Rich Repeat in the Flightless-Interaction Protein (LRRFIP) families (Table 1). The number of TFs in S. clava were more than that in C. robusta, O. dioica, and B. leachii (Table 1). The expansion mainly concentrated on the zf-C2H2 family, in which 59, 82, and 44 more TFs were identified in S. clava than that in C. robusta, O. dioica, and B. leachii, respectively (Table 1). Overall, comparison analysis revealed that the gene number of the zf-C2H2 family showed the most significant change among tunicates, indicating that the zinc finger family genes were under adaptative changes.
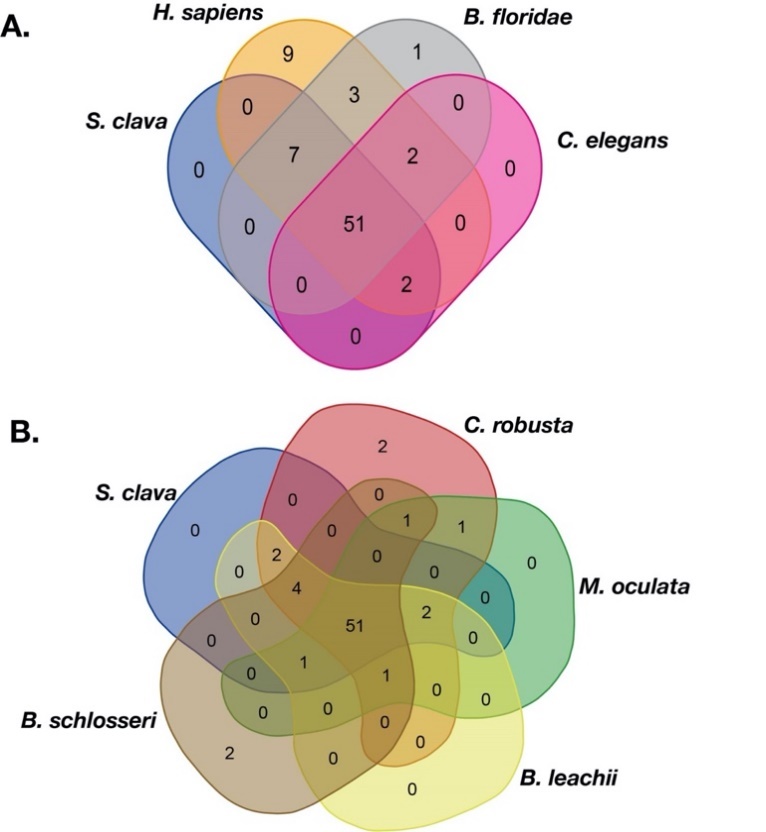
Figure 7. Veen of the TF families among different species. (A) TF families among S. clava (blue), H. sapiens (dark yellow), B. floridae (gary), and C. elegans (pink). (B) TF families among S. clava (blue), C. robusta (red), M. oculata (green), B. leachii (yellow), and B. schlosseri (brown). The transcription factor families contained in each part are listed in Table S1.
2.3. Expression of S. clava TFs at Different Developmental Stages
To explore the expression profiles of TFs during the development of S. clava, we acquired the fragments Per Kilobase of gene per million mapped reads (FPKM) value of each TF in 2-cell–8-cell embryos (2–8 cells), gastrula embryos (gast), neurula embryos (neu), tailbud-stage embryos (tb), hatched swimming larvae (hsl), tail-regressed larvae (trl), and metamorphic juveniles (mj) by RNA-sequencing [97]. These data were further validated through quantitative real-time PCR. The results showed that the relative expression levels of the randomly selected genes were coincident with the results of FPKM values. To analyze the expression profiles of TFs in S. clava during early development, we clustered 547 TFs by the weighted correlation network analysis (WGCNA) method [98] and visualized the expression level by a heat map (Figure 8). The TF genes were clustered into nine modules, labeled with different colors, based on the results of the WGCNA analysis. The turquoise module contained the most TFs, nearly one third of TFs, which were highly expressed at the 2–8 cells stage and the gast stage (Table 2). A total of 290 TF genes (52.44% of total TF genes) were expressed (with FPKM value >10) at the 2–8 cell stage in S. clava, about 161 of them were classified in the turquoise module. The expression level of these genes in this module decreased from the embryo to the larvae stage. The brown module contained nearly one fifth of TFs that were mainly expressed at the tb stage (Table 2, Figure 8).
Table 2. Number of TFs in the WGCNA modules.
|
TF family |
Turquoise |
Blue |
Magenta |
Pink |
Brown |
Yellow |
Red |
Green |
Black |
Total |
|
AF-4 |
1 |
0 |
0 |
0 |
0 |
0 |
0 |
0 |
0 |
1 |
|
ARID |
1 |
1 |
1 |
0 |
1 |
0 |
0 |
0 |
0 |
4 |
|
BTD |
1 |
0 |
0 |
0 |
0 |
1 |
0 |
0 |
0 |
2 |
|
bZIP_1 |
3 |
0 |
0 |
0 |
2 |
3 |
0 |
0 |
5 |
13 |
|
bZIP_2 |
3 |
2 |
0 |
0 |
0 |
0 |
0 |
0 |
1 |
6 |
|
CBF_beta |
0 |
0 |
0 |
0 |
0 |
0 |
0 |
1 |
0 |
1 |
|
CBFB_NFYA |
1 |
0 |
0 |
0 |
0 |
0 |
0 |
0 |
0 |
1 |
|
CBFD_NFYB_HMF |
2 |
1 |
1 |
2 |
0 |
2 |
0 |
0 |
0 |
8 |
|
CP2 |
1 |
0 |
0 |
0 |
0 |
0 |
0 |
0 |
1 |
2 |
|
CSD |
2 |
1 |
1 |
0 |
1 |
1 |
3 |
0 |
0 |
9 |
|
CSRNP_N |
0 |
0 |
0 |
1 |
0 |
0 |
0 |
0 |
0 |
1 |
|
CTF_NFI |
2 |
0 |
0 |
0 |
0 |
0 |
0 |
0 |
0 |
2 |
|
CUT |
0 |
1 |
0 |
0 |
1 |
0 |
0 |
0 |
0 |
2 |
|
DM |
1 |
1 |
2 |
0 |
1 |
0 |
0 |
0 |
0 |
5 |
|
E2F_TDP |
1 |
0 |
0 |
1 |
0 |
0 |
0 |
0 |
0 |
2 |
|
Ets |
3 |
0 |
0 |
3 |
2 |
3 |
0 |
1 |
0 |
12 |
|
Forkhead box |
4 |
1 |
0 |
3 |
5 |
4 |
3 |
1 |
2 |
23 |
|
GATA |
4 |
0 |
0 |
0 |
0 |
1 |
0 |
0 |
0 |
5 |
|
GCFC |
2 |
0 |
0 |
0 |
0 |
0 |
0 |
0 |
0 |
2 |
|
HLH |
10 |
7 |
0 |
3 |
13 |
2 |
3 |
0 |
3 |
41 |
|
HMG_box |
9 |
2 |
1 |
2 |
2 |
0 |
0 |
2 |
2 |
20 |
|
Homeodomain |
5 |
4 |
2 |
6 |
37 |
8 |
3 |
4 |
3 |
72 |
|
Hormone_recepter |
2 |
0 |
0 |
0 |
0 |
2 |
1 |
0 |
1 |
6 |
|
HPD |
0 |
0 |
0 |
0 |
1 |
0 |
0 |
0 |
1 |
2 |
|
HSF_DNA-binding |
1 |
0 |
0 |
0 |
0 |
0 |
0 |
0 |
0 |
1 |
|
HTH_psq |
0 |
2 |
1 |
0 |
1 |
0 |
0 |
2 |
0 |
6 |
|
IRF IRF-3 |
2 0 |
0 0 |
0 0 |
0 0 |
0 0 |
0 1 |
0 0 |
0 0 |
3 0 |
5 1 |
|
MBD |
1 |
0 |
0 |
0 |
1 |
1 |
0 |
0 |
0 |
3 |
|
MH1 |
3 |
0 |
0 |
1 |
0 |
0 |
0 |
0 |
0 |
4 |
|
Myb_DNA-binding |
6 |
3 |
1 |
0 |
1 |
0 |
0 |
0 |
0 |
11 |
|
NCU-G1 |
1 |
0 |
0 |
0 |
0 |
0 |
0 |
0 |
0 |
1 |
|
NDT80_PhoG |
0 |
0 |
0 |
0 |
0 |
1 |
0 |
0 |
0 |
1 |
|
Nrf1_DNA-binding |
1 |
0 |
0 |
0 |
0 |
0 |
0 |
0 |
0 |
1 |
|
P53 |
2 |
0 |
0 |
0 |
0 |
1 |
0 |
0 |
0 |
3 |
|
PAX PBC |
2 1 |
0 0 |
0 0 |
1 0 |
3 0 |
0 0 |
1 0 |
0 0 |
0 0 |
7 0 |
|
PC4 Pou |
0 1 |
0 0 |
1 0 |
0 0 |
0 1 |
0 0 |
0 0 |
0 0 |
0 0 |
1 2 |
|
RFX_DNA_binding |
1 |
0 |
0 |
1 |
0 |
0 |
0 |
0 |
0 |
2 |
|
RHD_DNA_binding |
0 |
0 |
0 |
0 |
0 |
1 |
0 |
0 |
2 |
3 |
|
Runt |
0 |
0 |
0 |
0 |
0 |
0 |
0 |
0 |
1 |
1 |
|
SAND |
1 |
1 |
0 |
0 |
1 |
0 |
0 |
0 |
0 |
3 |
|
SRF-TF |
2 |
1 |
0 |
0 |
0 |
0 |
0 |
0 |
0 |
3 |
|
STAT_alpha STAT_binding |
0 0 |
0 0 |
0 0 |
0 0 |
0 0 |
0 1 |
0 0 |
0 0 |
0 1 |
0 2 |
|
TAFH |
1 |
0 |
0 |
0 |
0 |
0 |
0 |
0 |
1 |
2 |
|
T-box |
1 |
1 |
3 |
1 |
3 |
1 |
0 |
0 |
0 |
10 |
|
TEA |
0 |
0 |
0 |
0 |
0 |
0 |
0 |
1 |
0 |
1 |
|
TF_AP-2 |
0 |
1 |
0 |
0 |
0 |
0 |
0 |
0 |
0 |
1 |
|
THAP |
6 |
1 |
0 |
4 |
6 |
0 |
0 |
2 |
2 |
21 |
|
TIG |
6 |
0 |
1 |
0 |
2 |
0 |
0 |
1 |
1 |
11 |
|
TSC22 |
2 |
0 |
0 |
0 |
0 |
0 |
0 |
0 |
0 |
2 |
|
Tub |
0 |
0 |
0 |
0 |
1 |
0 |
0 |
0 |
0 |
1 |
|
zf-BED |
3 |
2 |
0 |
7 |
2 |
2 |
0 |
1 |
0 |
17 |
|
zf-C2H2 |
67 |
24 |
20 |
12 |
7 |
5 |
7 |
3 |
5 |
150 |
|
zf-C2HC |
2 |
2 |
0 |
0 |
1 |
0 |
0 |
0 |
0 |
5 |
|
zf-C4 |
0 |
1 |
1 |
3 |
2 |
3 |
2 |
1 |
2 |
15 |
|
zf-LITAF-like |
1 |
1 |
0 |
1 |
1 |
0 |
0 |
0 |
0 |
4 |
|
zf-MIZ |
1 |
0 |
0 |
0 |
1 |
0 |
0 |
0 |
0 |
2 |
|
zf-NF-X1 |
1 |
0 |
0 |
0 |
0 |
0 |
0 |
0 |
0 |
1 |
|
Total |
174 |
61 |
36 |
52 |
100 |
44 |
23 |
20 |
37 |
Based on the expression profiles of each module, we categorized nine modules into three groups. Group I contained TFs that were highly expressed during 2 cell stage to neu stage, including turquoise, blue, magenta, and pink modules. Group II contained TFs that were highly expressed during the tb stage, including the brown module. Group III contained TFs that were highly expressed during the hsl stage to mj stage, including the yellow, red, green, and black modules. More than half of the TFs (58.94%) were clustered into Group I, almost three times than that in Group II (18.25%) and Group III (22.81%) (Table 2). In Group I, zf-C2H2, homeodomain, and the bHLH family were the largest TFs (Table 2). In Group II, homeodomain and the bHLH families were the largest TFs (Table 2). In Group III, homeodomain, zf-C2H2, and fox families were the largest TFs (Table 2). Overall, the homeodomain TF family was dispersed into each group, while the Fox family was highly expressed during the larval development in Group III.
According to the expression correlation heat map of TFs, we found that five boxes of TFs showed significant correlation, which are indicated in box A to E (Figure 9). We found that the TFs in Group I were mainly distributed in box A, box D, and box E, TFs in Group II and Group III were mainly distributed in box C and box B, respectively. The expression correlation results showed that the TFs expressed in the embryogenesis and larvae development had a low correlation, indicating the discrepancy of TFs in regulating the process of embryogenesis and larvae development.
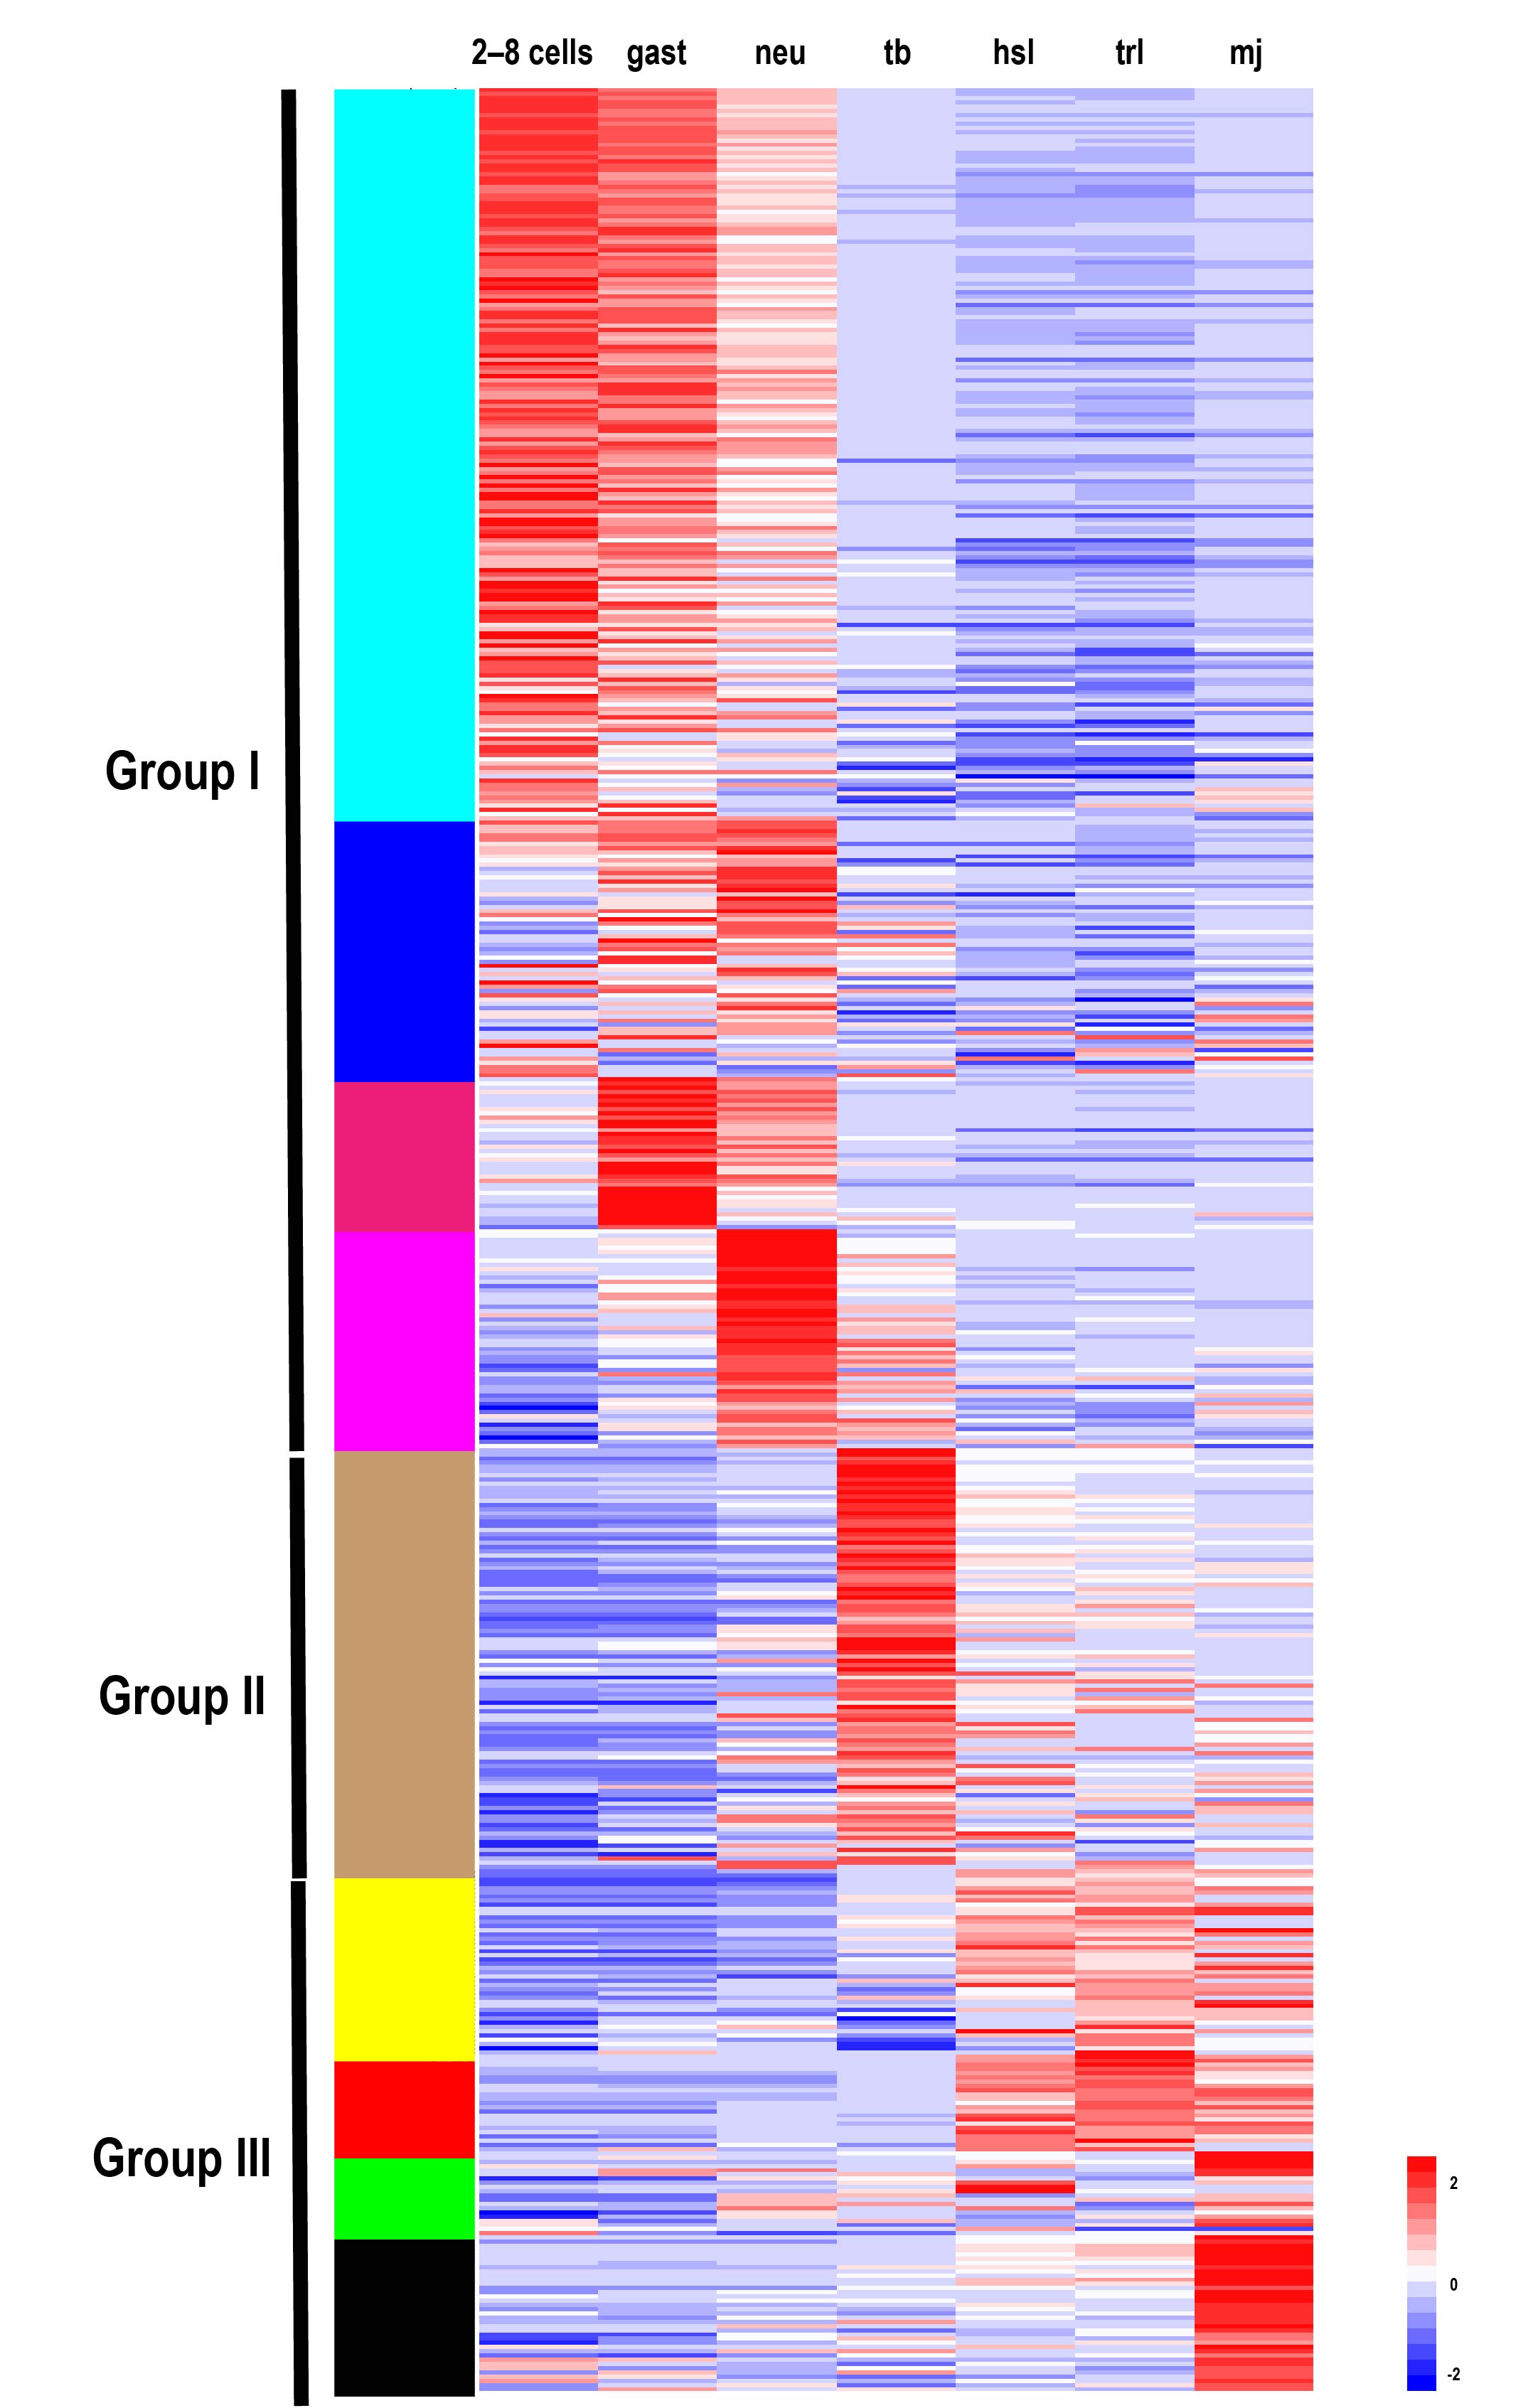
Figure 8. Expression patterns of TFs in S. clava genome—547 TFs in S. clava genome are shown in the heat map. They are classified into nine modules, including turquoise, blue, magenta, pink, brown, yellow, red, green, and black module through the WGCNA analysis. The turquoise, blue, magenta, and pink modules are classified into Group I, in which the TFs were highly expressed during 2–8 cells stage to the neural stage; the brown module is classified into Group II, in which TFs were highly expressed during the tailbud stage; the yellow, red, green, and black modules are classified into Group III, in which TFs were highly expressed from the hatched swimming larvae stage to the metamorphosis juvenile stage. The scale bar indicates the centered FPKM values. The abbreviation of different developmental stages are as follows—2-cell–8-cell embryos (2–8 cells), gastrula embryos (gast), neurula embryos (neu), tailbud-stage embryos (tb), hatched swimming larvae (hsl), tail-regressed larvae (trl), and metamorphic juveniles (mj).
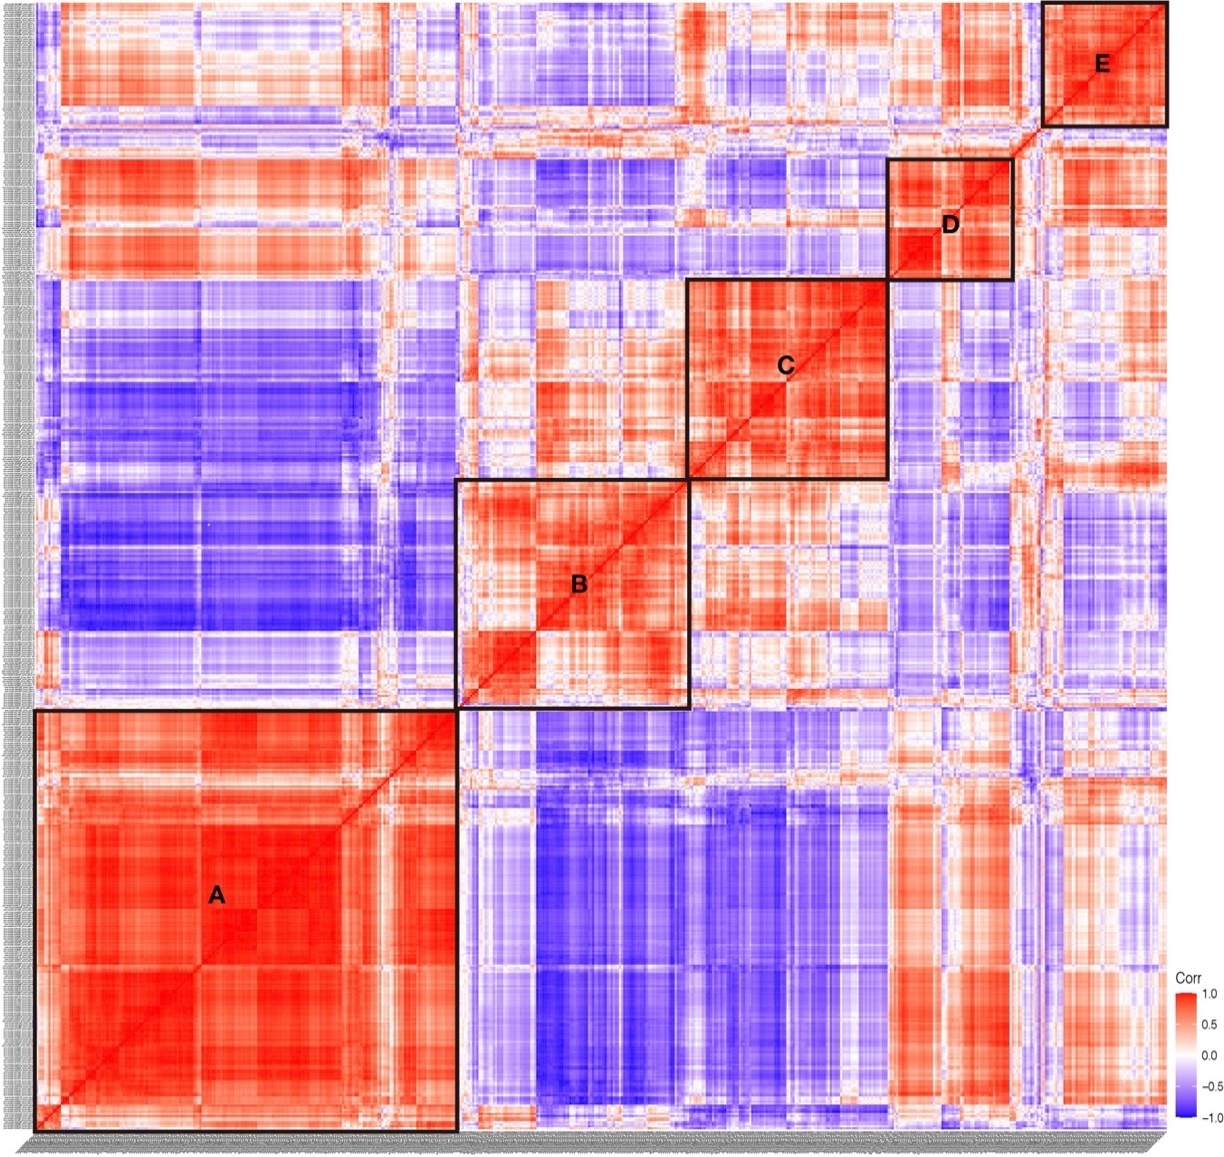
Figure 9. Expression correlation of TFs in S. clava. The correlation score showed between −1.0 (deep blue) to 1.0 (deep red). The red color indicated that these two TFs showed positive expression correlation, and the blue color showed negative expression correlation. Five significant correlation groups are indicated by box A to box E.
2.4. Hox Genes
Hox genes are important members of the homeobox TF family and share common development mechanisms in regulating the anteroposterior body axis [77]. In vertebrates, there are 13 paralog groups (PGs) for Hox genes. Through phylogenetic analysis and blast annotation, we identified eight Hox genes in S. clava, including ScHox1, ScHox2, ScHox3, ScHox4, ScHox5, ScHox10, ScHox12, and ScHox13, which were classified into eight PGs. The molecular phylogenetic tree provided a convincing evidence that ScHox1, ScHox2, ScHox3, ScHox10, ScHox12, and ScHox13 belonged to the PG1, PG2, PG3, PG10, PG12, and PG13, respectively. ScHox4 and ScHox5 were identified by sequence alignment. The results showed that they belonged to PG4 (e-value = 2 × 10-57) and PG5 (e-value = 5 × 10-52), respectively. All Hox genes identified in the S. clava genome were distributed on one single chromosome according to the Hi-C result [97]. Hox genes were also distributed on one single chromosome in Halocynthia roretzi with similar arrangement, and on two chromosomes in the C. robusta genome (Figure 10A). In other tunicates mentioned in this study, the Hox genes were distributed on several scaffolds (Figure 10A). In H. sapiens, four Hox clusters existed in the genome and were distributed on four chromosomes (Figure 10A). B. floridae contained all 13 kinds of Hox genes and were distributed on one single chromosome (Figure 10A). In tunicates, there are nine Hox genes in C. robusta, O. dioica, H. roretzi, and B. schlosseri genome [99][100][101][6]. There are six, seven, and eight Hox genes in the M. oculata, B. leachii, and S. clava genome [96][101], respectively (Figure 10A).
The expression profiles of Hox genes in S. clava showed that ScHox4 and ScHox12 were initially expressed at the neu stage, ScHox1, ScHox10, and ScHox13 were initially expressed at the tb stage, ScHox3 was initially expressed at the hsl stage, and expression values of ScHox2 and ScHox5 were low during early development (Figure 10B). Expression of ScHox13 were restricted at the tb stage (Figure 10B). While ScHox12 were not expressed at the hsl stage and the trl stage, after initial expression at the neu stage (Figure 10B). Among the sub-cluster of ScHox2, ScHox3, and ScHox4, ScHox4 was initially expressed at 2–8 cells stage, earlier than the expression of ScHox3 and ScHox2 that were expressed at the gast stage and tb stage (Figure 10B).
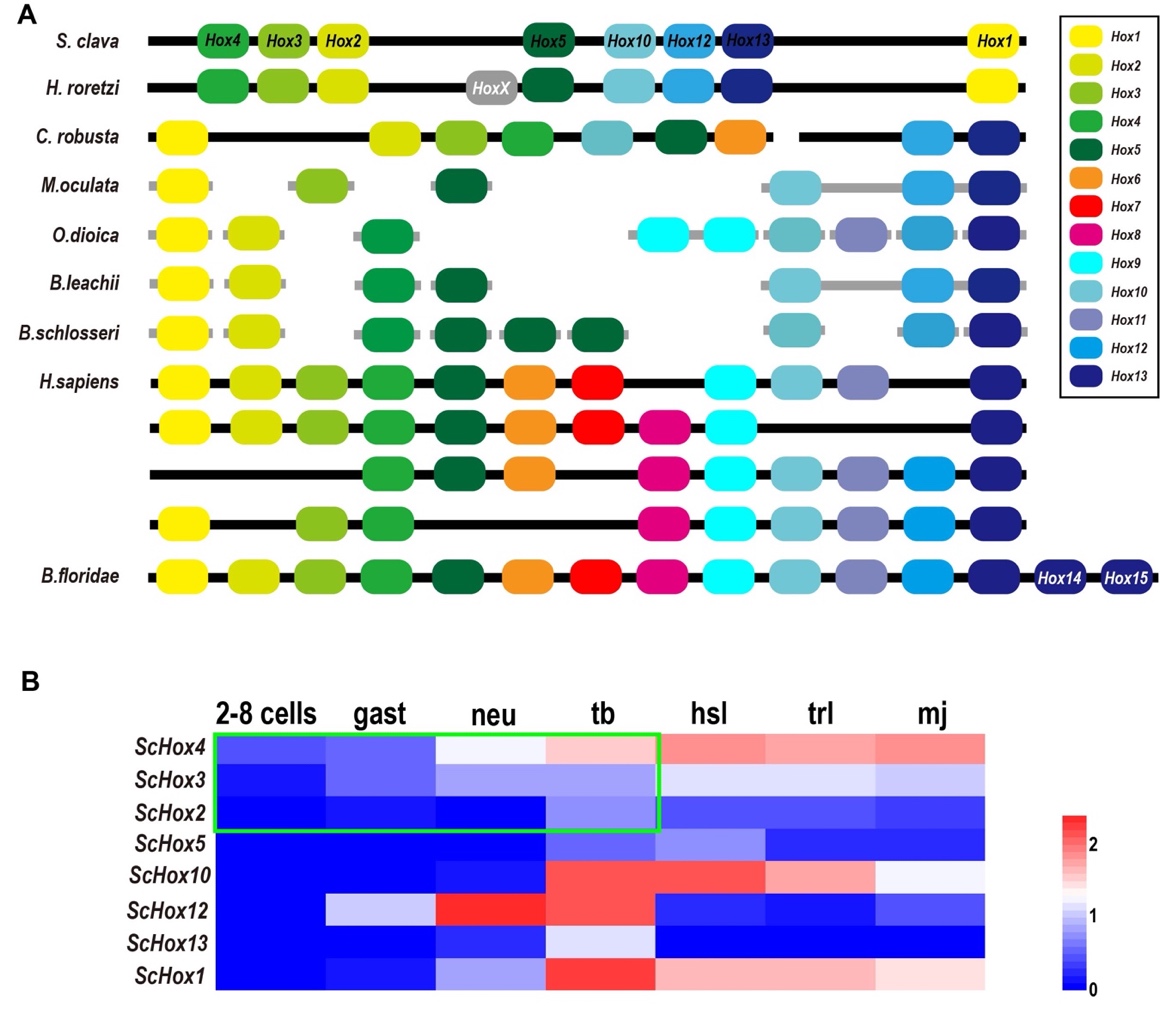
Figure 10. Comparison of Hox genes in different species and the expression patterns of ScHox genes. (A) Schema depicting Hox gene linkages retained in the genomes of seven tunicates, H. sapiens and B. floridae. Orthologous Hox genes are indicated by the same color of rounded rectangles and the legend is showed on the right. HoxX gene was an unclassified Hox gene in the H. roretzi genome. The spatial distribution of Hox genes in different species on the chromosome or scaffold are indicated by thick black line or thick gray line, respectively. (B) Heat map of the ScHox genes. Gene names are shown on the left. The scale bar indicates the FPKM values, which are dealt with log10(FPKM + 1) but not centered. The green box shows a subcluster-level temporal co-linearity (STC) expression pattern among the ScHox2, ScHox3, and ScHox4 cluster. Shorthand of different developmental stage, which is showed above the heat map, is mentioned above.
2.5. Zinc Finger Family
Zinc finger superfamily contains the greatest number of TFs in the S. clava genome (Table 1). The quantity variation of zinc finger TFs was the main contributor to the different number of TFs between species that we mentioned. There were 11 families in the zinc finger superfamily, including THAP, zf-BED, zf-C2H2, etc. (Table 1). Among these families, the THAP family was expanded in the tunicate genome and the zf-BED family was expanded in the S. clava genome, among the nine species we analyzed (Table 1).
The Zf-C2H2 family was the largest family in the S. clava genome, and also in the other eight species we analyzed (Table 1). According to the domain analysis, there are two kinds of zf-C2H2 proteins in the S. clava genome, including ZBTB and zf-C2H2. The ZBTB proteins were characterized by containing two domains, the BTB domain and zf-C2H2 domain. According to the feature of ZBTB, we identified 12 ZBTB genes in the S. clava genome, more than the other six tunicates analyzed (Figure 11A).
The zf-C2H2 genes were the majority of the zf-C2H2 family. There are 132 zf-C2H2 genes mapped on 16 chromosomes of the S. clava genome (Figure 11B). The Chr 5 processed the greatest number of zf-C2H2 genes (Figure 11B). Those zf-C2H2 genes, which were highly expressed after the neu stage (red rectangles), were located on nine of 16 chromosomes, among which Chr 3 was the most common. The wide distribution of the zf-C2H2 genes indicates the crucial regulatory roles of the zf-C2H2 domain on activating the downstream gene expression in various biological processes.
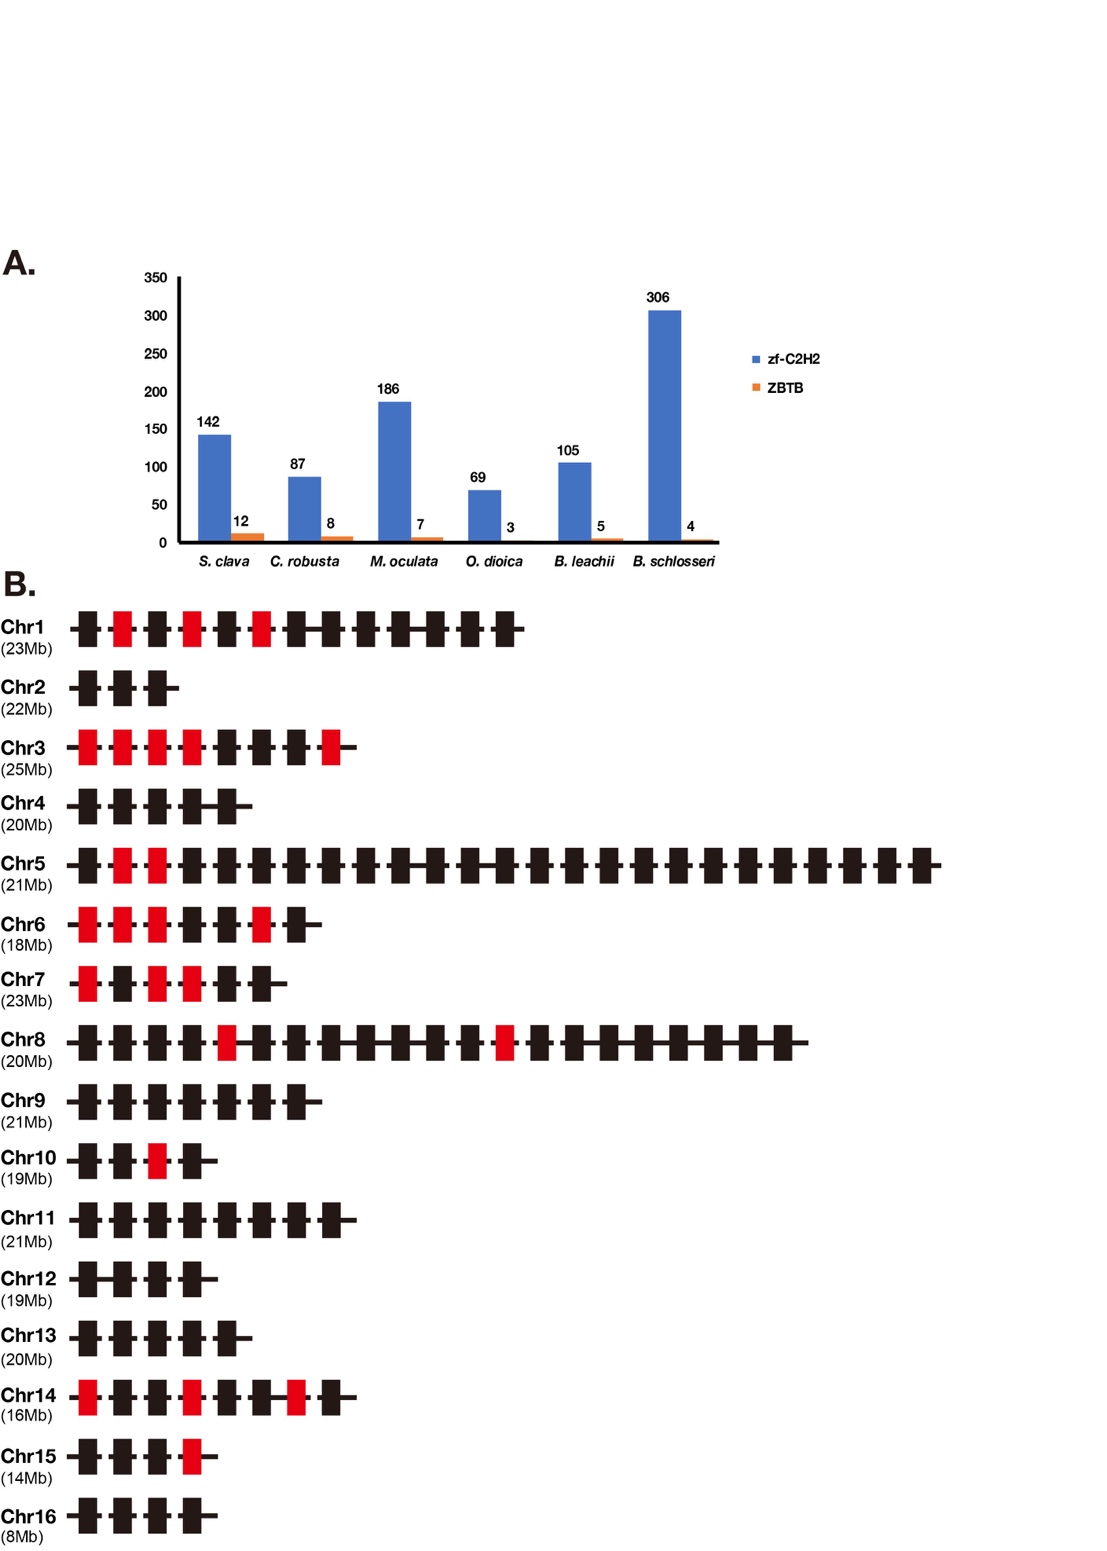
Figure 11. Classification of zf-C2H2 genes. (A) Statistics of zf-C2H2 genes and ZBTB genes in zf-C2H2 family in S. clava, C. robusta, M. oculata, O. dioica, B. leachii, and B. schlosseri. The blue volume indicates the number of zf-C2H2 genes, and the orange volume indicates the number of ZBTB genes. (B) The distribution of zf-C2H2 genes on chromosome. The rectangles indicated the zf-C2H2 genes and the colors indicate the expression levels of each zf-C2H2 genes, according to the WGCNA analysis (mentioned in Figure 2, the black and red rectangles indicate the high expression of the zf-C2H2 genes during 2 cells to neu stages, and during the tbl to mj stages, respectively). The chromosomes are labeled on the left. The black horizontal line indicates scaffold.
2.6. Forkhead Box Family
A total of 23 Fox genes were identified in the S. clava genome and they could be grouped into 15 Fox subclasses (Figure 12). The largest Fox subclass was FoxI, which contained four ScFox genes (Figure 12). The expression profiles of the ScFox genes were varied during early development (Figure 12, Table 2). Five of them were highly expressed before the tb stage, eight were highly expressed during the tb stage, and ten were highly expressed during larvae development (Figure 12). In the S. clava genome, we could not find the homologous genes of FoxB, FoxK, FoxL, and FoxS. The expression profiles showed that the ScFox genes were highly expressed in several stages during early development. This expression pattern was also presented in the Yesso scallop (Patinopecten yessoensis) [102] and sea urchin [103]. Similar patterns presented in early development in these species indicated that ScFox genes are widely involved in regulating the processes of early development of embryogenesis.
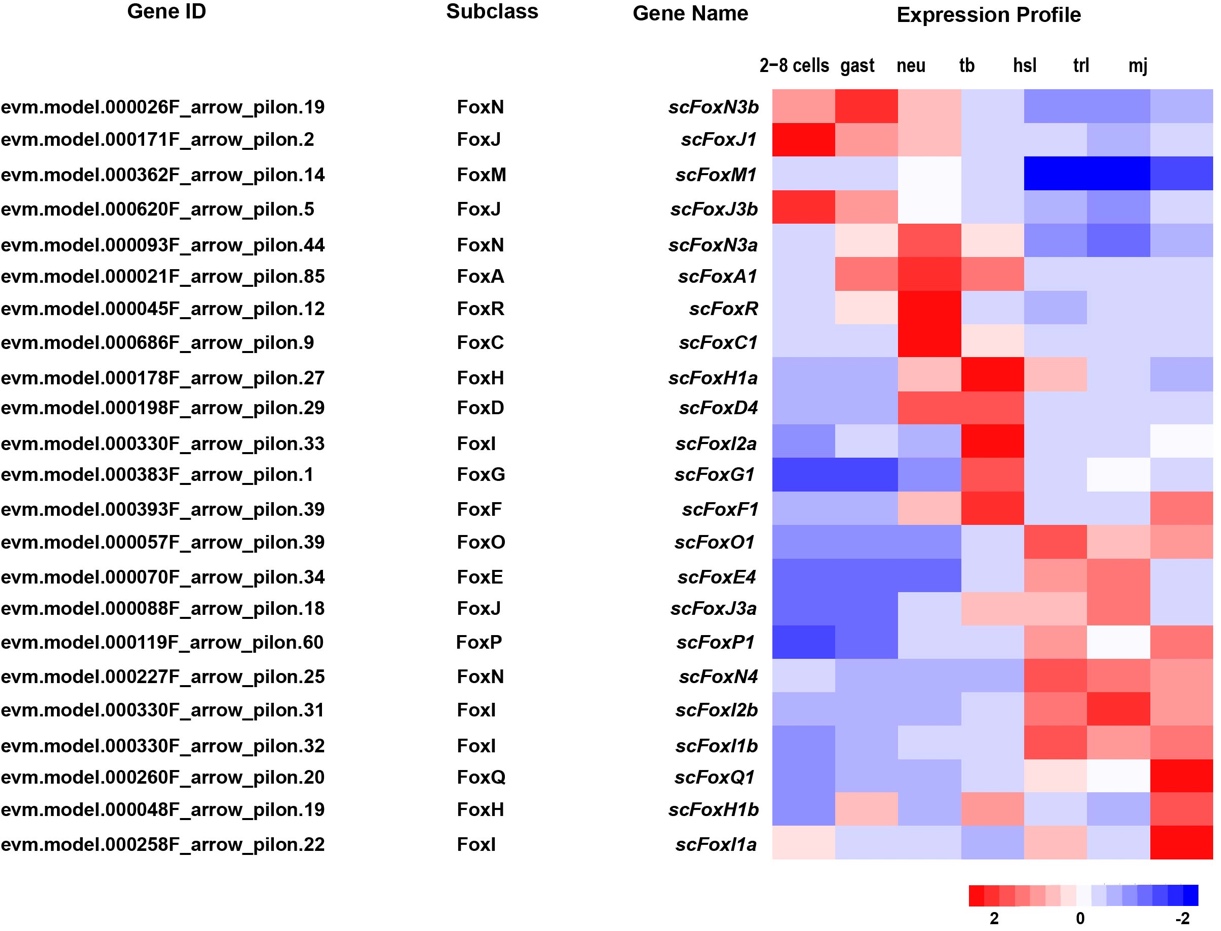
Figure 12. Identification and expression of ScFox genes in S. clava. The Gene IDs, subclasses, Gene names of 23 scfox genes are listed (left side). The expression profiles for each gene through different stages (2–8 cells, gast, neu, tb, hsl, trl, and mj stage) are shown on the right side. The scale bar indicates the centered FPKM values.
3. Discussion
Tunicates, as the closest relatives of vertebrate, show a special rates and patterns of molecular evolution [104]. Identification and analysis of important gene families were also performed, based on the sequenced genomes in several tunicate species [101][1]. In this study, we screened and identified 553 TFs in the S. clava genome and revealed their potential roles in environmental adaptation and early embryonic development, through their expression profiles.
S. clava showed a broad tolerance of environmental conditions [97]. Compared to B. floridae and C. elegans, there are more CSD TFs and immune response-related TFs, (such as IRF genes) in S. clava. CSD is a crucial characteristic of cold shock proteins (CSP), which were upregulated under the low temperature in S. clava [97]. IRF genes play an important role in immune response in C. savignyi [105][106]. The expansion of these TFs might help to improve the fitness to low temperature conditions and improve their ability of immune response to adapt to new environment.
TFs highly expressed during 2–8 cells stage is an important group that we identified in this study. Through gene ontology (GO) enrichment analysis, the biology processes of maternal TFs mainly concentrate in the response/cellular response, signaling, and regulation of biological process. More than half of TFs involved in these processes are annotated as nuclear receptors, which regulate the activation of genes and control many biological processes, such as cell proliferation, cell cycle, and metabolism [107]. For example, thyroid hormone receptor α1 (THRα1) controls the cell proliferation through the Wnt /β-catenin pathway [108]. In C. robusta, the combination of GATA and Ets induced FGF9/16/20 in the neural tissue [109][110][111][112]. TFs highly expressed during 2–8 cells stage in S. clava might act as “responders” and “signal transmitters” to control the expression of the downstream genes and regulate early embryogenesis.
Proportion of the expressed TFs had increased from 2–8 cells stage to the tb stage and was stable from the hsl stage to the mj stage. In the previous study, the different species showed very similar overall TF expression patterns, with TF expression increasing during the initial stages of development among D. rerio, C. robusta, D. melanogaster, and C. elegans [113]. We compared the TF expression between S. clava and C. robusta and found similar patterns, with TF expression increasing from 2–8 cells stage to tb stage. These results indicate that the most TFs might play a conserved role in early development.
S. clava larvae undergo metamorphosis after hatching. TFs, whose expression are significantly up-regulated after hatching might be involved into the regulation of this process. We classified those genes into two types. One is immune response TFs, which include cyclic AMP-dependent transcription factor (ATF-3), IRF1, IRF4, and B-cell lymphoma 6 (BCL6), which have strong activities in immune response regulation and maturation of the immune system [114][115][116][117]. High expression of these TFs indicates that the immune system and inflammatory reaction are involved in the metamorphosis of S. clava, and these immune responses also appeared in ascidian Boltenia villosa [67]. The others are the thyroid hormone, retinoic acid signaling TFs, and nuclear receptors, including thyroid hormone receptor alpha (THRα), vitamin D 25-hydroxylase (CYP2R1), and retinoic acid receptor alpha (RARα). Thyroid hormone and retinoic acid signaling pathways were demonstrated to be essential in the metamorphosis of S. clava [97][118]. Nuclear receptors are a superfamily of TFs that function in the regulation of various metabolic processes [107][119]. The metamorphosis process is regulated through interaction of hormone and nuclear receptors, which also existed in fishes [62]. Nuclear receptors, involved in the TH and RA signaling pathways, had potential in regulating metamorphosis in S. clava, according to the expression profiles.
Eight ScHox genes were identified in the S. clava genome and they were located in one chromosome. This was consistent with the location of Hox genes in H. roretzi, while Hox genes in genome of C. robusta were located in two chromosomes [96][99][101]. The similar location of Hox genes on the chromosome between S. clava and H. roretzi might be related to their close phylogenetic relationship [97]. Whole-cluster temporal collinearity (WTC) is a typical expression characteristic for Hox genes in vertebrate [120][121]. However, it is not applicable in tunicates. Expression profile of Hox genes in S. clava showed a subcluster temporal collinearity (STC), which was reflected in the ScHox2–4 cluster. STC was also presented in other invertebrate species, such as scallop P. yessoensis [122] and ascidian C. robusta [99]. In C. robusta, the Hox genes were spatially expressed in the central nervous system of larvae and the gut of the juvenile [99]. CrHox10 and CrHox12 play important roles in the neuronal and tail development in C. robusta [123]. These investigations suggest the potential roles of Hox genes in the development of the tail and the nervous system in S. clava.
The expression profiles of Hox1, Hox3, Hox4, Hox10, and Hox12 genes in S. clava were similar to the expression profiles of these genes in C. robusta [99]. The expression of Hox2 and Hox5 were very low in S. clava. The expression profiles of Hox13 were different between S. clava and C. robusta. ScHox13 was expressed in the tb stage, but CrHox13 was detectable only in the juvenile [99]. However, the number and distribution of Hox genes seemed not to be related to their body plan at the larval stage.
Fox genes are characterized by the highly conserved forkhead motif, which is known to be a “winged-helix” DNA-binding domain [124][125]. Fox genes play important roles in embryogenesis and metabolism [125]. A total of 22 Fox genes were identified in the genome of sea urchin [103]. Number of Fox genes in S. clava genome was nearly same as that of the sea urchin. Compared to the sea urchin, FoxE, FoxH, and FoxR subclasses in S. clava were found, and FoxI subclass was expanded, but FoxB, FoxK, and FoxL subclasses were not found. In S. clava, genes in the FoxE and FoxI subclasses were highly expressed after hatching. In vertebrates, FoxE4, FoxI1, and FoxI2 play important roles in len, otic placode, and retina formation and development, respectively [126][127][128]. ScFoxE and ScFoxI might have similar functions in the regulation of neuro and sensory organ formation.
In conclusion, we identified 553 TFs belonging to 60 TF families in the S. clava genome. The expression profiles provided a possible clue for the functions of different TF genes in embryogenesis, environmental adaptation, and metamorphosis in S. clava (Figure 13). Our study provides gene resources and a new perspective to understand the evolution and function of TFs in the leathery sea squirt.
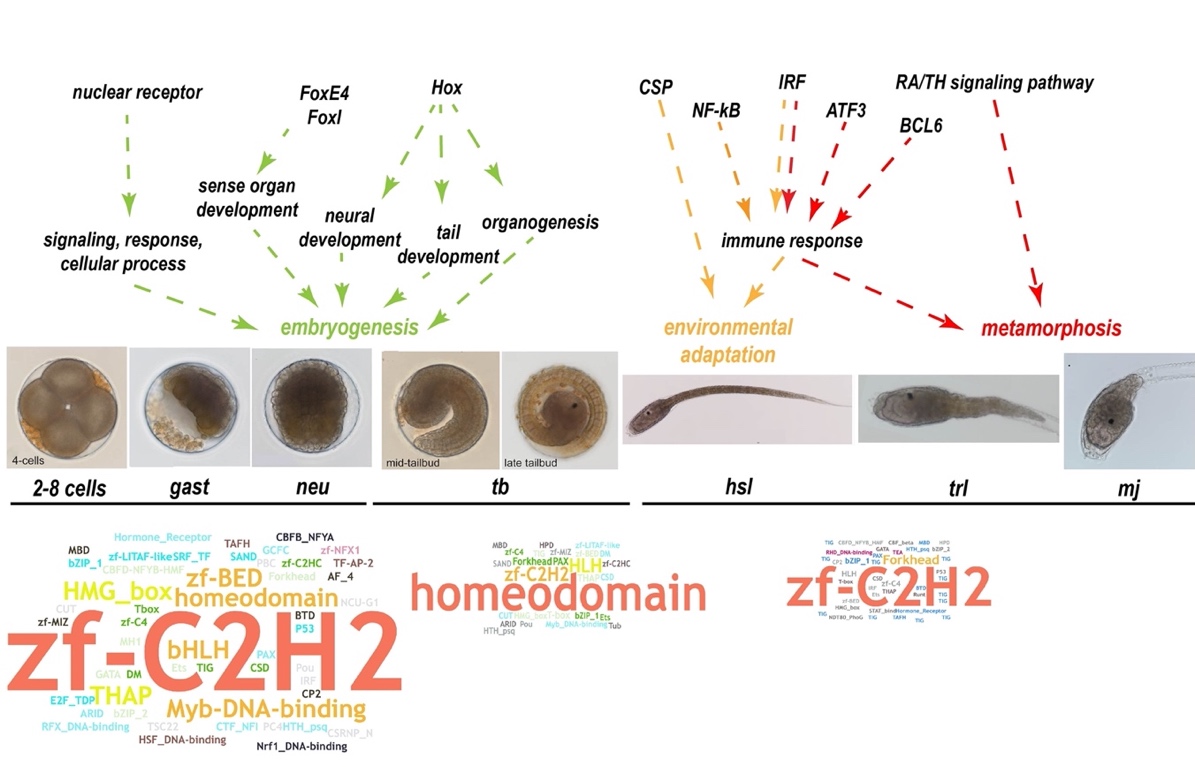
Figure 13. Summary of the TF expression and their potential roles in the embryogenesis and larval development of S. clava. Expression profiles indicates that TFs play essential roles during embryogenesis and larval development. We showed different stages of embryos at the bottom of the figure, including 2–8 cells stage, gast stage, neu stage, mid-tailbud stage, late-tailbud stage, hsl stage, trl stage, and mj stage. We summarized the predicted function of TFs genes into three parts and showed it in different colors, including embryogenesis (green), environmental adaptation (yellow), and metamorphosis (red). The word cloud pictures show the family of the expressed TF genes at different stages. The font size indicates the number of expressed TF genes in the TF families.
This entry is adapted from the peer-reviewed paper 10.3390/ijms22094317
References
- P. Dehal; The Draft Genome of Ciona intestinalis: Insights into Chordate and Vertebrate Origins. Science 2002, 298, 2157-2167, 10.1126/science.1080049.
- Yutaka Satou; Ryohei Nakamura; Deli Yu; Reiko Yoshida; Mayuko Hamada; Manabu Fujie; Kanako Hisata; Hiroyuki Takeda; Noriyuki Satoh; A Nearly Complete Genome of Ciona intestinalis Type A (C. robusta) Reveals the Contribution of Inversion to Chromosomal Evolution in the Genus Ciona. Genome Biology and Evolution 2019, 11, 3144-3157, 10.1093/gbe/evz228.
- Kerrin S Small; Michael Brudno; Matthew M Hill; Arend Sidow; A haplome alignment and reference sequence of the highly polymorphic Ciona savignyi genome. Genome Biology 2007, 8, R41-R41, 10.1186/gb-2007-8-3-r41.
- Ayelet Voskoboynik; Norma F. Neff; Debashis Sahoo; Aaron M. Newman; Dmitry Pushkarev; Winston Koh; Benedetto Passarelli; H Christina Fan; Gary L. Mantalas; Karla J. Palmeri; et al. The genome sequence of the colonial chordate, Botryllus schlosseri. eLife 2013, 2, e00569, 10.7554/elife.00569.
- Alberto Stolfi; Elijah K Lowe; Claudia Racioppi; Filomena Ristoratore; C Titus Brown; Billie J Swalla; Lionel Christiaen; Divergent mechanisms regulate conserved cardiopharyngeal development and gene expression in distantly related ascidians. eLife 2014, 3, e03728, 10.7554/elife.03728.
- Simon Blanchoud; Kim Rutherford; Lisa Zondag; Neil J. Gemmell; Megan J. Wilson; De novo draft assembly of the Botrylloides leachii genome provides further insight into tunicate evolution. Scientific Reports 2018, 8, 5518, 10.1038/s41598-018-23749-w.
- Justine Dardaillon; Delphine Dauga; Paul Simion; Emmanuel Faure; Takeshi A Onuma; Melissa B DeBiasse; Alexandra Louis; Kazuhiro R Nitta; Magali Naville; Lydia Besnardeau; et al. ANISEED 2019: 4D exploration of genetic data for an extended range of tunicates. Nucleic Acids Research 2019, 48, D668-D675, 10.1093/nar/gkz955.
- France Denoeud; Simon Henriet; Sutada Mungpakdee; Jean-Marc Aury; Corinne Da Silva; Henner Brinkmann; Jana Mikhaleva; Lisbeth Charlotte Olsen; Claire Jubin; Cristian Cañestro; et al. Plasticity of Animal Genome Architecture Unmasked by Rapid Evolution of a Pelagic Tunicate. Science 2010, 330, 1381-1385, 10.1126/science.1194167.
- H.-C. Seo; Miniature Genome in the Marine Chordate Oikopleura dioica. Science 2001, 294, 2506-2506, 10.1126/science.294.5551.2506.
- Nathaniel K. Jue; Paola G. Batta-Lona; Sarah Trusiak; Craig Obergfell; Ann Bucklin; Michael J. O’Neill; Rachel J. O’Neill; Rapid Evolutionary Rates and Unique Genomic Signatures Discovered in the First Reference Genome for the Southern Ocean Salp,Salpa thompsoni(Urochordata, Thaliacea). Genome Biology and Evolution 2016, 8, 3171-3186, 10.1093/gbe/evw215.
- Sharyn J. Goldstien; Lise Dupont; Frédérique Viard; Paul J. Hallas; Teruaki Nishikawa; David R. Schiel; Neil J. Gemmell; John D. D. Bishop; Global Phylogeography of the Widely Introduced North West Pacific Ascidian Styela clava. PLOS ONE 2011, 6, e16755, 10.1371/journal.pone.0016755.
- Gretchen Lambert; Invasive sea squirts: A growing global problem. Journal of Experimental Marine Biology and Ecology 2007, 342, 3-4, 10.1016/j.jembe.2006.10.009.
- Aibin Zhan; Elizabeta Briski; Dan G. Bock; Sara Ghabooli; Hugh J. MacIsaac; Ascidians as models for studying invasion success. Marine Biology 2015, 162, 2449-2470, 10.1007/s00227-015-2734-5.
- Martin E. Feder; Gretchen E. Hofmann; HEAT-SHOCK PROTEINS, MOLECULAR CHAPERONES, AND THE STRESS RESPONSE: Evolutionary and Ecological Physiology. Annual Review of Physiology 1999, 61, 243-282, 10.1146/annurev.physiol.61.1.243.
- Marc Rius; Steve Bourne; Harry Guy Hornsby; Mark A. Chapman; Applications of next-generation sequencing to the study of biological invasions. Current Zoology 2015, 61, 488-504, 10.1093/czoolo/61.3.488.
- Steven L. Chown; Kathryn A. Hodgins; Philippa C. Griffin; John G. Oakeshott; Margaret Byrne; Ary A. Hoffmann; Biological invasions, climate change and genomics. Evolutionary Applications 2014, 8, 23-46, 10.1111/eva.12234.
- Anthi Karaiskou; Billie J. Swalla; Yasunori Sasakura; Jean-Philippe Chambon; Metamorphosis in solitary ascidians. genesis 2014, 53, 34-47, 10.1002/dvg.22824.
- Richard A. Cloney; Ascidian Larvae and the Events of Metamorphosis. American Zoologist 1982, 22, 817-826, 10.1093/icb/22.4.817.
- Jean-Philippe Chambon; Akie Nakayama; Katsumi Takamura; Alex McDougall; Noriyuki Satoh; ERK- and JNK-signalling regulate gene networks that stimulate metamorphosis and apoptosis in tail tissues of ascidian tadpoles. Development 2007, 134, 1203-1219, 10.1242/dev.002220.
- D.-G. Shu; L. Chen; J. Han; X.-L. Zhang; An Early Cambrian tunicate from China. Nature 2001, 411, 472-473, 10.1038/35078069.
- Jun-Yuan Chen; Di-Ying Huang; Qing-Qing Peng; Hui-Mei Chi; Xiu-Qiang Wang; Man Feng; The first tunicate from the Early Cambrian of South China. Proceedings of the National Academy of Sciences 2003, 100, 8314-8318, 10.1073/pnas.1431177100.
- Edwin G. Conklin; Mosaic development in ascidian eggs. Journal of Experimental Zoology 1905, 2, 145-223, 10.1002/jez.1400020202.
- L. Dupont; F. Viard; M. J. Dowell; C. Wood; J. D. D. Bishop; Fine- and regional-scale genetic structure of the exotic ascidianStyela clava(Tunicata) in southwest England, 50 years after its introduction. Molecular Ecology 2009, 18, 442-453, 10.1111/j.1365-294x.2008.04045.x.
- S. J. Goldstien; D. R. Schiel; N. J. Gemmell; Regional connectivity and coastal expansion: differentiating pre-border and post-border vectors for the invasive tunicateStyela clava. Molecular Ecology 2010, 19, 874-885, 10.1111/j.1365-294x.2010.04527.x.
- Andrea Locke; J. Mark Hanson; Karla M. Ellis; Jason Thompson; Rémy Rochette; Invasion of the southern Gulf of St. Lawrence by the clubbed tunicate (Styela clava Herdman): Potential mechanisms for invasions of Prince Edward Island estuaries. Journal of Experimental Marine Biology and Ecology 2007, 342, 69-77, 10.1016/j.jembe.2006.10.016.
- Chen-Shan Chin; Paul Peluso; Fritz J. Sedlazeck; Maria Nattestad; Gregory T. Concepcion; Alicia Clum; Christopher Dunn; Ronan O'malley; Rosa Figueroa-Balderas; Abraham Morales-Cruz; et al. Phased Diploid Genome Assembly with Single Molecule Real-Time Sequencing. null 2016, 13, 056887, 10.1101/056887.
- Felipe A. Simão; Robert M. Waterhouse; Panagiotis Ioannidis; Evgenia V. Kriventseva; Evgeny M. Zdobnov; BUSCO: assessing genome assembly and annotation completeness with single-copy orthologs. Bioinformatics 2015, 31, 3210-3212, 10.1093/bioinformatics/btv351.
- Dario Colombera; The chromosomes of Ascidians. Bolletino di zoologia 1971, 38, 187-191, 10.1080/11250007109436972.
- D. Colombera; Chromosome number within the class Ascidiacea. Marine Biology 1974, 26, 63-68, 10.1007/bf00389087.
- K M Taylor; The chromosomes of some lower chordates.. Chromosoma 1967, 21, 181-188, .
- Oleg Simakov; Takeshi Kawashima; Ferdinand Marlétaz; Jerry Jenkins; Ryo Koyanagi; Therese Mitros; Kanako Hisata; Jessen Bredeson; Eiichi Shoguchi; Fuki Gyoja; et al. Hemichordate genomes and deuterostome origins. Nature 2015, 527, 459-465, 10.1038/nature16150.
- Frédéric Delsuc; Hervé Philippe; Georgia Tsagkogeorga; Paul Simion; Marie-Ka Tilak; Xavier Turon; Susanna López-Legentil; Jacques Piette; Patrick Lemaire; Emmanuel J. P. Douzery; et al. A phylogenomic framework and timescale for comparative studies of tunicates. BMC Biology 2018, 16, 1-14, 10.1186/s12915-018-0499-2.
- Domitille Chalopin; Magali Naville; Floriane Plard; Delphine Galiana; Jean-Nicolas Volff; Comparative Analysis of Transposable Elements Highlights Mobilome Diversity and Evolution in Vertebrates. Genome Biology and Evolution 2015, 7, 567-580, 10.1093/gbe/evv005.
- Magali Naville; Simon Henriet; Ian Warren; Sara Sumic; Magnus Reeve; Jean-Nicolas Volff; Daniel Chourrout; Massive Changes of Genome Size Driven by Expansions of Non-autonomous Transposable Elements. Current Biology 2019, 29, 1161-1168.e6, 10.1016/j.cub.2019.01.080.
- Nathan J. Bowen; Drosophila Euchromatic LTR Retrotransposons are Much Younger Than the Host Species in Which They Reside. Genome Research 2001, 11, 1527-1540, 10.1101/gr.164201.
- Martin Carr; Hiroshi Suga; The Holozoan Capsaspora owczarzaki Possesses a Diverse Complement of Active Transposable Element Families. Genome Biology and Evolution 2014, 6, 949-963, 10.1093/gbe/evu068.
- Jessica Stapley; Anna W. Santure; Stuart R. Dennis; Transposable elements as agents of rapid adaptation may explain the genetic paradox of invasive species. Molecular Ecology 2015, 24, 2241-2252, 10.1111/mec.13089.
- Guofan Zhang; Xiaodong Fang; Ximing Guo; Li Li; Ruibang Luo; Fei Xu; Pengcheng Yang; Linlin Zhang; Xiaotong Wang; Haigang Qi; et al. The oyster genome reveals stress adaptation and complexity of shell formation. Nature 2012, 490, 49-54, 10.1038/nature11413.
- Tetsuya Fujikawa; Takeo Munakata; Shin-Ichi Kondo; Nori Satoh; Shuichi Wada; Stress response in the ascidian Ciona intestinalis: transcriptional profiling of genes for the heat shock protein 70 chaperone system under heat stress and endoplasmic reticulum stress. Cell Stress and Chaperones 2009, 15, 193-204, 10.1007/s12192-009-0133-x.
- Loredana Serafini; Jay B. Hann; Dietmar Kültz; Lars Tomanek; The proteomic response of sea squirts (genus Ciona) to acute heat stress: A global perspective on the thermal stability of proteins. Comparative Biochemistry and Physiology Part D: Genomics and Proteomics 2011, 6, 322-334, 10.1016/j.cbd.2011.07.002.
- Xuena Huang; Shiguo Li; Yangchun Gao; Aibin Zhan; Genome-Wide Identification, Characterization and Expression Analyses of Heat Shock Protein-Related Genes in a Highly Invasive Ascidian Ciona savignyi. Frontiers in Physiology 2018, 9, 1043, 10.3389/fphys.2018.01043.
- Xuena Huang; Shiguo Li; Aibin Zhan; Genome-Wide Identification and Evaluation of New Reference Genes for Gene Expression Analysis Under Temperature and Salinity Stresses in Ciona savignyi. Frontiers in Genetics 2019, 10, 71, 10.3389/fgene.2019.00071.
- Shannon M. Soucy; Jinling Huang; Johann Peter Gogarten; Horizontal gene transfer: building the web of life. Nature Reviews Genetics 2015, 16, 472-482, 10.1038/nrg3962.
- Charles Kurland; Björn Canbäck; Otto G. Berg; Horizontal gene transfer: A critical view. Proceedings of the National Academy of Sciences 2003, 100, 9658-9662, 10.1073/pnas.1632870100.
- Ting Ni; Jipei Yue; Guiling Sun; Yong Zou; Jianfan Wen; Jinling Huang; Ancient gene transfer from algae to animals: Mechanisms and evolutionary significance. BMC Evolutionary Biology 2012, 12, 83-83, 10.1186/1471-2148-12-83.
- Punit Bhattachan; Bo Dong; Origin and evolutionary implications of introns from analysis of cellulose synthase gene. Journal of Systematics and Evolution 2017, 55, 142-148, 10.1111/jse.12235.
- Ann G. Matthysse; Karine Deschet; Melanie Williams; Mazz Marry; Alan R. White; William C. Smith; A functional cellulose synthase from ascidian epidermis. Proceedings of the National Academy of Sciences 2004, 101, 986-991, 10.1073/pnas.0303623101.
- Yoshimasa Sagane; Karin Zech; Jean-Marie Bouquet; Martina Schmid; Ugur Bal; Eric M. Thompson; Functional specialization of cellulose synthase genes of prokaryotic origin in chordate larvaceans. Development 2010, 137, 1483-1492, 10.1242/dev.044503.
- G. Horn; R. Hofweber; Werner Kremer; Hans Robert Kalbitzer; Structure and function of bacterial cold shock proteins. Cellular and Molecular Life Sciences 2007, 64, 1457-1470, 10.1007/s00018-007-6388-4.
- Marija Mihailovich; Cristina Militti; Toni Gabaldón; Fátima Gebauer; Eukaryotic cold shock domain proteins: highly versatile regulators of gene expression. BioEssays 2010, 32, 109-118, 10.1002/bies.200900122.
- Michael Ladomery; John Sommerville; Binding of Y-box proteins to RNA: involvement of different protein domains. Nucleic Acids Research 1994, 22, 5582-5589, 10.1093/nar/22.25.5582.
- Euichi Hirose; S-I Ohtake; K Azumi; Morphological characterization of the tunic in the edible ascidian,Halocynthia roretzi(Drasche), with remarks on ‘soft tunic syndrome’ in aquaculture. Journal of Fish Diseases 2009, 32, 433-445, 10.1111/j.1365-2761.2009.01034.x.
- Yadong Zhao; Jiebing Li; Excellent chemical and material cellulose from tunicates: diversity in cellulose production yield and chemical and morphological structures from different tunicate species. Cellulose 2014, 21, 3427-3441, 10.1007/s10570-014-0348-6.
- Euichi Hirose; Satoshi Kimura; Takao Itoh; Jun Nishikawa; Takao ItohJun Nishikawa; Tunic Morphology and Cellulosic Components of Pyrosomas, Doliolids, and Salps (Thaliacea, Urochordata). The Biological Bulletin 1999, 196, 113-120, 10.2307/1543173.
- Jun Inoue; Keisuke Nakashima; Noriyuki Satoh; ORTHOSCOPE Analysis Reveals the Presence of the Cellulose Synthase Gene in All Tunicate Genomes but Not in Other Animal Genomes.. Genes 2019, 10, 294, 10.3390/genes10040294.
- S. Kimura; C. Ohshima; E. Hirose; J. Nishikawa; T. Itoh; Cellulose in the house of the appendicularian Oikopleura rufescens.. Protoplasma 2001, 216, 71-74, 10.1007/bf02680133.
- Ranby, B. G.; Physico‐chemical investinations on animal cellulose (Tunicin). Arkiv for Kemi 1952, 4, 241-248, .
- Yadong Zhao; Jiebing Li; Ascidian bioresources: common and variant chemical compositions and exploitation strategy – examples of Halocynthia roretzi, Styela plicata, Ascidia sp. and Ciona intestinalis. Zeitschrift für Naturforschung C 2016, 71, 165-180, 10.1515/znc-2016-0012.
- Carsten Rautengarten; Berit Ebert; Ignacio Moreno; Henry Temple; Thomas Herter; Bruce Link; Daniela Doñas-Cofré; Adrián Moreno; Susana Saéz-Aguayo; Francisca Blanco; et al. The Golgi localized bifunctional UDP-rhamnose/UDP-galactose transporter family of Arabidopsis. Proceedings of the National Academy of Sciences 2014, 111, 11563-11568, 10.1073/pnas.1406073111.
- Boopathy Ramakrishnan; Elizabeth Boeggeman; Structure and Function of β -1,4-Galactosyltransferase. Current Drug Targets 2008, 9, 292-309, 10.2174/138945008783954943.
- Vincent Laudet; The Origins and Evolution of Vertebrate Metamorphosis. Current Biology 2011, 21, R726-R737, 10.1016/j.cub.2011.07.030.
- Changwei Shao; Baolong Bao; Zhiyuan Xie; Xinye Chen; Bo Li; Xiaodong Jia; Qiulin Yao; Guillermo Ortí; Wenhui Li; Xihong Li; et al. The genome and transcriptome of Japanese flounder provide insights into flatfish asymmetry. Nature Genetics 2016, 49, 119-124, 10.1038/ng.3732.
- Donald D. Brown; The role of thyroid hormone in zebrafish and axolotl development. Proceedings of the National Academy of Sciences 1997, 94, 13011-13016, 10.1073/pnas.94.24.13011.
- Pierre Germain; Jaya Iyer; Christina Zechel; Hinrich Gronemeyer; Co-regulator recruitment and the mechanism of retinoic acid receptor synergy. Nature 2002, 415, 187-192, 10.1038/415187a.
- Virginie Nahoum; Efrén Pérez; Pierre Germain; Fátima Rodríguez-Barrios; Fabio Manzo; Sabrina Kammerer; Geraldine Lemaire; Oliver Hirsch; Catherine A. Royer; Hinrich Gronemeyer; et al. Modulators of the structural dynamics of the retinoid X receptor to reveal receptor function. Proceedings of the National Academy of Sciences 2007, 104, 17323-17328, 10.1073/pnas.0705356104.
- Masaru Nonaka; Ayuko Kimura; Genomic view of the evolution of the complement system. Immunogenetics 2006, 58, 701-713, 10.1007/s00251-006-0142-1.
- Brad Davidson; Billie J. Swalla; A molecular analysis of ascidian metamorphosis reveals activation of an innate immune response. Development 2002, 129, 4739-4751, 10.1242/dev.129.20.4739.
- B D Packard; J M Weiler; Steroids inhibit activation of the alternative-amplification pathway of complement.. Infection and Immunity 1983, 40, 1011-1014, 10.1128/iai.40.3.1011-1014.1983.
- Andrea Pasini; Raoul Manenti; Ute Rothbächer; Patrick Lemaire; Antagonizing Retinoic Acid and FGF/MAPK Pathways Control Posterior Body Patterning in the Invertebrate Chordate Ciona intestinalis. PLOS ONE 2012, 7, e46193, 10.1371/journal.pone.0046193.
- Samuel A. Lambert; Arttu Jolma; Laura F. Campitelli; Pratyush K. Das; Yimeng Yin; Mihai Albu; Xiaoting Chen; Jussi Taipale; Timothy R. Hughes; Matthew T. Weirauch; et al. The Human Transcription Factors. Cell 2018, 172, 650-665, 10.1016/j.cell.2018.01.029.
- P J Mitchell; R Tjian; Transcriptional regulation in mammalian cells by sequence-specific DNA binding proteins. Science 1989, 245, 371-378, 10.1126/science.2667136.
- Gill Bejerano; Michael Pheasant; Igor Makunin; Stuart Stephen; W. James Kent; John S. Mattick; David Haussler; Ultraconserved Elements in the Human Genome. Science 2004, 304, 1321-1325, 10.1126/science.1098119.
- Sean B. Carroll; Evo-Devo and an Expanding Evolutionary Synthesis: A Genetic Theory of Morphological Evolution. Cell 2008, 134, 25-36, 10.1016/j.cell.2008.06.030.
- Tong Ihn Lee; Richard A. Young; Transcriptional Regulation and Its Misregulation in Disease. Cell 2013, 152, 1237-1251, 10.1016/j.cell.2013.02.014.
- H H Arnold; T Braun; The role of Myf-5 in somitogenesis and the development of skeletal muscles in vertebrates.. Journal of Cell Science 1993, 104, 957-60, .
- Peter, J; Nuclear Factor-kB—A pivotal transcription factor in chronic inflammatory diseases. Mech. Dis 1997, 336, 1066-1071, .
- Moisés Mallo; Reassessing the Role of Hox Genes during Vertebrate Development and Evolution. Trends in Genetics 2018, 34, 209-217, 10.1016/j.tig.2017.11.007.
- Wang, K.; Nishida, H; REGULATOR: A database of metazoan transcription factors and maternal factors for developmental studies.. BMC Bioinform 2015, 16, 114, .
- Hu, H.; Miao, Y.R.; Jia, L.H.; Yu, Q.Y.; Zhang, Q.; Guo, A.Y.; AnimalTFDB 3.0: A comprehensive resource for annotation and prediction of animal transcription factors. . Nucleic Acids Res 2019, 47, D33-D38, .
- Chiba, S.; Awazu, S.; Itoh, M.; Chin-Bow, S.T.; Satoh, N.; Satou, Y.; Hastings, K.E.; A genomewide survey of developmentally relevant genes in Ciona intestinalis. IX. Genes for muscle structural proteins. . Dev. Genes Evol. 2003, 213, 291-302, .
- Kyosuke Hino; Yutaka Satou; Kasumi Yagi; Nori Satoh; A genomewide survey of developmentally relevant genes in Ciona intestinalis. Development Genes and Evolution 2003, 213, 264-272, 10.1007/s00427-003-0318-8.
- Yagi, K.; Satou, Y.; Mazet, F.; Shimeld, S.M.; Degnan, B.; Rokhsar, D.; Levine, M.; Kohara, Y.; Satoh, N.; A genomewide survey of developmentally relevant genes in Ciona intestinalis. III. Genes for Fox, ETS, nuclear receptors and NFkappaB.. Dev. Genes Evol. 2003, 213, 235-244, .
- Yamada, L.; Kobayashi, K.; Degnan, B.; Satoh, N.; Satou, Y.; A genomewide survey of developmentally relevant genes in Ciona intestinalis. IV. Genes for HMG transcriptional regulators, bZip and GATA/Gli/Zic/Snail.. Dev. Genes Evol. 2003, 213, 245-253, .
- Kaoru S. Imai; Kyosuke Hino; Kasumi Yagi; Nori Satoh; Yutaka Satou; Gene expression profiles of transcription factors and signaling molecules in the ascidian embryo: towards a comprehensive understanding of gene networks. Development 2004, 131, 4047-4058, 10.1242/dev.01270.
- Kyoko Miwata; Takuto Chiba; Reiko Horii; Lixy Yamada; Atsushi Kubo; Daisuke Miyamura; Nori Satoh; Yutaka Satou; Systematic analysis of embryonic expression profiles of zinc finger genes in Ciona intestinalis. Developmental Biology 2006, 292, 546-554, 10.1016/j.ydbio.2006.01.024.
- Lavanya Katikala; Hitoshi Aihara; Yale J. Passamaneck; Stefan Gazdoiu; Diana S. José-Edwards; Jamie E. Kugler; Izumi Oda-Ishii; Janice H. Imai; Yutaka Nibu; Anna Di Gregorio; et al. Functional Brachyury Binding Sites Establish a Temporal Read-out of Gene Expression in the Ciona Notochord. PLOS Biology 2013, 11, e1001697, 10.1371/journal.pbio.1001697.
- Anna Di Gregorio; The notochord gene regulatory network in chordate evolution: Conservation and divergence from Ciona to vertebrates. Current Topics in Developmental Biology 2020, 139, 325-374, 10.1016/bs.ctdb.2020.01.002.
- Hitoyoshi Yasuo; Noriyuki Satoh; An Ascidian Homolog of the Mouse Brachyury (T) Gene is Expressed Exclusively in Notochord Cells at the Fate Restricted Stage. (Ascidians/T (Brachyury) gene/sequence conservation/notochord cells/transient expression). Development, Growth & Differentiation 1994, 36, 9-18, 10.1111/j.1440-169x.1994.00009.x.
- J C Corbo; M Levine; R W Zeller; Characterization of a notochord-specific enhancer from the Brachyury promoter region of the ascidian, Ciona intestinalis.. Development 1997, 124, 589-602, .
- Diana S. José-Edwards; Pierre Kerner; Jamie E. Kugler; Wei Deng; Di Jiang; Anna Di Gregorio; The identification of transcription factors expressed in the notochord of Ciona intestinalis adds new potential players to the brachyury gene regulatory network. Developmental Dynamics 2011, 240, 1793-1805, 10.1002/dvdy.22656.
- Diana S. José-Edwards; Izumi Oda-Ishii; Yutaka Nibu; Anna Di Gregorio; Tbx2/3 is an essential mediator within the Brachyury gene network during Ciona notochord development. Development 2013, 140, 2422-2433, 10.1242/dev.094227.
- Kaoru S Imai; Nori Satoh; Yutaka Satou; An essential role of a FoxD gene in notochord induction in Ciona embryos.. Development 2002, 129, 3441-3453, .
- Kasumi Yagi; Yutaka Satou; Nori Satoh; A zinc finger transcription factor, ZicL, is a direct activator of Brachyury in the notochord specification of Ciona intestinalis. Development 2004, 131, 1279-1288, 10.1242/dev.01011.
- Kaoru S Imai; Yutaka Satou; Nori Satoh; Multiple functions of a Zic-like gene in the differentiation of notochord, central nervous system and muscle in Ciona savignyi embryos.. Development 2002, 129, 2723-2732, .
- Derek Lemons; Genomic Evolution of Hox Gene Clusters. Science 2006, 313, 1918-1922, 10.1126/science.1132040.
- Melissa B DeBiasse; William N Colgan; Lincoln Harris; Bradley Davidson; Joseph F Ryan; Inferring Tunicate Relationships and the Evolution of the Tunicate Hox Cluster with the Genome of Corella inflata. Genome Biology and Evolution 2020, 12, 948-964, 10.1093/gbe/evaa060.
- Jiankai Wei; Jin Zhang; Qiongxuan Lu; Ping Ren; Xin Guo; Jing Wang; Xiang Li; Yaoguang Chang; Shuai Duan; Shi Wang; et al. Genomic basis of environmental adaptation in the leathery sea squirt ( Styela clava ). Molecular Ecology Resources 2020, 20, 1414-1431, 10.1111/1755-0998.13209.
- Peter Langfelder, Steve Horvath; WGCNA: an R package for weighted correlation network analysis. BMC Bioinformatics 2008, 9, 559, .
- Tetsuro Ikuta; Natsue Yoshida; Nori Satoh; Hidetoshi Saiga; Ciona intestinalis Hox gene cluster: Its dispersed structure and residual colinear expression in development. Proceedings of the National Academy of Sciences 2004, 101, 15118-15123, 10.1073/pnas.0401389101.
- Hee-Chan Seo; Rolf Brudvik Edvardsen; Anne Dorthea Maeland; Marianne Bjordal; Marit Flo Jensen; Anette Hansen; Mette Flaat; Jean Weissenbach; Hans Lehrach; Patrick Wincker; et al. Hox cluster disintegration with persistent anteroposterior order of expression in Oikopleura dioica. Nature 2004, 431, 67-71, 10.1038/nature02709.
- Yuka Sekigami; Takuya Kobayashi; Ai Omi; Koki Nishitsuji; Tetsuro Ikuta; Asao Fujiyama; Noriyuki Satoh; Hidetoshi Saiga; Hox gene cluster of the ascidian, Halocynthia roretzi, reveals multiple ancient steps of cluster disintegration during ascidian evolution. Zoological Letters 2017, 3, 17, 10.1186/s40851-017-0078-3.
- Shaoxuan Wu; Yang Zhang; Yajuan Li; Huilan Wei; Zhenyi Guo; Shi Wang; Lingling Zhang; Zhenmin Bao; Identification and expression profiles of Fox transcription factors in the Yesso scallop (Patinopecten yessoensis). Gene 2020, 733, 144387, 10.1016/j.gene.2020.144387.
- Qiang Tu; C. Titus Brown; Eric H. Davidson; Paola Oliveri; Sea urchin Forkhead gene family: Phylogeny and embryonic expression. Developmental Biology 2006, 300, 49-62, 10.1016/j.ydbio.2006.09.031.
- Luisa Berná; Fernando Alvarez-Valin; Evolutionary Genomics of Fast Evolving Tunicates. Genome Biology and Evolution 2014, 6, 1724-1738, 10.1093/gbe/evu122.
- Hiroaki Ikushima; Hideo Negishi; Tadatsugu Taniguchi; The IRF Family Transcription Factors at the Interface of Innate and Adaptive Immune Responses. Cold Spring Harbor Symposia on Quantitative Biology 2013, 78, 105-116, 10.1101/sqb.2013.78.020321.
- Zhaoxuan Zhang; Jiankai Wei; Ruimei Ren; XiaoMing Zhang; Anti-virus effects of interferon regulatory factors (IRFs) identified in ascidian Ciona savignyi. Fish & Shellfish Immunology 2020, 106, 273-282, 10.1016/j.fsi.2020.07.059.
- Sever, R.; Glass, C.K; Signaling by Nuclear Receptors. Biochemistry of Signal Transduction and Regulation 2014, 5, 251-290, 10.1002/9783527667475.ch06.
- Michelina Plateroti; Elsa Kress; Jun Ichirou Mori; Jacques Samarut; Thyroid Hormone Receptor α1 Directly Controls Transcription of the β-Catenin Gene in Intestinal Epithelial Cells. Molecular and Cellular Biology 2006, 26, 3204-3214, 10.1128/mcb.26.8.3204-3214.2006.
- Vincent Bertrand; Clare Hudson; Danielle Caillol; Cornel Popovici; Patrick Lemaire; Neural Tissue in Ascidian Embryos Is Induced by FGF9/16/20, Acting via a Combination of Maternal GATA and Ets Transcription Factors. Cell 2003, 115, 615-627, 10.1016/s0092-8674(03)00928-0.
- Takahito Miya; Hiroki Nishida; An Ets transcription factor, HrEts, is target of FGF signaling and involved in induction of notochord, mesenchyme, and brain in ascidian embryos. Developmental Biology 2003, 261, 25-38, 10.1016/s0012-1606(03)00246-x.
- Kohji Hotta; Hiroki Takahashi; Nori Satoh; Takashi Gojobori; Brachyury-downstream gene sets in a chordate, Ciona intestinalis: integrating notochord specification, morphogenesis and chordate evolution. Evolution & Development 2008, 10, 37-51, 10.1111/j.1525-142x.2007.00212.x.
- T. Blair Gainous; Eileen Wagner; Michael Levine; Diverse ETS transcription factors mediate FGF signaling in the Ciona anterior neural plate. Developmental Biology 2015, 399, 218-225, 10.1016/j.ydbio.2014.12.032.
- Alicia N. Schep; Boris Adryan; A Comparative Analysis of Transcription Factor Expression during Metazoan Embryonic Development. PLOS ONE 2013, 8, e66826, 10.1371/journal.pone.0066826.
- Hongbo Wang; Pingli Mo; Shumei Ren; Chunhong Yan; Activating Transcription Factor 3 Activates p53 by Preventing E6-associated Protein from Binding to E6. Journal of Biological Chemistry 2010, 285, 13201-13210, 10.1074/jbc.m109.058669.
- Lei Dou; Hui-Fang Liang; David A. Geller; Yi-Fa Chen; Xiao-Ping Chen; The regulation role of interferon regulatory factor-1 gene and clinical relevance. Human Immunology 2014, 75, 1110-1114, 10.1016/j.humimm.2014.09.015.
- Sorim Nam; Jong-Seok Lim; Essential role of interferon regulatory factor 4 (IRF4) in immune cell development. Archives of Pharmacal Research 2016, 39, 1548-1555, 10.1007/s12272-016-0854-1.
- Roza I. Nurieva; Yeonseok Chung; Gustavo J. Martinez; Xuexian O. Yang; Shinya Tanaka; Tatyana D. Matskevitch; Yi-Hong Wang; Chen Dong; Bcl6 Mediates the Development of T Follicular Helper Cells. Science 2009, 325, 1001-1005, 10.1126/science.1176676.
- A. Catharine Ross; Reza Zolfaghari; Cytochrome P450s in the Regulation of Cellular Retinoic Acid Metabolism. Annual Review of Nutrition 2011, 31, 65-87, 10.1146/annurev-nutr-072610-145127.
- Nikolenko, J.V.; Krasnov, A.N.; Nuclear receptors: Structure and mechanisms of action.. Russ. J. Genet 2007, 43, 234-240, .
- J C Izpisúa-Belmonte; H Falkenstein; P Dollé; A Renucci; D Duboule; Murine genes related to the Drosophila AbdB homeotic genes are sequentially expressed during development of the posterior part of the body.. The EMBO Journal 1991, 10, 2279-89, .
- Juan Pascual-Anaya; Iori Sato; Fumiaki Sugahara; Shinnosuke Higuchi; Jordi Paps; Yandong Ren; Wataru Takagi; Adrián Ruiz-Villalba; Kinya G. Ota; Wen Wang; et al. Hagfish and lamprey Hox genes reveal conservation of temporal colinearity in vertebrates. Nature Ecology & Evolution 2018, 2, 859-866, 10.1038/s41559-018-0526-2.
- Shi Wang; Jinbo Zhang; Wenqian Jiao; Ji Li; Xiaogang Xun; Yan Sun; Ximing Guo; Liao Huan; Bo Dong; Lingling Zhang; et al. Scallop genome provides insights into evolution of bilaterian karyotype and development. Nature Ecology & Evolution 2017, 1, 120-120, 10.1038/s41559-017-0120.
- Tetsuro Ikuta; Nori Satoh; Hidetoshi Saiga; Limited functions of Hox genes in the larval development of the ascidian Ciona intestinalis. Development 2010, 137, 1505-1513, 10.1242/dev.046938.
- Detlef Weigel; Gerd Jürgens; Frank Küttner; Eveline Seifert; Herbert Jäckle; The homeotic gene fork head encodes a nuclear protein and is expressed in the terminal regions of the Drosophila embryo. Cell 1989, 57, 645-658, 10.1016/0092-8674(89)90133-5.
- Peter Carlsson; Margit Mahlapuub; Forkhead Transcription Factors: Key Players in Development and Metabolism. Developmental Biology 2002, 250, 1-23, 10.1006/dbio.2002.0780.
- Solomon, K.S.; Kudoh, T.; Dawid, I.B.; Fritz, A.; A. Zebrafish foxi1 mediates otic placode formation and jaw development.. Development 2003, 130, 929-940, .
- Keely S. Solomon; John M. Logsdon; Andreas Fritz; Expression and phylogenetic analyses of three zebrafish FoxI class genes. Developmental Dynamics 2003, 228, 301-307, 10.1002/dvdy.10373.
- Carolyn Zilinski; Isaac Brownell; Ryuju Hashimoto; Olga Medina-Martinez; Eric C. Swindell; Milan Jamrich; Expression of FoxE4 and Rx Visualizes the Timing and Dynamics of Critical Processes Taking Place during Initial Stages of Vertebrate Eye Development. Developmental Neuroscience 2004, 26, 294-307, 10.1159/000082271.
- B D Packard; J M Weiler; Steroids inhibit activation of the alternative-amplification pathway of complement.. Infection and Immunity 1983, 40, 1011-1014, 10.1128/iai.40.3.1011-1014.1983.
- Andrea Pasini; Raoul Manenti; Ute Rothbächer; Patrick Lemaire; Antagonizing Retinoic Acid and FGF/MAPK Pathways Control Posterior Body Patterning in the Invertebrate Chordate Ciona intestinalis. PLOS ONE 2012, 7, e46193, 10.1371/journal.pone.0046193.