The biological impact of long non-coding RNAs (lncRNAs) in multiple myeloma (MM) is becoming an important aspect of investigation, which may contribute to the understanding of the complex pathobiology of the disease whilst also providing novel potential therapeutic targets. Herein, we investigated the pathobiological role of ST3GAL6-AS1 (ST3 beta-galactoside alpha-2,3 sialyltransferase 6 antisense RNA 1), a lncRNA mapped at chromosome 3q11.2 antisense to ST3GAL6 (ST3 Beta-Galactoside Alpha-2,3-Sialyltransferase 6), a gene that has been recently reported as involved in homing and in in vivo engraftment in MM.
- lncRNA
- ST3GAL6-AS1
- multiple myeloma
1. Introduction
Multiple myeloma (MM) is a malignant proliferation of bone marrow plasma cells (PCs) characterized by a heterogeneous clinical course, ranging from the pre-malignant condition called monoclonal gammopathy of undetermined significance (MGUS), to smoldering MM (sMM), truly overt and symptomatic MM, and extra-medullary myeloma/plasma cell leukemia (PCL). MM is also characterized by a highly heterogeneous genetic background with both structural chromosomal aberrations and specific gene mutations [1].
Long non-coding RNAs (lncRNAs) form a group of non-protein coding RNAs longer than 200 nucleotides, representing more than half of the mammalian non-coding transcriptome [2], the estimated number of which exceeding 120,000. LncRNAs are involved in many biological processes, such as cell proliferation, apoptosis, cellular differentiation, tumorigenesis and metastasis [2][3]. Recent findings indicate that the deregulation of lncRNAs is emerging as a new paradigm in cancer [4]. Several lncRNAs have been reported to be putatively involved in MM tumor biology and our knowledge of their function is progressively expanding [5][6][7][8][9]; however, at the moment only a few of them have been functionally investigated, including MALAT1 [10][11][12], NEAT1 [13][14], CCAT1 [15] and H19 [16][17]. MALAT1 was found upregulated during the disease progression, with the higher expression levels associated with shorter OS and PFS [11]. In details, MALAT1 interacts with EZH2 to regulate KEAP1 expression, triggering a KEAP1-dependent induction of NRF1/2, which are relevant transcriptional activators of proteasome subunit genes [10]. In addition, our group provided evidence of MALAT1 druggability using LNA-gapmeRs ASOs in vitro and in vivo in NOD-SCID mice bearing MM xenografts [10]. Hu et al. reported that MALAT1 acts as a scaffold in the formation of PARP1/LIG3 complexes that activate the alternative non-homologous end joining (A-NHEJ) DNA repair in MM cells; moreover, its inhibition can synergize both with PARP and proteasome inhibitors [12]. Concerning NEAT1, it was found upregulated in primary MM cells [14], where it plays a key role in maintenance of genomic stability and DNA repair [13]. Of translational relevance, NEAT1 targeting antagonized growth of MM cells in NOD SCID mice and synergized with conventional and novel anti-MM drugs [13].
Herein, we investigated the pathobiological role of ST3GAL6-AS1 (ST3 beta-galactoside alpha-2,3 sialyltransferase 6 antisense RNA 1), a lncRNA mapped at chromosome 3q11.2 antisense to ST3GAL6 (ST3 Beta-Galactoside Alpha-2,3-Sialyltransferase 6), a gene that has been recently reported as involved in homing and in in vivo engraftment in MM [18]. A recent study in a limited cohort of MM patients, pointed out the overexpression of ST3GAL6-AS1 compared to normal controls, suggesting a putative oncogenic role [19]. However, in colorectal cancer, ST3GAL6-AS1 was reported to act as tumor suppressor through the transcriptional regulation of its neighboring gene ST3GAL6 [20].
2. LncRNA ST3GAL6-AS1 is Overexpressed in MM Patients
With the aim of identifying lncRNAs deregulated in MM, we investigated their expression pattern in a proprietary database (#GSE116294) recently reported by us [14], including four normal controls, 50 MM patients at diagnosis and six secondary PCL (sPCL) profiled on the GeneChip® Human Gene 2.0 ST array. Although limited in number, the cohort of MM was representative of the major molecular types of the disease (Table S1, supplementary could be found in https://www.mdpi.com/2072-6694/12/4/782)To this end, we evaluated the expression of 10,500 lncRNAs detectable by the arrays, annotated on unambiguous entries in GENCODE encyclopedia (V32). We identified 31 lncRNAs showing highly significant differential expression between normal bone marrow PCs and MM patients (Figure 1a and Table S2).
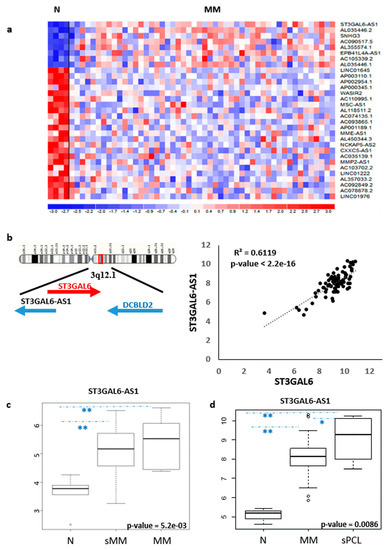
Figure 1. Identification of lncRNAs deregulated in MM patients. (a) Heatmap of the 31 differentially expressed lncRNAs in 50 MM patients as compared to four normal bone marrow PC controls (patients in columns, lncRNAs in rows). The color scale bar represents the relative lncRNA expression changes normalized by the standard deviation. (b) Genomic context of ST3GAL6-AS1; Pearson’s correlation analysis of ST3GAL6 (x-axis) and ST3GAL6-AS1 (y-axis) expression levels. Correlation coefficient R and significant p-value are reported. (c) Boxplot of ST3GAL6-AS1 expression in five normal controls, 21 sMM and 10 MM samples (** p < 0.01). (d) Boxplot of ST3GAL6-AS1 expression in four normal controls, 50 MM, and six sPCL samples (* p < 0.05, ** p < 0.01).
Notably, the most significantly upregulated lncRNA in our series was ST3GAL6-AS1, recently described as upregulated in MM patients in association with worse stages of the disease [19]. ST3GAL6-AS1 is located at chromosome 3q12 head-to-head with the ST3GAL6 gene, sharing a 415 bp complementary sequence. Approximately 60Kb telomeric and in sense orientation to ST3GAL6-AS1, is located the DCBLD2 (Discoidin, CUB and LCCL Domain Containing 2) gene encoding a receptor tyrosine kinase with aberrant expression in malignant tumors. Interestingly, Pearson’s correlation analysis revealed that ST3GAL6-AS1 expression positively correlates to that of ST3GAL6 gene (Figure 1b), whereas DCBLD2 showed an unrelated transcription pattern. We used a quantitative real time PCR-based (qRT-PCR) approach (see Supplementary Methods) to validate microarrays data in 38 out of the 50 MM samples, confirming the positive correlation between ST3GAL6-AS1 and ST3GAL6 (Figure S1a,b). In addition, both ST3GAL6-AS1 and ST3GAL6 were expressed in MM patients irrespectively of the presence of the major chromosomal aberrations, namely t(11;14), t(4;14), MAF gene translocations or hyperdiploid (HD) status, or the presence of KRAS, NRAS, TP53, BRAF, FAM46C or DIS3 gene mutations.
The upregulation of ST3GAL6-AS1 in pathological samples was evidenced in an independent dataset of patients (GSE117847) profiled on Clariom-D array, and including five normal controls, 21 sMM and 10 MM specimens. Remarkably, not only MM but also sMM patients significantly upregulated ST3GAL6-AS1 (Figure 1c). Interestingly, we also found that the ST3GAL6-AS1 expression further increased in sPCL cases investigated by Gene 2.0 ST array (Figure 1d), suggesting that high ST3GAL6-AS1 expression level may be likely associated with the advanced stage of the disease.
ST3GAL6-AS1 expression analysis was extended to a data set obtained by RNA-sequencing (RNA-seq) of 30 out of the 50 MM cases profiled by gene expression microarrays, as previously reported [21]. In agreement with microarray data, ST3GAL6-AS1 appeared to be consistently expressed in all MM patients investigated regardless of the molecular subtypes (Figure 2). Notably, the reads alignment suggested that ST3GAL6-AS1 transcript variants are not limited to the canonical five exons, described in literature to date [19], but it could also fit with several computationally inferred variants, e.g., those from FANTOM CAT assembly included in the most recent annotations from GENCODE and LNCipedia repositories. However, although RNA-seq analysis could provide information concerning putative boundaries and junctions between contiguous exons, it does not allow defining all the potential whole-assembled variants with sufficient accuracy. Therefore, this aspect should be considered out of the scope of the present study.
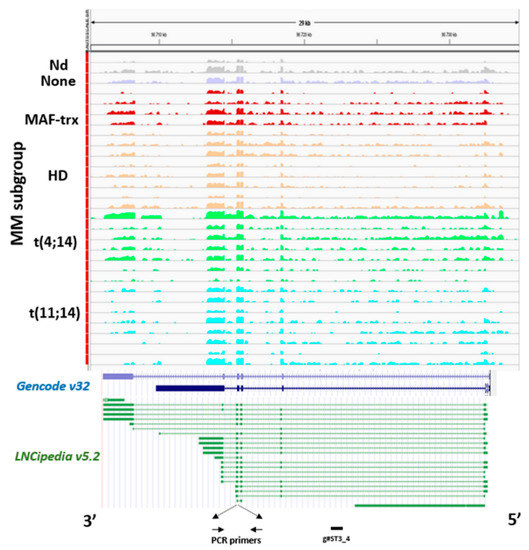
Figure 2. Analysis of ST3GAL6-AS1 expression. ST3GAL6-AS1 expression by RNA-sequencing. Visualization of RNA-seq data: zoomed view of the ST3GAL6-AS1 lncRNA region; the coverage bigWig files generated using bamCoverage function in deeptools [22] and the human genome annotation file (GENCODE v.32) were loaded into the Integrated Genome Viewer [23]. FANTOM CAT transcripts included in LNCipedia repository are also reported. The y-axis shows the scaled number of reads mapping to each location of the genome in the ST3GAL6-AS1 region (x-axis) schematically reported. Each lane represents a MM patient: different colors refer to the sample molecular characteristic indicated at the left. In order to compare samples, coverage values from all patients were group-scaled. Localization of primers used in RT-PCR analysis and g#ST3_4 gapmeR used for functional study is also indicated at the bottom.
Next, we extended the analyses of ST3GAL6-AS1 expression to the large MMRF CoMMpass database including 767 MM patients profiled by RNA-sequencing, whose molecular characteristics are reported in Table S3. With the aim of better defining molecular features possibly associated with ST3GAL6-AS1 expression, we grouped patients into quartiles according to ST3GAL6-AS1 expression levels (Figure S2), and compared the lowest and the highest quartile (i.e., the I and the IV quartiles including 192 patients/each group). Based on a Fisher’s exact test between these two groups, we confirmed the independence of ST3GAL6-AS1 expression from the occurrence of the main chromosomal translocations in MM. Conversely, the IV quartile group was significantly enriched in patients with chromosome 1q gain (Figure 3a and Table S4), whereas chromosome 13q, 17p, and 1p deletions were equally distributed in both quartiles. Regarding the association with KRAS, NRAS, TP53, BRAF, FAM46C or DIS3 gene mutations, we found that NRAS and DIS3 mutations were significantly enriched in the upper quartile group showing the highest ST3GAL6-AS1 expression (Figure 3b and Table S4).
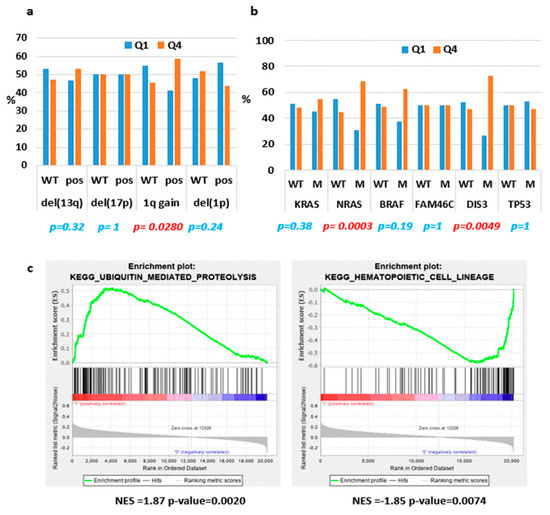
Figure 3. ST3GAL6-AS1 expression in CoMMpass database. (a,b) Histograms representing the occurrence of the indicated molecular features in the I and IV quartiles (Q1 and Q4) analyzed by the Fisher’s exact test; significant p-value are reported in red. (c) Enrichment plots of two selected gene sets detected by GSEA. The green curves show the enrichment score and reflect the degree to which each gene (black vertical lines) is represented at the bottom of the ranked gene list. NES: Normalized Enrichment Score.
The same approach was used to unveil molecular pathways and putative biological effects associated with ST3GAL6-AS1 modulation. In detail, we compared the transcriptional profiles of patients belonging to the two extreme quartiles, obtaining 482 differentially expressed coding genes. Interestingly, the functional annotation analysis of this signature, aimed at identifying highly significant represented categories, revealed the enrichment in biological processes like migration and chemotaxis, positive regulation of metabolic processes, negative regulation of cell communication, positive regulation of apoptotic process, and positive regulation of MAPK cascade (Table S5). In addition, enrichment analysis of all the annotated coding-genes using Gene Sets Enrichment Analysis (GSEA) tool, evidenced that the IV quartile was significantly enriched in genes involved in ubiquitin mediated proteolysis, and negatively associated with different pathways including hematopoietic cell lineage (Table S6 and Figure 3c).
Finally, we extended ST3GAL6-AS1 and ST3GAL6 expression analysis to a representative panel of human hematological tumors, including MM (n = 21), lymphoma (n = 6) and leukemia (n = 5) cell lines, and found that the expression levels of both ST3GAL6-AS1 and ST3GAL6 were significantly higher in human MM cell lines (HMCLs) as compared with other tumor types (Figure 4 and Figure S3).
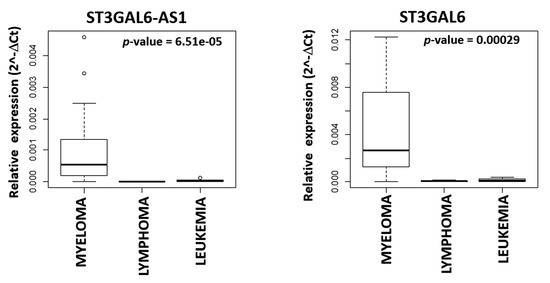
Figure 4. Boxplot of ST3GAL6-AS1 and ST3GAL6 expression in 21 MM, six lymphoma, and five leukemia cell lines based on the qRT-PCR approach described in the Supplementary Methods.
Overall, the remarkably higher ST3GAL6-AS1 expression in MM plasma cells suggests that this lncRNA may play an important role in the pathobiology of the disease.
3. Discussion
Despite accumulating evidence on specific transcriptional patterns and functional roles of lncRNAs in MM [5][6][8][9][21][24], their impact on the pathobiology of the disease remains to be fully elucidated.
In this study, we have focused on ST3GAL6-AS1, a lncRNA that we found as the most significantly upregulated in MM as compared to normal bone marrow PCs. Interestingly, ST3GAL6-AS1 appears to be also significantly upregulated in sMM and further increases its expression level in sPCLs, which represent the most advanced and aggressive forms of the disease, thus suggesting a potential association with disease progression (Figure 1c,d). In addition, among different hematological tumors, ST3GAL6-AS1 deregulation appears specifically related to PC disorders (Figure 4 and Figure S3). However, based on our analyses on the CoMMpass database, ST3GAL6-AS1 expression levels do not appear to be significantly associated with clinical outcome.
Our data showed that ST3GAL6-AS1 expression was positively correlated with that of its neighboring gene ST3GAL6, coding for a sialyltransferase enzyme involved in homing and in in vivo engraftment in MM [18]. Such a correlation has also been recently described in colorectal cancer (CRC), where ST3GAL6-AS1 was demonstrated to regulate ST3GAL6 transcription by recruiting histone methyltransferase MLL1 to its promoter region. Moreover, ST3GAL6-AS1 and ST3GAL6 are down-modulated in CRC, suggesting that the ST3GAL6-AS1/ST3GAL6 axis may play a tumor-suppressor role [20]. Overall, these data suggest that ST3GAL6-AS1 may have different biological roles in specific cellular context.
Focusing on MM, we found that ST3GAL6-AS1 expression level was independent from the presence of the main genetic aberrations defining MM prognostic groups, apart from chromosome 1q gain, and NRAS or DIS3 gene mutations as shown in the large cohort of MM patients included in the CoMMpass database, (Figure 3a,b). Particularly intriguing is the finding concerning the association between high ST3GAL6-AS1 expression level (IV quartile) and presence of NRAS mutations, which has been supported by further evidences. First, the functional annotation analysis of the genes significantly differentiating the upper quartile in comparison to the lowest one in the CoMMpass database showed that MM patients with higher ST3GAL6-AS1 expression levels have a gene signature related to the positive regulation of MAPK cascade (Table S5). Additionally, GSEA analysis in HMCLs upon ST3GAL6-AS1 KD evidenced that low ST3GAL6-AS1 expression levels are associated with gene set downregulation in cancer cell lines carrying an oncogenic form of KRAS (Table S9). Furthermore, ST3GAL6-AS1 silenced cells displayed reduced cellular growth and clonogenic potential, together with an increased in sub G0/G1 phase of the cell cycle associated with apoptosis induction (Figure 5). Finally, the gene expression signature of ST3GAL6-AS1 KD HMCLs showed a significant downregulation of RAP1A, a member of the Ras gene family [25]. Accordingly, we detected a reduction in the activated MAPK fraction by WB in ST3GAL6-AS1 KD cells (Figure 6). Overall, ST3GAL6-AS1 appeared to be involved in the MAPK signaling pathways leading to cellular proliferation, through mechanisms that warrant further studies.
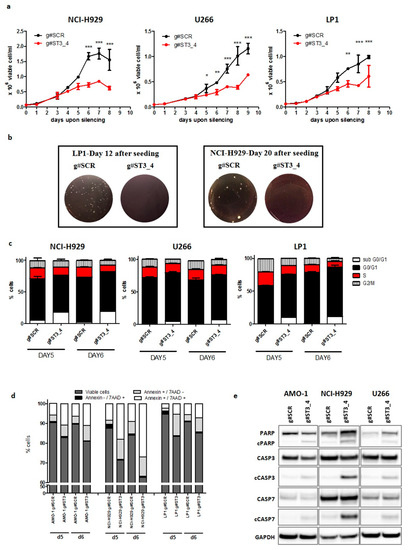
Figure 5. ST3GAL6-AS1 inhibition affects HMCLs cell cycle and apoptosis. (a) HMCLs growth inhibition upon gymnotic ST3GAL6-AS1 silencing with g#ST3_4 gapmeR (5 μM). * p < 0.05, ** p < 0.01, *** p < 0.001). (b) Colony formation assay performed on LP1 and NCI-H929 treated with g#ST3_4 gapmeR (5 μM) for 12 or 20 days, respectively; representative pictures of colonies are shown. (c) Histogram of cell cycle analysis by propidium iodide (PI) staining performed in NCI-H929, U266, and LP1 cells 5 and 6 days after treatment with g#ST3_4 gapmeR (5 μM). (d) Flow cytometry analyses of apoptosis in NCI-H929, AMO-1, and LP1 5 days after treatment with g#ST3_4 gapmeR (5 μM). (e) WB of cleaved caspase 3 and 7 and PARP in AMO-1, NCI-H929, and U266 6 days after delivery of g#ST3_4 gapmeR (5 μM). A representative picture of at least three experiments is shown.
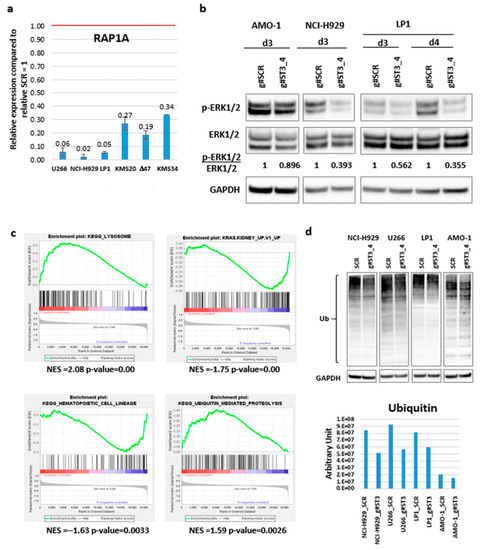
Figure 6. g#ST3_4 LNA-gapmeR effect on HMCLs. (a) RAP1A expression validation by RT-PCR. Mean and standard deviation on three replicates are reported. (b) WB of p-ERK1/2 and total ERK1/2 after delivery of g#ST3_4 gapmeR (5 μM) at the indicated time points. HMCLs were cultured in FBS 1%. (c) Enrichment plots of four selected gene sets detected by GSEA. The green curves show the enrichment score and reflect the degree to which each gene (black vertical lines) is represented at the bottom of the ranked gene list. (d) WB of ubiquitin after treating the indicated HMCLs with g#ST3_4 gapmeR (5 μM, 3 days); densitometric evaluation is reported in the histogram below.
Interestingly, our data indicate that ST3GAL6-AS1 was not only implicated in proliferation pathways. In fact, GSEA analyses in patients belonging to the extreme quartiles in the CoMMpass database revealed that ST3GAL6-AS1 expression signature included genes involved in ubiquitin-mediated proteolysis, a finding that was confirmed by GSEA analysis in HMCLs upon ST3GAL6-AS1 KD. Furthermore, ST3GAL6-AS1 KD cells displayed a substantial decrease in the ubiquitinated protein amount by WB analysis. The ubiquitin pathway is crucial in MM PCs because they have the imperative need for an intact protein synthesis-folding-degradation axis given their abundant synthesis and secretion of a monoclonal immunoglobulin, or free light chain [26]. From this perspective, ST3GAL6-AS1 expression in MM may play a role in the survival of PCs. In line with this, it is worth noting that patients from the CoMMpass database with the highest ST3GAL6-AS1 expression were significantly associated with 1q gain. In our previous studies, we reported that the gene expression signature of MM patients with 1q gain was involved in processes of intracellular protein transport, and in the complex network leading to ER stress-induced responses [27]. In this context, both alterations may cooperate for the maintenance of protein homeostasis in malignant PCs. Of note, we found under our in vitro experimental condition that ST3GAL6-AS1 silencing may exert an antagonistic effect if combined with proteasome inhibitors, such as BZB and CFZ. Although these findings need to be further investigated, one possible explanation might be that a consistent reduction in protein ubiquitination (as observed in ST3GAL6-AS1 silencing) could lead to a lesser amount of substrate being addressed to the proteasome machinery, the inhibition of which may ultimately result in being less effective.
This entry is adapted from the peer-reviewed paper 10.3390/cancers12040782
References
- Morgan:, G.J.; Walker, B.A.; Davies, F.E. The genetic architecture of multiple myeloma. Nat. Rev. Cancer 2012, 12, 335–348.
- Cech, T.R.; Steitz, J.A. The noncoding RNA revolution-trashing old rules to forge new ones. Cell 2014, 157, 77–94.
- Kunej, T.; Obsteter, J.; Pogacar, Z.; Horvat, S.; Calin, G.A. The decalog of long non-coding RNA involvement in cancer diagnosis and monitoring. Crit. Rev. Clin. Lab. Sci. 2014, 51, 344–357.
- Gutschner, T.; Hammerle, M.; Eissmann, M.; Hsu, J.; Kim, Y.; Hung, G.; Revenko, A.; Arun, G.; Stentrup, M.; Gross, M.; et al. The noncoding RNA MALAT1 is a critical regulator of the metastasis phenotype of lung cancer cells. Cancer Res. 2013, 73, 1180–1189.
- Butova, R.; Vychytilova-Faltejskova, P.; Souckova, A.; Sevcikova, S.; Hajek, R. Long Non-Coding RNAs in Multiple Myeloma. Non Coding RNA 2019, 5, 13.
- Cui, Y.S.; Song, Y.P.; Fang, B.J. The role of long non-coding RNAs in multiple myeloma. Eur. J. Haematol. 2019, 103, 3–9.
- Morelli, E.; Gulla, A.; Rocca, R.; Federico, C.; Raimondi, L.; Malvestiti, S.; Agosti, V.; Rossi, M.; Costa, G.; Giavaresi, G.; et al. The Non-Coding RNA Landscape of Plasma Cell Dyscrasias. Cancers 2020, 12, 320.
- Nobili, L.; Ronchetti, D.; Agnelli, L.; Taiana, E.; Vinci, C.; Neri, A. Long Non-Coding RNAs in Multiple Myeloma. Genes 2018, 9, 69.
- Samur, M.K.; Minvielle, S.; Gulla, A.; Fulciniti, M.; Cleynen, A.; Aktas Samur, A.; Szalat, R.; Shammas, M.; Magrangeas, F.; Tai, Y.T.; et al. Long intergenic non-coding RNAs have an independent impact on survival in multiple myeloma. Leukemia 2018, 32, 2626–2635.
- Amodio, N.; Stamato, M.A.; Juli, G.; Morelli, E.; Fulciniti, M.; Manzoni, M.; Taiana, E.; Agnelli, L.; Cantafio, M.E.G.; Romeo, E.; et al. Drugging the lncRNA MALAT1 via LNA gapmeR ASO inhibits gene expression of proteasome subunits and triggers anti-multiple myeloma activity. Leukemia 2018, 32, 1948–1957.
- Handa, H.; Kuroda, Y.; Kimura, K.; Masuda, Y.; Hattori, H.; Alkebsi, L.; Matsumoto, M.; Kasamatsu, T.; Kobayashi, N.; Tahara, K.I.; et al. Long non-coding RNA MALAT1 is an inducible stress response gene associated with extramedullary spread and poor prognosis of multiple myeloma. Br. J. Haematol. 2017, 179, 449–460.
- Hu, Y.; Lin, J.; Fang, H.; Fang, J.; Li, C.; Chen, W.; Liu, S.; Ondrejka, S.; Gong, Z.; Reu, F.; et al. Targeting the MALAT1/PARP1/LIG3 complex induces DNA damage and apoptosis in multiple myeloma. Leukemia 2018, 32, 2250–2262.
- Taiana, E.; Favasuli, V.; Ronchetti, D.; Todoerti, K.; Pelizzoni, F.; Manzoni, M.; Barbieri, M.; Fabris, S.; Silvestris, I.; Gallo Cantafio, M.E.; et al. Long non-coding RNA NEAT1 targeting impairs the DNA repair machinery and triggers anti-tumor activity in multiple myeloma. Leukemia 2020, 34, 234–244.
- Taiana, E.; Ronchetti, D.; Favasuli, V.; Todoerti, K.; Manzoni, M.; Amodio, N.; Tassone, P.; Agnelli, L.; Neri, A. Long non-coding RNA NEAT1 shows high expression unrelated to molecular features and clinical outcome in multiple myeloma. Haematologica 2019, 104, e72–e76.
- Chen, L.; Hu, N.; Wang, C.; Zhao, H.; Gu, Y. Long non-coding RNA CCAT1 promotes multiple myeloma progression by acting as a molecular sponge of miR-181a-5p to modulate HOXA1 expression. Cell Cycle 2018, 17, 319–329.
- Pan, Y.; Zhang, Y.; Liu, W.; Huang, Y.; Shen, X.; Jing, R.; Pu, J.; Wang, X.; Ju, S.; Cong, H.; et al. LncRNA H19 overexpression induces bortezomib resistance in multiple myeloma by targeting MCL-1 via miR-29b-3p. Cell Death Dis. 2019, 10, 106.
- Sun, Y.; Pan, J.; Zhang, N.; Wei, W.; Yu, S.; Ai, L. Knockdown of long non-coding RNA H19 inhibits multiple myeloma cell growth via NF-kappaB pathway. Sci. Rep. 2017, 7, 18079.
- Glavey, S.V.; Manier, S.; Natoni, A.; Sacco, A.; Moschetta, M.; Reagan, M.R.; Murillo, L.S.; Sahin, I.; Wu, P.; Mishima, Y.; et al. The sialyltransferase ST3GAL6 influences homing and survival in multiple myeloma. Blood 2014, 124, 1765–1776.
- Shen, Y.; Feng, Y.; Chen, H.; Huang, L.; Wang, F.; Bai, J.; Yang, Y.; Wang, J.; Zhao, W.; Jia, Y.; et al. Focusing on long non-coding RNA dysregulation in newly diagnosed multiple myeloma. Life Sci. 2018, 196, 133–142.
- Hu, J.; Shan, Y.; Ma, J.; Pan, Y.; Zhou, H.; Jiang, L.; Jia, L. LncRNA ST3Gal6-AS1/ST3Gal6 axis mediates colorectal cancer progression by regulating alpha-2,3 sialylation via PI3K/Akt signaling. Int. J. Cancer 2019, 145, 450–460.
- Ronchetti, D.; Agnelli, L.; Pietrelli, A.; Todoerti, K.; Manzoni, M.; Taiana, E.; Neri, A. A compendium of long non-coding RNAs transcriptional fingerprint in multiple myeloma. Sci. Rep. 2018, 8, 6557.
- Deep Tools. Available online: (accessed on 11 February 2018).
- IGV. Available online: (accessed on 20 November 2019).
- Ronchetti, D.; Agnelli, L.; Taiana, E.; Galletti, S.; Manzoni, M.; Todoerti, K.; Musto, P.; Strozzi, F.; Neri, A. Distinct lncRNA transcriptional fingerprints characterize progressive stages of multiple myeloma. Oncotarget 2016, 7, 14814–14830.
- Ehrhardt, A.; Ehrhardt, G.R.; Guo, X.; Schrader, J.W. Ras and relatives--job sharing and networking keep an old family together. Exp. Hematol. 2002, 30, 1089–1106.
- Guang, M.H.Z.; Kavanagh, E.L.; Dunne, L.P.; Dowling, P.; Zhang, L.; Lindsay, S.; Bazou, D.; Goh, C.Y.; Hanley, C.; Bianchi, G.; et al. Targeting Proteotoxic Stress in Cancer: A Review of the Role that Protein Quality Control Pathways Play in Oncogenesis. Cancers 2019, 11, 66.
- Fabris, S.; Ronchetti, D.; Agnelli, L.; Baldini, L.; Morabito, F.; Bicciato, S.; Basso, D.; Todoerti, K.; Lombardi, L.; Lambertenghi-Deliliers, G.; et al. Transcriptional features of multiple myeloma patients with chromosome 1q gain. Leukemia 2007, 21, 1113–1116.