The gut microbiota is emerging as a promising target for the management or prevention of inflammatory and metabolic disorders in humans. Many of the current research efforts are focused on the identification of specific microbial signatures, more particularly for those associated with obesity, type 2 diabetes, and cardiovascular diseases. The Firmicutes/Bacteroidetes ratio is frequently cited in the scientific literature as a healthy hallmark. The aim of the present review was to discuss the validity of this potential marker, based on the great amount of contradictory results reported in the literature. We re-analyzed the 16S rRNA gene sequence data from nine published studies to allow direct comparisons among their Firmicutes/Bacteroidetes ratio. We observed that the relative abundance of the Firmicutes and Bacteroidetes phyla is highly variable between subjects from a same population. This is probably due to many lifestyle-associated factors including diet, physical activity, food additives and contaminants, antibiotic consumption, physical activity, among others that influence the composition of the microbiota in the gastrointestinal tract. This could explain the contradictory results observed when comparing the microbiota between normal-weight and obese subjects, making it difficult to associate the Firmicutes/Bacteroidetes ratio with a determined health status.
- microbiome
- geography
- Firmicutes / Bacteroidetes
- obesity
- marker
- disease
- metabolic diseases
- firmicutes
- bacteroidetes
- biomarker
To assess the relevance of the Firmicutes/Bacteroidetes ratio as a taxonomic signature of healthy, we used data from microbiota composition from nine published studies carried out in seven countries (USA, United Kingdom, India, Pakistan, Chile, Argentina, and Colombia) and including 728 healthy subjects. High-throughput 16S rRNA gene sequence data from previous studies, corresponding to V3–V4 or V4 hypervariable regions and generated by the Illumina MiSeq Platform, were collected (Table 1). To allow direct comparisons among sequences from different studies, all the reads were filtered using the DADA2 pipeline, then aligned and trimmed to the same length (80 bp) using Mothur, followed by the taxonomic identification using the DADA2 pipeline based on the identification of Exact Sequence Variants [1]. We considered that a sequence length of 80 bp was adequate for analyzing the microbial communities at the Phylum level (less than 0.02% of the reads were not assigned). Using a unique pipeline and reads generated by a same sequencing platform, we expected to eliminate all bias generated by sequencing and bioinformatic tools, as commented above. Subsequently, we analyzed the relative abundance of Firmicutes and Bacteroidetes and their ratio. Overall, the data indicate that the abundance of Firmicutes in the gut microbiota of healthy individuals varies between 11% to 95% and that of Bacteroidetes between 0.6% to 86.6% (Figure 1). Considering this variability, it seems difficult to observe significant changes for these two phyla in obese people. In their meta-analysis, Finucane et al. observed that the variations for both Firmicutes and Bacteroidetes abundance were much larger among studies than between lean and obese individuals within any study [2]. In agreement with these findings, we recently observed a high variability of both Firmicutes and Bacteroidetes, between 25%–67% and 4%–64% respectively, in the fecal microbiota of young healthy Chilean volunteers, despite rigorous inclusion criteria including the control of anthropometrical and biochemical markers, biomarkers of systemic and colonic inflammation (plasma IL-6 and high sensitivity C-reactive protein and fecal calprotectin, respectively), and dietary intake [3]. Again, the heterogeneity of the diet is probably the main factor explaining such variations in the healthy population and this might eventually make difficult the identification of specific microbial signatures. For example, on the one hand, Wu et al. showed in 100 healthy individuals with known dietary habits that the microbiota from those consuming protein and fat-based diets were enriched with Bacteroides whereas that from those consuming carbohydrate-based diets were enriched with Prevotella [4], results from which these authors formulated the concept of “enterotype”. On the other hand, Balamurugan et al. compared the gut microbiota from a tribal population (Malayalis) living in the northern part of Tamil Nadu (India) that consumed a restricted diet due to cultural and religious beliefs, with that from healthy villagers from the same region as controls. Both populations exhibited a high abundance of Firmicutes (85.9% and 63.5%, for the Malaiyalis and controls, respectively) and low abundance of Bacteroidetes (2.65% and 0.45%, respectively), resulting in very high Firmicutes/Bacteroidetes ratio (34.0 and 92.9, respectively), though the individuals from both populations were lean [5]. Although the Malaiyalis population had a restricted, homogenous diet, a high variation in the proportions of both Firmicutes and Bacteroidetes was observed, confirming that factors other than diet influence this ratio.
Table 1. Description of studies considered in this study for evaluating the variability of the Firmicutes and Bacteroidetes.
Country |
AccessionNumber
|
Effective &
|
Age(Years)
|
BMI(kg/m2)
|
Sequencing Platform |
Hypervariable region |
Ref |
|
USA
|
PRJNA290926
|
68
|
53.1 ±10.8
|
22.0 ±1.9
|
MiSeq Illumina
|
V4 region
|
[6] |
|
UK1 |
PRJEB6702 |
230 |
61.2 ±10.1 |
22.4 ±1.8 |
MiSeq Illumina |
V4 region |
[7] |
|
UK2 |
PRJEB6705 |
189 |
60.0 ±9.5 |
22.3 ±1.8 |
MiSeq Illumina |
V4 region |
[7] |
|
Pakistan |
PRJNA554535 |
20 |
37.7 ±12.1 |
22.1 ±3.1 |
MiSeq Illumina |
V3–V4 region |
[8] |
|
India |
PRJEB28290 |
80 |
Range 18–55 * |
23.9 ±3.2* |
MiSeq Illumina |
V3–V4 region |
[9] |
|
Colombia |
PRJEB33360 |
83 |
52.1 ±18.6 |
25.1 ±3.9 |
MiSeq Illumina |
V3–V4 region |
[10] |
|
Chile |
PRJEB16755 |
32 |
25.0 ±3.9 |
22.5 ±1.6 |
MiSeq Illumina |
V3–V4 region |
[3] |
|
Argentin1 |
PRJNA503303 |
28 |
35.2 ±8.3* |
23.9 ±3.4* |
MiSeq Illumina |
V3–V4 region |
[11] |
|
Argentin2 |
Personal data** |
28 |
40.2 ±4.4 |
22.6 ±2.0 |
MiSeq Illumina |
V4 region |
Personal data |
& Effective obtained after the bioinformatic processing; * Data obtained from publishing data (not-recalculated due to the lack of individual data); ** Data submitted for publication, provided by Susan Pesoa, co-author of this work; UK 1, UK 2, Argentina 1 and Argentina 2 are studies reported in the Figure 1.
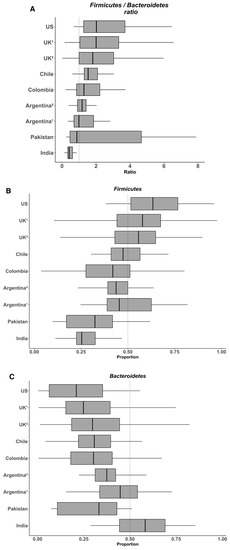
Figure 1. Variability in the Firmicutes/Bacteroidetes ratio (A) and the relative abundances of Firmicutes (B) and Bacteroidetes (C) in the gut microbiota from several healthy populations. Box plots were constructed using R. In the box and whisker plots, the line shows the median; the box, the interquartile range; and the whiskers, the highest and lowest values.
This entry is adapted from the peer-reviewed paper 10.3390/nu12051474
References
- Benjamin J. Callahan; Paul McMurdie; Michael J Rosen; Andrew W Han; Amy Jo A Johnson; Susan Holmes; DADA2: High-resolution sample inference from Illumina amplicon data. Nature Methods 2016, 13, 581-583, 10.1038/nmeth.3869.
- Mariel M. Finucane; Thomas J. Sharpton; Timothy J. Laurent; Katherine S. Pollard; A Taxonomic Signature of Obesity in the Microbiome? Getting to the Guts of the Matter. PLOS ONE 2014, 9, e84689, 10.1371/journal.pone.0084689.
- Sayaka Fujio-Vejar; Yessenia Vasquez; Pamela Morales; Fabien Magne; Patricia Vera-Wolf; Juan Ugalde; Paola Navarrete; Martín Gotteland; The Gut Microbiota of Healthy Chilean Subjects Reveals a High Abundance of the Phylum Verrucomicrobia.. Frontiers in Microbiology 2017, 8, 1221, 10.3389/fmicb.2017.01221.
- Gary D. Wu; Jun Chen; Christian Hoffmann; Kyle Bittinger; Ying-Yu Chen; Sue A. Keilbaugh; Meenakshi Bewtra; Dan Knights; William A. Walters; Rob Knight; et al. Linking Long-Term Dietary Patterns with Gut Microbial Enterotypes. Science 2011, 334, 105-108, 10.1126/science.1208344.
- Balamurugan Ramadass; B. Sandya Rani; Srinivasan Pugazhendhi; K.R. John; Balakrishnan S. Ramakrishna; Faecal microbiota of healthy adults in south India: Comparison of a tribal & a rural population. Indian Journal of Medical Research 2017, 145, 237-246, 10.4103/ijmr.IJMR_639_14.
- Nielson Baxter; Mack Ruffin; Mary A. M. Rogers; Patrick D. Schloss; Microbiota-based model improves the sensitivity of fecal immunochemical test for detecting colonic lesions. Genome Medicine 2016, 8, 37, 10.1186/s13073-016-0290-3.
- Julia K. Goodrich; Jillian L. Waters; Angela Poole; Jessica L. Sutter; Omry Koren; Ran Blekhman; Michelle Beaumont; William Van Treuren; Rob Knight; Jordana T. Bell; et al. Human Genetics Shape the Gut Microbiome. Cell 2014, 159, 789-799, 10.1016/j.cell.2014.09.053.
- Aftab Ahmad; Wanwei Yang; Guofang Chen; Muhammad Shafiq; Sundus Javed; Syed Shujaat Ali Zaidi; Ramla Shahid; Chao Liu; Habib Bokhari; Analysis of gut microbiota of obese individuals with type 2 diabetes and healthy individuals. PLOS ONE 2019, 14, e0226372, 10.1371/journal.pone.0226372.
- Disha Tandon; Mohammed Monzoorul Haque; Saravanan R.; Shafiq Shaikh; Sriram P.; Ashok Kumar Dubey; Sharmila S Mande; A snapshot of gut microbiota of an adult urban population from Western region of India. PLOS ONE 2018, 13, e0195643, 10.1371/journal.pone.0195643.
- Gloria M. Agudelo-Ochoa; Beatriz E. Valdés-Duque; Nubia A. Giraldo-Giraldo; Ana M. Jaillier-Ramírez; Adriana Giraldo-Villa; Irene Acevedo-Castaño; Mónica A. Yepes-Molina; Janeth Barbosa-Barbosa; Alfonso Benítez-Páez; Gut microbiota profiles in critically ill patients, potential biomarkers and risk variables for sepsis.. Gut Microbes 2020, x, 1-16, 10.1080/19490976.2019.1707610.
- Fiorella Sabrina Belforte; Natalie Fernandez; Francisco Tonín Monzón; Ayelén Daiana Rosso; Sofía Quesada; María Cecilia Cimolai; Andrea Millán; Gloria Edith Cerrone; Gustavo Daniel Frechtel; Rémy Burcelin; et al. Getting to Know the Gut Microbial Diversity of Metropolitan Buenos Aires Inhabitants.. Frontiers in Microbiology 2019, 10, 965, 10.3389/fmicb.2019.00965.