A number of new strategies have been identified for using DCE-MRU to measure renal perfusion [
14,
15,
16,
17,
18,
19,
20,
21]. DCE-MRI is contingent on renal function, and similar to CT, it can reveal renal functional impairment, although unlike CT it is possible to acquire many time points to more accurately quantify functional impairment. Currently, gadolinium-based contrast agents (GBCA) are the most widely used agents which rely on reducing the T1 of neighboring water molecules to impart signal changes [
22,
23,
24,
25]. Rapid multi-slice methods to extract contrast kinetics have been developed for the comprehensive assessment of kidney function [
19,
23,
24,
26,
27,
28]. Administering GBCAs can provide functional characterizations of obstructions [
29,
30,
31] and for moderately dilated renal collecting systems, the MRI measurement of split renal function was proven to be equivalent to renal scintigraphy whereas for severely dilated kidneys there was an underestimate of split renal function [
32]. Another retrospective study with a larger set of patients found limitations in the precision of GBCA determinations of split renal function [
33]. To offset these limitations found using GBCAs, alternative imaging agents can be applied including:
19F imaging agents [
34], hyperpolarized
129Xe imaging agents [
35], hyperpolarized
13C spectroscopic imaging agents [
36] and CEST contrast agents [
37]. Fain and colleagues demonstrated the power of hyperpolarized
13C pyruvate for the evaluation of partial ureteral obstruction in mouse models, showing that differences in pyruvate metabolism for obstructed and unobstructed kidneys can be seen using this imaging agent [
36]. However, chemical exchange saturation transfer (CEST) contrast agents represent a particularly promising technology due to their capabilities of detect changes in metabolism, perfusion and pH [
38] which we will discuss further below. With all these MR imaging agents displaying promise in preclinical studies, DCE-MRI of the kidneys is a vibrant and active area of investigation.
3.1. DCE-MR CEST Urography
CEST has emerged as an MRI contrast mechanism that can be used to detect small amounts of contrast agent through an amplified detection of low concentration protons (on the order of low mM) through their exchange with water [
38]. Based on the early work of Cerdan, Gillies, Sherry, Bhujwalla and colleagues, pH imaging is an emerging field [
39,
40,
41,
42,
43,
44,
45,
46]. This includes the outstanding work of Andreev, Reshetnyak, Lewis, Gao and colleagues developing both fluorescent and PET probes to detect low pH environments [
47,
48,
49,
50,
51]. CEST MRI is now one of the premier imaging methods for the measurement of pH due to proton chemical exchange being sensitive to acid-base equilibrium, the development of ratiometric methods for distinguishing changes in agent concentration from changes in pH, and the amplified detection of these agents compared to spectroscopy [
52,
53,
54,
55,
56,
57,
58,
59,
60,
61,
62,
63,
64,
65,
66,
67]. Traditional CT and MR urography, while effective at characterizing upper tract function, cannot reliably quantify renal function, often requiring subsequent renal scintigraphy exams. Conversely, CEST MRI can characterize urinary tract obstruction and function simultaneously, generating pH maps in addition to traditional time activity curves seen on renal scintigraphy. The novel ability of CEST imaging to measure pH is of particular import, as renal functional impairments are often associated with a urinary acidification defect caused by diminished net H
+ secretion and/or HCO
3− reabsorption. While this can be assessed systemically through measurement of urine pH, using MR to image tubular pH can best assess whether a patient is experiencing functional decline in their obstructed renal unit, quantify the amount of renal functional impairment, and even assess whether this functional impairment is reversible (thus potentially benefiting from intervention) or irreversible. Additionally, in the case of urolithiasis, pH is relevant due to its relationship with stone formation, with urine acidification or alkalization employed as treatments depending on the stones’ constitution. Hence, CEST imaging is of interest in the evaluations of upper UTOs not only due to efficiency, but the ability to provide novel functional information to inform clinical therapy.
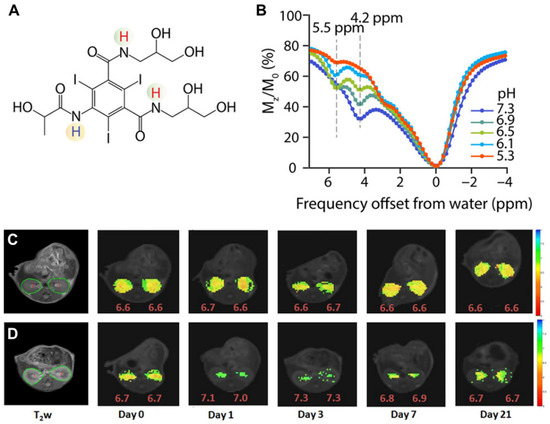
The triiodobenzenes iopamidol (ISOVUE
®, A) and iopromide were the first agents with particular promise identified for CEST imaging of the kidneys [
66,
68]. These are safe, nonionic molecules that have been in clinical use for over 30 years as X-ray contrast agents and administered at very high doses (up to 400 mg/mL). They both also have two exchangeable amide proton resonances (for iopamidol 4.2 ppm and at 5.5 ppm downfield from the water signal, B) that produce pH-dependent CEST contrast. Ratiometric methods for pH assessment have been developed based on comparison of the signals at the frequencies of these two amide proton resonances to measure pH within the range of 5.5 to 7.4. Longo and colleagues evaluated if iopamidol-based CEST MR could be used to detect the recovery of kidney function in an ischemia reperfusion acute kidney injury (AKI) rodent model using two metrics: renal perfusion and renal pH [
69]. A return to normal perfusion and pH values was observed by Day 7 for moderate lengths of ischemia induction, whereas a persistent drop in the perfusion of contrast agent and increase in renal pH was observed for longer induction times (C,D). Our group evaluated if iopamidol-based CEST MR could be used to detect progression in chronic kidney disease (CKD) in a the methyl malonic acidemia (MMA) model [
70]. This was investigated using four groups of mice: healthy controls on a regular diet (RG
Mu+/−) and high protein diet (HP
Mu+/−), mild kidney disease mice kept on a regular diet (RG
Mu−/−), and severe kidney disease mice on a high protein diet (HP
Mu−/−). Both RD and HP
Mu+/− controls displayed homogeneous pH values of 6.5 and excellent kidney perfusion of agent (~100%) while, in contrast, RD
Mu−/− mice displayed a lower average pH (~6.1) and perfusion (~79%) and an order of magnitude larger range of pH values in the kidneys (±0.2). Furthermore, HP
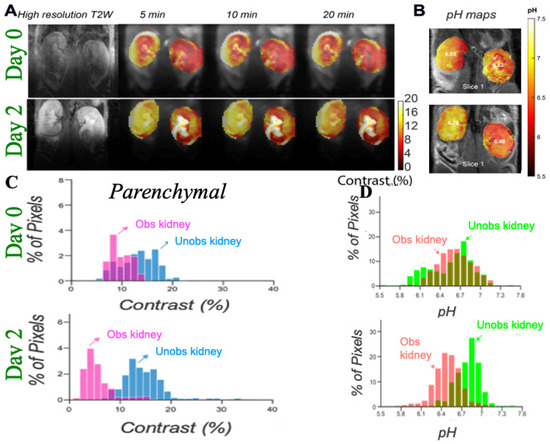
Mu−/− mice displayed a slightly lower pH (~6.0), substantially lower perfusion (~15%) and significantly larger range of pH values (±0.45). We have further tested iopamidol-based CEST MR on a complete unilateral urinary obstruction (UUO) mouse model. As shown in , there are, again, changes in both iopamidol perfusion, average pH and range in pH values could be visualized. Other important work has been performed to improve the imaging protocols and establish these agents on different models of kidney disease and for tumor imaging as well [
37,
56,
71,
72]. The results have demonstrated that iopamidol-based CEST MRI pH mapping is promising for monitoring of renal function, allowing for an early detection of the occurrence of renal pathology and distinguishing moderate from severe AKI.
Figure 5. Iopamidol as pH imaging agent tested in mice. (
A) Structure of iopamidol with exchangeable protons highlighted, which produce CEST contrast at 4.2 and 5.5 ppm; (
B) CEST Z-spectra of iopamidol in blood serum for pH = 5.3, 6.1, 6.5, 6.9, and 7.3. Panels (
C,
D) adopted from Pavuluri et al. in [
70]; Representative anatomical (T
2w) and superimposed color-coded pH maps obtained 15 min after Iopamidol injection at indicated time points in control group (
C) and in AKI group (
D). Panels (
C,
D) adopted from Longo et al. in [
69].
Figure 6. Imaging UUO in mice using iopamidol CEST MRI; (
A) Representative T2w and CEST MRI contrast maps at 4.2 ppm on a UUO mouse with right kidney obstructed on day 0 and 2 post surgery with iopamidol dose = 1 g I/kg, B
1 =4 μT, 2 offset protocol, as in reference [
70], to minimize pH mapping time and allow averaging for the production of high contrast to noise ratio (CNR) motion artifact compensated CEST maps; Dynamic CEST images were acquired at offsets 4.2, 5.5 ppm repeatedly for 80 min using a CW RF saturation of duration 2.1 s (7 rectangular block pulses each of 300 ms with 10 μs interpulse delay). TE/TR = 3.55/11,000 ms; Rapid Acquisition with Relaxation Enhancement with short echo time (RAREst) acquisition module and centric encoding were used. In total, 10 sets of M0 offsets at 40 ppm were acquired for normalization. Time interval between two dynamic CEST images was 44 s. Moving time average of 10 dynamic CEST images was performed to compensate the motion induced artifacts in CEST contrast with the B1 employed rendering the maps sufficiently insensitive to the B0 homogeneity across the kidneys shown in the B0 maps as described in reference [
70]. The images depict differences in marker perfusion for left and right kidneys due to hydronephrosis and resulting functional impairment; (
B) pH maps using images acquired 5 min after iopamidol administration. pH was calculated using the ratio of CEST contrast at 4.2, 5.5 ppm and the calibration curve obtained using the iopamidol phantom at pH values between 5.3 and 7.3; (
C) Parenchymal contrast histograms which display reduced contrast for obstructed kidney cortex and a larger variation in contrast for the obstructed kidney calyx; (
D) pH histograms which display an increase in ΔpH over time after UUO first in obstructed kidney and later in unobstructed kidney which is similar to what was observed in MMA induced CKD in mice.
Other agents have also shown promise for kidney imaging. For example, Sherry and colleagues performed in vivo pH imaging of mouse kidneys using a frequency-dependent lanthanide-based CEST agent [
73]. Other agents tested include urea and phosphocreatine [
74,
75]. Our group has synthesized imidazole CEST imaging agents including Imidazole-4,5-dicarboxamide-di Glutamate (I45DC-diGlu) [
76], and, as is shown in , seems particularly promising for evaluating UTOs. This agent is well suited for ratiometric pH imaging on 3 Tesla scanners with two labile protons with large chemical shifts that produce strong pH sensitive contrast (A,B). C,D display higher kidney contrast and a larger difference in split renal contrast than seen using iopamidol. A number of well-tolerated medications have been developed based around imidazoles [
77], including for treatment of cancer [
78], ulcers [
79,
80], hypertension [
81] and as antihistaminic drugs [
82] which is encouraging for translating imidazole MRI contrast agents. We expect that one of the CEST agents mentioned above, or perhaps one not yet discovered, will prove outstanding for functional DCE-MR CEST urography of UTOs.
Figure 7. Imaging unilateral urinary obstruction in mice using Imidazole CEST MRI agent; (A) Imidazole-4,5-dicarboxamide-di Glutamate (I45DC-diGlu) structure; (B) Experimental MTRasym spectra for I45DC-diGlu as a function of pH tsat = 3 s, ω1 = 6.0 μT, 37 °C; (C) in vivo kidney images; Experimental conditions: tsat = 3 s, ω1 = 6.0 μT. Dynamic CEST images were acquired using the same 2 offset CEST protocol described in for Iopamidol. Two CEST images at offsets 4.3 and 7.5 ppm were acquired repeatedly for a total time of 76 min and 10 set of M0 images at offset 40 ppm were collected. Time interval between two dynamic CEST images was 44 s; (D) Average parenchymal contrast for obstructed and non-obstructed kidney.
3.2. CEST MRI at 3T Using Iopamidol
At this stage, all of the major clinical scanner vendors have sequences for performing CEST imaging, allowing for the translation of pH imaging to patients [
83,
84,
85,
86,
87]. Based on the success of our studies in mice, we prepared an iopamidol phantom at several pH values in serum and moved to establishing a CEST imaging protocol on our 3T Philips Achieva scanner (Philips Healthcare Solutions, Amsterdam, NL, USA) to test how well we could create pH maps. Example data are shown in . As is shown, pH mapping could be performed over the range of 5.9 to 7.3 on our scanner; however, below this pH the performance was not ideal. Based on this, we injected iopamidol into our first healthy subject (Isovue 300, 90 mL injection volume) and observed ~4% contrast across both kidneys which was strong enough to enable generation of our first pH maps on a human subject (D). Improvements in imaging protocol and post processing are currently being implemented and are expected to yield higher contrast to noise ratio pH maps. These results indicated that DCE-MR CEST urography is very promising for translation into patients with UTOs.
Figure 8. Example of ratiometric measurement of pH using 25 mM iopamidol in blood serum at 3 T using B1 = 2 μT, (A) CEST z-spectra at pH = 5.7, 6.1, 6.5, 6.9 and 7.3 acquired for 63 offsets between −4 and 6 ppm; (B) pH maps of phantom; (C) T2 image of the abdomen in first healthy subject; (D) pH map of the kidneys after injection of iopamidol. CEST data were acquired for 18.9 min using tsat = 2 s, ω1 = 1.5 μT and TR = 6 s, at repeated offsets = 20,000, 6.1, 5.6, 5.1, 4.6 and 4.1 ppm, respectively. CEST contrast at 4.6 and 5.6 ppm was used for pH calculation. This set of offsets was necessary to partially compensate for the B0 homogeneity shown in the B0 maps across the kidneys on this scanner.


