Pancreatic cancer (PC) is among the most aggressive types of cancer, having caused over 495,000 deaths worldwide in 2020, with increasing annual incidence. Pancreatic cystic lesions (PCLs) are protrusions found within or on the surface of the pancreas, and in many cases have the potential to become malignant. Current methods of characterising PCLs are imperfect and there is a profound need for improved diagnostic algorithms.
- pancreatic cancer
- pancreatic cystic lesion
- biomarker
- risk
- omics
- multi-omics
- pancreatic adenocarcinoma
1. Introduction
Pancreatic cancer (PC) is the 7th leading cause of cancer-related death globally [1]. The five-year survival rate for all pancreatic cancer stages combined is just 9%, with incidence rates continuing to rise every year [2]. Pancreatic cancer can be divided into two main subtypes: pancreatic adenocarcinoma, which is responsible for 85–90% of all pancreatic neoplasms and has a five-year survival rate of just 8%, and pancreatic neuroendocrine tumour (PanNET), which is far less common and represents less than 5% of PC [1,3,4]. As pancreatic adenocarcinoma is by far the most prevalent type of pancreatic cancer, it is used synonymously with PC and will be the type of PC referred to throughout this review.
Pancreatic cystic lesions (PCLs) are typically fluid-filled structures that can be found within or on the surface of the pancreas, though some may have a solid appearance [3]. While many PCLs are benign and show no malignant potential, others, such as intraductal papillary mucinous neoplasms (IPMNs) or mucinous cystic neoplasms (MCNs), possess the ability to undergo malignant transformation and can be regarded as precursor lesions of PC [3,4,5]. The risk factors known to be associated with PC are extensive. However, investigations into these factors are largely case–control studies and as such have notable selection and recall biases [6]. Risk factors for PC can be classified as modifiable and non-modifiable [6,7]. Modifiable risk factors include lifestyle factors such as smoking and alcohol consumption, as well as conditions such as obesity [6]. Non-modifiable risk factors include age, gender, ethnicity, genetic risk factors, diabetes and chronic pancreatitis [7].
For patients who have a family history of PC or are predisposed to malignancy due to hereditary genetic mutation, PCLs can be identified in up to one-third of such high-risk individuals [8,9]. Germline mutations in BRCA1 and BRCA2 have been shown to confer an increased risk in PC as well as breast and ovarian cancers [10]. Von Hippel–Lindau (VHL) disease, caused by a germline mutation to the VHL tumour-suppressor gene, is associated with an increased risk of pancreatic neuroendocrine tumours and non-malignant serous-type PCLs [11].
One of the most significant risk factors for PCLs is age, with patients typically being diagnosed at 50 years or older and the incidence rate rising exponentially with age thereafter [6,7,8,12]. PCL size and number have been shown to increase with age [13]. Variations in PCL prevalence from country to country can be shown to correlate with population demographics. This geographic variance is further widened by the differences in imaging resolution and the frequency of routine physical check ups within the population [3,14]. Indeed, a 2017 study showed a positive correlation between socioeconomic development (measured through Human Development Index and Gross Domestic Product) and pancreatic cancer incidence and mortality [15]. This observed increase in PC incidence with rising socioeconomic development is thought to be result of the Western lifestyle and ageing population, which are known to be large risk factors of PC [15]. A general improvement in imaging technologies, and also a growth in the ageing population, has caused the worldwide prevalence of PCLs to rise drastically over the last two decades [8,12]. The age- and sex-adjusted prevalence of PCLs in the general population is approximately 2%, but this figure increases exponentially with age and can range up to 45% in older generations [16,17,18]. Notably, while many PCLs are found in symptomatic patients, PCLs are frequently found incidentally in patients undergoing cross-sectional imaging for other reasons—so called ‘incidentalomas’. The incidence rates of such PCLs vary depending on the imaging technique, but can be as high as 19.6% in patients undergoing magnetic resonance imaging (MRI) [19]. With the rising prevalence of PCLs globally and poor survival rates associated with PC, there is a great need for improved characterisation of pre-malignant PCLs to allow surgery in those who need it, while avoiding unnecessary surveillance and intervention in those who do not.
2. Current Management of PCLs
When a patient with a PCL is identified, the first thing to be ascertained is its malignant potential. Broadly speaking, PCLs can be divided into either neoplastic or non-neoplastic cysts, as shown in Figure 1 [12]. Neoplastic cysts can be either mucinous or non-mucinous, with non-mucinous PCLs rarely undergoing malignant transformation [8,12]. Solid pseudopapillary neoplasms and cystic neuroendocrine neoplasms are notable, rare exceptions, as both are non-mucinous cystic lesions that do have some malignant potential and may require surgical resection. However, mucinous PCLs such as IPMNs and MCNs are generally regarded as precursor lesions for PC [8,12,20,21]. IPMNs are the most common pre-malignant PCL, being much more common than MCNs. The biological behaviour of IPMNs are notoriously unpredictable and there are currently a number of clinical guidelines that aim to help stratify the risk of IPMNs undergoing malignant transformation [22]. At present, there are three sets of guidelines in use to guide EUS and surgical referral of patients presenting with asymptomatic PCLs: the 2017 International Association of Pancreatology Fukuoka guidelines [23], the 2015 American Gastroenterological Association (AGA) guidelines [24], and the 2018 European evidence-based guidelines (EEG) [25]. The fact that there are differing consensus guidelines in use is indicative of the imperfect state of knowledge regarding PCLs and PC and the urgent need for improved biological characterisation of these lesions.

IPMNs are classified based on the involvement of the pancreatic ductal system as either main-duct (MD) IPMN, branch-duct (BD) IPMN or when both main and branch ducts are involved, combined-type IPMN [3,12]. Approximately 70% of MD-IPMNs undergo malignant transformation, whereas the rate is much lower in BD-IPMNs, ranging from 6 to 46% [3,26]. Indeed, the incidence rate of PC concomitant with BD-IPMN has been shown to range between 2% and 11.2% [27]. The World Health Organisation describes three grades of IPMN: low–intermediate-grade dysplasia; high-grade dysplasia; and IPMNs with associated invasive carcinoma [12]. Current methodologies and guidelines are limited in their ability to stratify patients into high- and low-risk of malignant transformation [28]. Identification of patients with high-grade dysplasia or early invasive cancer and the ability to predict those most likely to undergo malignant transformation is a key aspect of PCL patient management [24,28].
The most frequently used diagnostic tools for PCLs include computed tomography (CT), magnetic resonance imaging (MRI), and endoscopic ultrasound (EUS) +/- fine-needle aspiration (FNA), all of which have low sensitivity and specificity (SN/SP) for identifying high- and low-risk patients [24]. In the case of BD-IPMNs, risk stratification is based on cyst size and the presence or absence of a mural enhancing nodule. For MD-IPMNs, the diameter of the main pancreatic duct is accepted as an indicator of malignant risk [21,24,25]. A 2017 retrospective study assessed the ability of these two sets of guidelines to identify malignant cysts, and found that even when combined, 11.8% of malignant cysts were not identified [28]. Although this study had some self-identified bias (it included only higher risk patients), it highlighted the suboptimal performance of current clinical guidelines, even in expert centres [28]. Surgical resection is associated with significant morbidity and mortality and should be reserved for those at high risk of malignant transformation or established cancer [24]. Moreover, there is a 20% recurrence rate following surgical resection for IPMN [31], and recent studies have found multiple distinct regions of dysplasia within the pancreas, sometimes with differing mutational status of the same gene, supporting the notion of a multi-focal tumorigenic process of IPMN within the pancreas [4,31,32].
EUS-guided FNA is a safe and accurate method of extracting cyst fluid or pancreatic tissue from a patient for further analysis [26,33]. Cyst fluid cytology has high specificity for malignancy or high-grade dysplasia, but low sensitivity due to the typically low cellularity of PCL samples [26,33]. A 12 year multi-institutional study conducted by the French Surgical Association found that 50% of patient cyst fluid samples collected were non-diagnostic and acellular [34]. Diagnosis of PCLs by EUS requires attention to cyst morphology, including size, number of cysts present, characteristics of the wall and internal structures, calcification, positioning in relation to the main pancreatic duct and presence of lesions in the background [12]. These descriptors are considerably operator dependent and PCL characterisation without cyst fluid analysis is limited [3,26].
While the low cellularity of PCL fluid limits cytological yield, biochemical analysis of PCL fluid has proven an important adjunct in characterising PCLs. Cyst fluid CEA has been shown to have a sensitivity of between 59 and 67% and specificity of 83–91% for detection of mucinous cysts, and is among the best of the biomarkers currently available [20,35]. Mutational profiling of patients has shown utility in the characterisation of different PCL subtypes. However, genetic evaluation of PCL fluid is currently limited to research. KRAS and GNAS mutations in the cyst fluid are particularly important early mutations in IPMNs as they are not found in other common types of cysts [32]. The development of novel biomarkers within the cyst fluid has proven difficult to date due to the heterogeneic nature of the fluid. CA19-9 is a tetrasaccharide antigen released by pancreatic cancer cells and is an established marker for PC, but has low SN/SP and is not elevated in pre-malignant PCLs [36]. However, there is some evidence that CA19-9 is contributive, and most PCL guidelines advocate for its use in surveillance. Indeed, the importance of such minimally invasive serological biomarkers for use in tandem with non-invasive imaging to identify high-risk patients should not be underestimated. Based on all the aforementioned limitations of current diagnostics, it is clear therefore that there is an urgent need for novel methods and markers to accurately classify and risk stratify PCLs, and we believe that the ‘omics’ revolution is poised to fill this void of information.
3. Identification of Biomarkers in PCLs and PC Using Omics
The omics field has made huge strides in the past two decades, largely due to technological advancements, enabling the cost-effective and high-throughput analysis of biological molecules or ‘biomarkers’ [37]. Some omics disciplines are demonstrating great potential in the search for a novel biomarker for PC (Table 1), but the data for PCLs are much more limited.
Table 1. Overview of biomarkers in PC and PCLs that have been validated in an independent cohort.
|
Biomarker Name |
Biomarker Type |
Single or Multi-Study Validated |
Platform |
Sample Type |
Sample Size (Total Number Patients) |
Sensitivity (95% Confidence Interval) |
Specificity (95% Confidence Interval) |
P-Value |
Purpose |
References |
|---|---|---|---|---|---|---|---|---|---|---|
|
KRAS and/OR GNAS |
Genetic mutation panel |
Multi |
PCR |
Cyst fluid |
91 |
65% |
100% (83–100) |
N/A |
MCN vs. non-MCN |
[38] |
|
(52–76) |
98% |
|||||||||
|
84% |
(86–100) |
N/A |
IPMN vs. non-IPMN |
|||||||
|
(70–92) |
||||||||||
|
95.50% |
||||||||||
|
PCR using NGS |
Cyst fluid |
197 |
68.50% |
(N/A) |
N/A |
IPMN vs. non-IPMN |
[39] |
|||
|
(N/A) |
||||||||||
|
100% |
||||||||||
|
NGS |
Cyst fluid |
595 |
89% |
(88–100) |
N/A |
MCN vs. non-MCN |
[40] |
|||
|
(79–95) |
100% |
|||||||||
|
Sanger sequencing |
Cyst fluid |
159 |
65% |
(N/A) |
N/A |
MCN vs. non-MCN |
||||
|
(N/A) |
||||||||||
|
lncRNA-TFG |
Long noncoding RNA |
Single |
Affymetrix human exon 1.0 ST |
Tissue |
28 |
N/A |
N/A |
6.23 × 10⁻⁸ |
Positive correlation with tumorigenesis in IPMNs |
[41] |
|
CTD-2033D15.2 |
Long non-coding RNA |
Single |
Affymetrix human exon 1.0 ST |
Tissue |
28 |
N/A |
N/A |
1.47 × 10⁻⁴ |
Negative correlation with tumorigenesis in IPMNs |
[41] |
|
HAND2-AS1 |
Long non-coding RNA |
Single |
Affymetrix human exon 1.0 ST |
Tissue |
28 |
N/A |
N/A |
2.66 × 10⁻³ |
Negative correlation with tumorigenesis in IPMNs |
[41] |
|
Glucose |
Metabolite |
Multi |
Liquid chromatography |
Cyst fluid |
19 |
94% |
64% |
0.004 |
Glucose ≤ 66 mg/dL in MCNs vs. non-MCNs |
[42] |
|
(N/A) |
(N/A) |
|||||||||
|
Glucometer |
Glucose ≤ 50 mg/dL in MCNs vs. non-MCNs |
|||||||||
|
Cyst fluid |
153 |
92% |
87% |
N/A |
[43] |
|||||
|
(N/A) |
(N/A) |
|||||||||
|
Kynurenine |
Metabolite |
Single |
Liquid chromatography |
Cyst fluid |
19 |
90% |
100% |
0.002 |
Lower in MCNs vs. non-MCNs |
[42] |
|
(N/A) |
(N/A) |
|||||||||
|
AcSperm and |
Metabolite panel |
Single |
Mass spectrometry |
Blood plasma |
121 |
66.70% |
95% |
N/A |
PDAC vs. N |
[44] |
|
DAS and |
(N/A) |
(N/A) |
||||||||
|
LPC(18: 0) and LPC(20: 3) and indole derivative |
||||||||||
|
ADAMTS1 |
Methylated gene |
Single |
Methylation on beads |
Blood cfDNA |
39 |
87.20% |
95.80% |
N/A |
PDAC vs. N |
[45] |
|
(N/A) |
(N/A) |
|||||||||
|
BNC1 |
Methylated gene |
Single |
Methylation on beads |
Blood cfDNA |
39 |
64.10% |
93.70% |
N/A |
PDAC vs. N |
[45] |
|
(N/A) |
(N/A) |
|||||||||
|
SOX17 |
Methylated gene |
Single |
Methylation-specific ddPCR |
Cyst fluid |
154 |
78.40% |
85.60% |
N/A |
High-risk PCL vs. low-risk PCLs |
[46] |
|
(64.7–88.7) |
(78.4–91.1) |
|||||||||
|
TBX15 and BMP3 |
Methylated gene marker panel |
Single |
Whole-genome methylome discovery and qPCR |
Cyst fluid |
134 |
90% |
92% |
N/A |
HGD/PC vs. LGD/N |
[47] |
|
(70–99) |
(85–96) |
|||||||||
|
ADAMTS1 and/OR BNC1 |
Methylated gene panel |
Single |
Methylation on beads |
Blood cfDNA |
39 |
97.40% |
91.60% |
N/A |
PDAC vs. N |
[45] |
|
(N/A) |
(N/A) |
|||||||||
|
FOXE1 and SLIT2 and |
Methylated gene panel |
Single |
Methylation-specific ddPCR |
Cyst fluid |
154 |
84.30% |
89.40% |
N/A |
High-risk PCL vs. low-risk PCLs |
[46] |
|
EYA4 and SFRP1 |
(N/A) |
(N/A) |
||||||||
|
miR-1290 |
MicroRNA |
Multi |
MicroRNA array analysis |
Blood serum |
60 |
88% |
84% |
N/A |
PC vs. N |
[48] |
|
(N/A) |
(N/A) |
|||||||||
|
76 |
83% |
69% |
N/A |
PC vs. CP |
||||||
|
(N/A) |
(N/A) |
|||||||||
|
95 |
83% |
78% |
N/A |
PC vs. CP and N |
||||||
|
(N/A) |
(N/A) |
|||||||||
|
qRT-PCR |
Blood plasma |
|||||||||
|
49 |
N/A |
N/A |
0.027 |
PDAC vs. N |
[49] |
|||||
|
Blood serum |
||||||||||
|
qRT-PCR |
||||||||||
|
200 |
74.20% |
91.20% |
N/A |
PC vs. C |
[50] |
|||||
|
(N/A) |
(N/A) |
|||||||||
|
9-miRNA model a |
MicroRNA panel |
Single |
TaqMan miRNA Array |
Tissue and |
33 and 50 |
89% |
100% |
N/A |
HG IPMNs, PanNETs and SPNs vs. LG IPMNs and SCAs |
[51] |
|
cyst fluid |
(N/A) |
(N/A) |
||||||||
|
miR-3679-5p and miR-940 |
MicroRNA panel |
Single |
qPCR |
Saliva |
80 |
72.50% |
70.00% |
N/A |
PC vs. N |
[52] |
|
(N/A) |
(N/A) |
|||||||||
|
60 |
62.50% |
80.00% |
N/A |
PC vs. BPT |
||||||
|
(N/A) |
(N/A) |
|||||||||
|
100 |
70.00% |
70.00% |
N/A |
PC vs. N and BPT |
||||||
|
(N/A) |
(N/A) |
|||||||||
|
CA19-9 |
Protein- |
Multi |
Bead-based xMAP immunoassay |
Blood serum |
267 |
57.20% |
90% |
N/A |
PDAC vs. N |
[53] |
|
associated |
(N/A) |
(N/A) |
||||||||
|
ELISA |
||||||||||
|
Blood plasma |
||||||||||
|
176 |
77.50% |
83.10% |
N/A |
CA19-9 >20.3 U/mL |
[54] |
|||||
|
Retrospective clinical data |
Blood serum |
(N/A) |
(N/A) |
PDAC vs. C |
||||||
|
41 |
90% |
83.33% |
N/A |
2.45 times elevated CA19-9 indicated recurrence of PC |
[55] |
|||||
|
(N/A) |
(N/A) |
|||||||||
|
CEA |
Protein |
Multi |
Clinical data |
Cyst fluid |
31 |
73% |
89% |
N/A |
CEA > 192 ;ng/mL for MCN |
[42] |
|
(N/A) |
(N/A) |
|||||||||
|
ELISA |
Cyst fluid |
149 |
95.50% |
81.50% |
<0.0001 |
CEA ≤ 10 ng/mL for SCN |
[56] |
|||
|
(N/A) |
(N/A) |
|||||||||
|
Enzyme-linked immunosorbent assay |
Cyst fluid |
153 |
58% |
96% |
N/A |
CEA > 192 ng/mL for MC |
[43] |
|||
|
(N/A) |
(N/A) |
|||||||||
|
MUC5AC:WGA and MUC5AC:BGH and Endorepellin:WGA |
Protein |
Multi |
Antibody-lectin sandwich microarray |
Cyst fluid |
147 |
92% b |
94% b |
N/A |
Elevation in any two differentiates MCNs vs. non-MCNs |
[57] |
|
panel |
(N/A) |
(N/A) |
||||||||
|
Antibody-lectin sandwich arrays |
Elevation in any two differentiates MCNs vs. non-MCNs |
|||||||||
|
Cyst fluid |
22 |
87% |
100% |
N/A |
[58] |
|||||
|
(N/A) |
(N/A) |
|||||||||
|
Thymosin- β4 |
Protein |
Single |
MALDI imaging and mass spectrometry |
Tissue |
45 |
70% |
71% |
0.011 |
Overexpressed in IPMN with HGD |
[59] |
|
(N/A) |
(N/A) |
|||||||||
|
Ubiquitin |
Protein |
Single |
MALDI imaging and mass spectrometry |
Tissue |
45 |
94% |
86% |
0.04 |
Overexpressed in IPMN with HGD |
[59] |
|
(N/A) |
(N/A) |
|||||||||
|
VEGF-A |
Protein |
Single |
ELISA |
Cyst fluid |
149 |
100% |
83.70% |
<0.0001 |
VEGF-A > 5000 pg/mL benign SCN |
[56] |
|
(N/A) |
(N/A) |
|||||||||
|
VEGF-A and CEA |
Protein panel |
Single |
ELISA |
Cyst fluid |
149 |
95.50% |
100% |
N/A |
VEGF-A > 5000 pg/mL and CEA ≤ 10 ng/mL in benign SCN |
[56] |
BPT = benign pancreatic tumour, C = non-cancer control, CP = chronic pancreatitis, ELISA = enzyme-linked immunosorbent assay, HG = high grade, HGD = high-grade dysplasia, IPMN = intraductal papillary mucinous neoplasm, LG = low grade, LGD = low-grade dysplasia, MALDI = matrix-assisted laser desorption ionisation, MC = mucinous cyst, MCN = mucinous cystic neoplasm, N = normal healthy, N/A = not available, NGS = next-generation sequencing, PanNET = pancreatic neuroendocrine tumour, PC = pancreatic cancer, PCL = pancreatic cystic lesion, PCR = polymerase chain reaction, PDAC = pancreatic ductal adenocarcinoma, SCN = serous cystic neoplasm, and SPN = solid-pseudopapillary neoplasm. a Model is intellectual property of the authors. b Average of three cohorts.
4. Multi-Omics as the Key to Biomarker Identification
In the case of PCL and PC characterisation, though these new ‘omics’ techniques have been utilised to analyse the pancreatic cyst fluid, blood serum and even saliva of patients, no single methodology has proven to be a sufficiently sensitive method for delineating these patients into defined categories. Multi-omics involves the integration of multiple layers of omics-type data to augment our understanding of disease and helps researchers to elucidate the flow of information, from the origin of the disease to the biological and functional consequences [37]. By investigating multiple aspects of the PCL fluid or blood serum, and treating these data as an interconnected system, rather than distinct and independent pieces, multi-omics could allow researchers to identify key pathways and players in disease stratification. CompCyst is a comprehensive test developed using machine learning techniques to guide the management of patients with PCLs [113]. This test utilises selected clinical features such as symptoms, cyst size and location, as well as cyst fluid genetic and biochemical markers, including cyst CEA levels and KRAS and GNAS mutation status [113]. Interrogation of multiple levels of patient data enabled cut offs for each marker to be determined based on the needs of the test, and the level of importance given to the sensitivity or specificity of each individual marker. The results of this study suggest that if CompCyst were applied to general PCL management, 60% of unnecessary surgeries could be avoided [113]. While these results seem promising, it is important to note that patients evaluated in this study were those most concerning for cancer and do not represent patients seen in routine clinical practice [113]. While more research is needed to examine the utility of this test in a normal clinical setting, this study shows that layering multiple levels of patient data can potentially improve management strategies for PCLs. Interestingly, a 2018 report describes a multi-analyte blood test called CancerSeek, which assesses levels of circulating proteins and mutations in cell-free DNA to detect one of eight common cancer types (ovarian, liver, stomach, pancreatic, oesophageal, colorectal, lung, or breast) [114]. When combined with supervised machine learning, this test was able to localise the source of the cancer to two anatomic sites in a median of 83% of patients (n = 626). While not specific to PC, this test shows the stark advantage of combining distinct approaches to create a robust diagnostic tool.
In terms of PCLs and PC, multi-omics opens the door to the possibility of a biomarker panel for characterisation, such that combined thresholds of several markers could prove more sensitive than a single marker alone. A 2020 systematic review examined novel biomarkers for upper GI cancers, identifying 431 biomarkers, of which more than half (n = 231) were for PC [115]. Only one-fifth of the biomarkers reported in this review were examined in more than one study, and of those that were, there were only two single markers and one panel of markers for PC. Such reviews of the literature show the current state of PC research, where most of those markers that are identified are not examined further and as such never become clinically useful. As mentioned previously, the addition of GNAS to KRAS testing for the diagnosis of IPMNs does not significantly increase diagnostic accuracy. However, the same study found that the combination of GNAS and KRAS mutational status with CEA testing does produce a significantly better accuracy of 86.2% (p < 0.05) [39]. A 2015 multi-centre study retrospectively examined the cyst fluid of 130 patients and identified molecular markers and clinical features that classified PCLs with a sensitivity of 90–100% and a specificity of 92–98% [116]. Using the Multivariate Organisation of Combinatorial Alterations (MOCA) algorithm to identify composite clinical and molecular markers (subtle mutations, loss-of-heterozygosity, aneuploidy) of PCL type and grade, this study identified a panel of both clinical and molecular markers for the distinction of serous cystadenomas (SCA), solid-pseudopapillary neoplasm (SPN), MCNs and IPMNs. Furthermore, it was shown that these features could identify 67 of the 74 patients who did not require surgery, resulting in a reduction in unnecessary procedures by 91%. These results show great promise for the characterisation of PCLs and the stratification of patients for subsequent referral to surgery, and further studies in more robust, experimental validation cohorts will help to further elucidate the potential of this panel in the context of PC.
A key example of the multi-omic nature of driver mutations in the context of PC is KRAS, which is mutated in ~90% of PC (Figure 2) [117]. Environmental factors, such as smoking or alcohol consumption, can promote biochemical alterations to DNA at the epigenomic level, for example hypermethylation [118]. The addition of a methyl group to the CpG island of a DNA repair gene can cause silencing and subsequently result in reduced DNA repair proficiency, allowing a mutated KRAS codon to proceed from the genomic level to the transcriptomic level. The transcription of this KRAS mutation results in altered miRNA expression levels, and the mutated mRNA cannot be bound by the regulatory miRNA let-7, thus causing the aberrant translation of K-Ras protein [119,120,121]. The marked increase in K-Ras production promotes various signalling pathways, including phosphoinositide 3-kinase (PI3K), mitogen-activated protein kinase (MAPK) and the RAL-GEFs pathway [117]. GTP-bound K-Ras proteins can interact with, and influence the activity of, effector proteins causing downstream effects in many cellular pathways [117]. Moreover, KRAS mutant PCLs have been shown to have increased expression of the glucose transporter GLUT1 and subsequently elevated rates of glycolysis, indicating that KRAS mutations play a role in the metabolic switch observed in PC [122]. Indeed, the presence of KRAS mutations in PC has been shown to correlate with poor patient prognosis, and this can be attributed to the downstream effects seen in multiple omics layers as a result of this point mutation (Figure 2) [123]. This example illustrates the multi-omic nature of mutational drivers in cancer and the importance of disentangling each aspect in order to clearly observe the pathways affected and the impacts at each omics level.
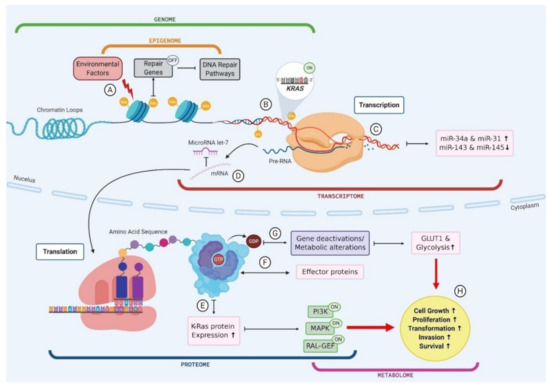
Figure 2. The multi-omic nature of KRAS mutations in pancreatic cancer. (A) Environmental factors cause biochemical alterations to the DNA such as hypermethylation. This can result in the silencing of repair genes and subsequently failure in DNA repair pathways; (B) Point mutations in a KRAS codon go unchecked as a result of DNA repair failure causing permanent activation of KRAS gene; (C) Mutant KRAS gene is transcribed into mRNA and subsequently results in an upregulation of miR-34a and miR-31 and a downregulation in miR143 and miR-145; (D) mutant KRAS mRNA cannot be bound by regulatory miR let-7 and leaves the cell nucleus to be translated; (E) Mutant KRAS causes an increase in K-Ras protein expression, which causes activation of PI3K, MAPK and RAL-GEF pathways; (F) GTP bound KRAS interacts with various effector proteins and influences the localisation and activities of these effectors; (G) K-Ras proteins convert GTP to GDP which causes gene deactivations and metabolic alterations such as an increase in GLUT1 expression and subsequently an increase in glucose uptake via glycolysis; (H) Changes to cellular protein expression, gene activation and metabolic processes results in increased cell growth and proliferation, driving transformation.
This entry is adapted from the peer-reviewed paper 10.3390/cancers13040769