Mechanistic understanding of germ cell formation at a genome-scale level can aid in developing novel therapeutic strategies for infertility. Germ cell formation is a complex process that is regulated by various mechanisms, including epigenetic regulation, germ cell-specific gene transcription, and meiosis.
- scRNA-seq
- germ cell
- transcriptome
- reproductive medicine
- fertility
1. Introduction
The male and female germ cells combine to form the zygote, and this process is called fertilization. The development of fertilization-competent germ cells involves complex regulatory processes, including germ cell-specific cell division (meiosis), re-establishment of sex-specific imprinting genes, and acquisition of sex-specific dimorphic characteristics [1][2][3]. Various studies have attempted to elucidate the mechanism underlying germ cell development using several model systems. The key biological pathways and molecules involved in germ cell development and fertilization have been identified. In the field of reproductive medicine, these molecules serve as diagnostic and therapeutic biomarkers for patients with reproductive disorders [4][5].
Genome-scale analyses of germ cells provide promising insights into the fields of developmental biology and reproductive medicine. However, the numbers of developing and meiotic germ cells are limited. Hence, conventional genome analysis approaches have limitations to delineate genomic, transcriptomic, and epigenomic regulation at a single-cell resolution. In the conventional bulk sequencing method, numerous heterogeneous cells are subjected to sequencing. Most studies have adopted the bulk sequencing method, which can capture global or representative gene expression patterns or chromatin conformations of the pooled cells. However, this method does not account for cell-to-cell heterogeneity. The differentiation of immature germ cells, including progenitor primordial germ cells (pre-PGCs) and primordial germ cells (PGCs), into mature germ cells involves various steps [1][6]. Thus, a small degree of epigenomic heterogeneity could result in distant cell fate, which is not captured by bulk sequencing. To overcome this limitation, single-cell sequencing (SC-seq) was developed in the last decade [7]. The SC-seq can identify the developmental fate of each cell. The SC-seq technique was first developed using germ cells (oocytes) and preimplantation embryos (blastocysts). Various studies have improved the single-cell isolation and sequencing library preparation techniques. Currently, the most common method of SC-seq is single-cell RNA sequencing (scRNA-seq). The scRNA-seq can identify cell-to-cell heterogeneity within a mixed cell population without averaging the cell-specific gene expression levels. Additionally, scRNA-seq enables cell lineage tracing analysis. Cell heterogeneity from the scRNA-seq data can be visualized using principal component analysis, t-stochastic neighbor embedding (t-SNE), or uniform manifold approximation and projection [8][9]. The plots display cells with similar sequencing read characteristics as a cluster. The analysis of a sufficient number of cells can reveal their lineage trajectory, which could provide valuable information for low-input and complex samples. The scRNA-seq can be a useful tool to analyze rare and scarce target cells. Bulk sequencing involves cell sorting techniques, such as fluorescence-activated cell sorting (FACS) and magnetic-activated cell sorting (MACS), to isolate the target cells. However, the low number of rare and mixed cell types is a major limitation for sorting these cells as they yield a small library size for bulk sequencing. If the rare cells are not impaired during sequencing, scRNA-seq can bypass the cell sorting and isolation procedures and capture their unique characteristics. Therefore, scRNA-seq can be employed in studies involving germ cells, zygotes, and preimplantation embryos.
2. Evolution of scRNA-seq Technique
The scRNA-seq was first used to examine the transcriptome of mouse oocytes and blastocysts and identify the aberrantly expressed genes in Dicer1 or Ago2 knockout oocytes and blastocysts [7]. The study reported that scRNA-seq identified a higher number of differentially expressed genes (DEGs) than microarray analysis. Other studies have modified and improved the scRNA-seq protocol. The advanced methods include Smart-seq [10][11], CEL-seq [12][13], Qualtz-seq [14], MARS-seq [15], Cyto-seq [16], SUPeR-seq [17], Drop-seq [18], InDrop [19], MATQ-seq [20], Chromium [21], sci-RNA-seq [22], Seq-Well [23], DroNC-seq [24], and SPLiT-seq [25] (Table 1). Generally, scRNA-seq involves the following steps: preparation of in vitro or in vivo samples, dissociation of the sample into single cells, barcode tagmentation of individual cells and reverse transcription, library preparation, massively parallel sequencing, and downstream bioinformatics analysis (Figure 1). Various scRNA-seq methods differ in at least one of the aforementioned steps. Furthermore, some scRNA-seq protocols, including Drop-seq [18], InDrop [19], and Chromium [21], utilize droplet-based technologies in which dissociated individual cells are encapsulated into oil droplets and subjected to barcode tagmentation as well as amplification using microfluidic devices [26]. These methods are suitable for analyzing samples containing mixed cell populations, examining transcriptomic heterogeneity in the mixed cell population, and cell lineage tracing experiments. When Tang et al. first introduced scRNA-seq [7], the method did not involve microfluidic manipulation as individual oocytes or preimplantation embryos were manually selected under the microscope. In addition to the manual single-cell isolation methods, the conventional cell separation techniques, including FACS, MACS, and laser capture microdissection, have been employed for single-cell separation and harvesting. The sequencing read coverage also varies among the scRNA-seq methods. Smart-seq [10], MATQ-seq [20], and SUPeR-seq [17] can sequence almost full-length transcripts, whereas other methods can sequence either 5′ end (STRT-seq) or 3′ end (Drop-seq [18], DroNC-seq [24], Seq-Well [23], and SPLiT-seq [25]) of the transcripts. The full-length sequencing method, which can detect splice variants and strand-specific transcripts, has more advantages than the methods that sequence 5′ or 3′ ends of the transcripts. MATQ-seq [20] and SUPeR-seq [17], which are reported to detect both polyA(+) and polyA(−) transcripts simultaneously, are optimized for the examination of non-coding RNAs.
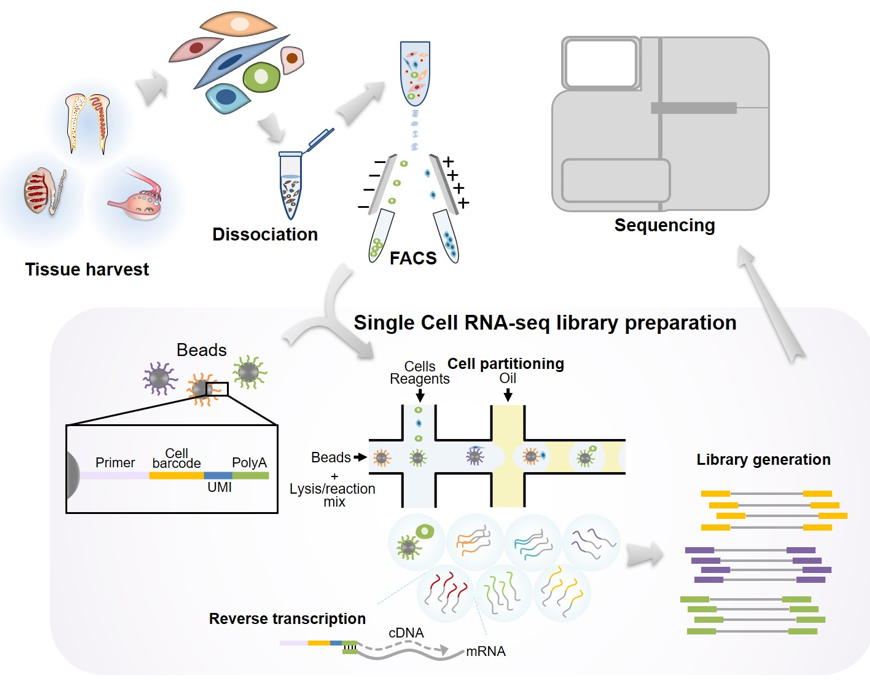
Figure 1. Schematic illustration showing the procedure of scRNA-seq in gonadal tissues. Reproductive tissues are isolated and enzymatically dissociated. Highly pure single cell populations are obtained by conventional cell sorting methods such as fluorescence-activated cell sorting (FACS) or magnetic-activated cell sorting (MACS). Uniquely barcoded beads are required for microfluid-based scRNA-seq. Technically, one cell is interacted with a bead, and subsequently the cells are subjected to cell lysis for the preparation of mRNAs. The isolated mRNAs are used for reverse transcription. Finally, scRNA-seq libraries containing bead-specific oligo sequences and unique molecular identifier (UMI) are generated.
Table 1. Summary of technical features of the scRNA-seq methods described in the entry.
| Methods | Summary | Advantages | Challenges |
|---|---|---|---|
| Smart-seq [10][11] |
|
|
|
| CEL-seq [12][13] |
|
|
|
| Qualtz-seq [14] |
|
|
|
| MARS-seq [15] |
|
|
|
| Cyto-seq [16] |
|
|
|
| SUPeR-seq [17] |
|
|
|
| Drop-seq [18] |
|
|
|
| InDrop [19] |
|
|
|
| MATQ-seq [20] |
|
|
|
| Chromium [21] |
|
|
|
| sci-RNA-seq [22] |
|
|
|
| Seq-Well [23] |
|
|
|
| DroNC-seq [24] |
|
|
|
| SPLiT-seq [25] |
|
|
|
The signal-to-noise ratio of scRNA-seq is low owing to the low amount of input sequences. To overcome this limitation, a normalization method for measuring endogenous transcript levels should be employed. Currently, unique molecular identifiers (UMIs) or spike-in controls have been used for normalization [27]. The UMIs are used to determine the absolute transcript levels. Spike-ins, such as the external RNA control consortium controls from different species with known sequences and concentrations, are used to calculate the relative levels of endogenous transcripts. Previous studies have demonstrated that UMIs (approximately 5 bp in length) can reduce technical noise and aid in fitting the sequencing reads into statistical models [28][29][30]. Spike-in controls with known concentrations of synthetic transcripts can be used to calculate the differences between expected and observed expression of the spike-ins along with a cell type-specific factor that adjusts the difference. Next, the cell type-specific factor is applied to obtain the normalized level of endogenous transcripts. The spike-in normalization method has been successfully used in the development of statistical models that can be applied to various scRNA-seq experiments [31][32][33].
3. Germ Cell Development
Mouse and human germ cells are unipotent cells that can differentiate into oocytes or sperms [1][34][35]. In mice, the germ cells begin to form a subset of specialized mesoderm-origin cells called PGCs at the extraembryonic region of the epiblast during gastrulation (Figure 2). The specified PGCs then migrate and colonize the genital ridge. The migrating PGCs are reported to undergo epigenetic reprogramming, including global DNA demethylation, imprinting erasure and re-establishment, and histone methylation (H3K9me2 and H3K27me3) [36][37][38]. The bone morphogenetic protein (BMP)- small mother against decapentaplegic (SMAD) signaling axis mediates PGC specification by activating critical transcription factors (TFs), including BLIMP1, PRDM14, and TFAP2C [39][40] (Figure 2). The TF-regulated transcriptional circuit modulates the activation of germ cell-specific gene expression and repression of somatic cell lineage-specific gene expression [41][42][43][44]. The loss of at least one of the key TFs leads to impaired PGC specification and repression of mature germ cell formation.
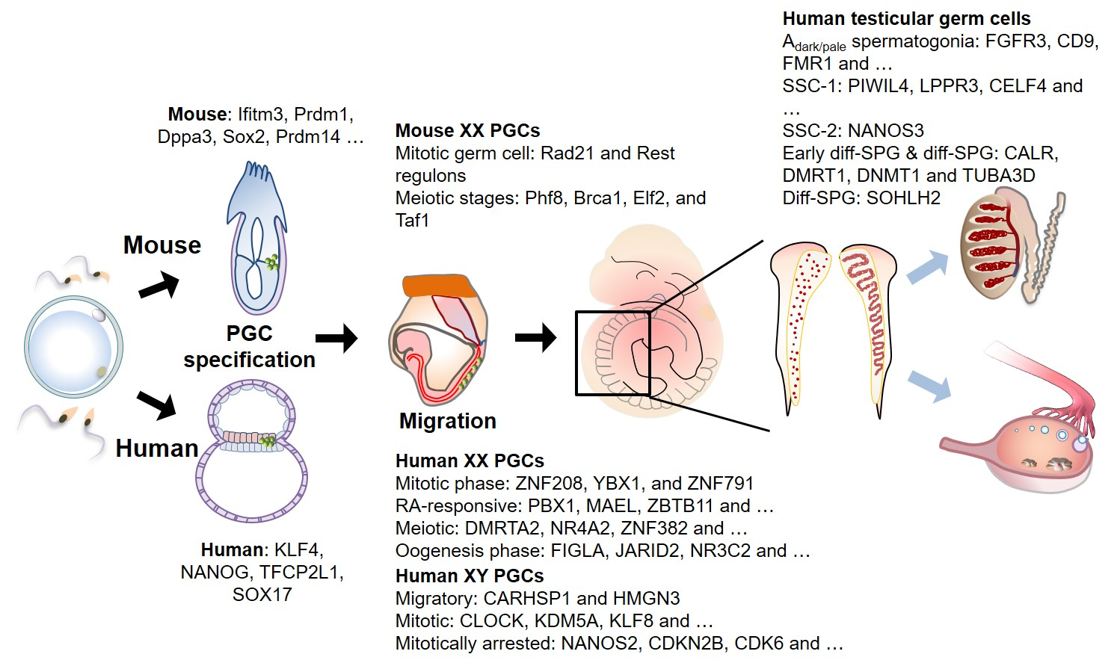
Figure 2. Human and mouse germ cell development and associated genes. Primordial germ cells (PGCs, marked as green) can be recognized for the first time at the extraembryonic region of epiblast in mouse (at ~E6.25) and a layer between epiblast and visceral endoderm in human (at ~2 to 3 weeks of gestation) during gastrulation. These cells migrate towards the genital ridge during embryo turning, and simultaneously undergo extensive epigenetic reprogramming. Upon arrival at the genital ridge, PGCs are dispersed in the female genital ridge and organized to make a winding tubular pattern in male genital ridge. Multiple scRNA-seq studies in various stages of germ cell development were performed to elucidate cellular diversity, and critical gene expression signatures in developing germ cells, terminating mitosis and entering meiosis. Stage-specific genes identified by scRNA-seq are noted. SSC: spermatogenic stem cells, diff-SPG: differentiating spermatogonium.
The male and female germ cells undergo dimorphic differentiation processes after they reach the genital ridge [45]. In the genital ridge, the male germ cells become mitotically quiescent (arrested at G0/G1 phase) after several cell divisions and begin to proliferate after birth [46]. The proliferating male germ cells colonize at the base of the seminiferous tubule and transform into spermatogonial stem cells, which are diploid cells that give rise to mature spermatozoa [47]. In contrast, the female PGCs reach the genital ridge and undergo meiosis I. The cell cycle of female PGCs is arrested at the diplotene of meiotic prophase I. During puberty, the female germ cells resume meiosis I, enter meiosis II, and complete meiosis II after fertilization [48].
Various studies have demonstrated that transcriptional regulation by TFs is conserved using an embryonic stem cell (ESC)-derived in vitro germ cell differentiation model. However, the downstream gene networks in humans are distinct from those in mice. For example, a group of pluripotent genes, comprising Sox2, Esrrb, and Klf2, are expressed in mouse PGCs, whereas KLF4 and TFCP2L1 are expressed in human PGC (hPGC)-like cells (Figure 2). SOX17 upregulates the expression of BLIMP1 and TFAP2C in hPGCs, which is not observed in mouse PGCs. The formation of PGC-like cells from ESCs is hindered upon the loss of SOX17 [34]. Therefore, these studies suggest the presence of both common and unique TF circuits during PGC development across different species.
This entry is adapted from the peer-reviewed paper 10.3390/ijms22020823
References
- Saitou, M.; Yamaji, M. Primordial germ cells in mice. Cold Spring Harb. Perspect. Biol. 2012, 4.
- Sybirna, A.; Wong, F.C.K.; Surani, M.A. Genetic basis for primordial germ cells specification in mouse and human: Conserved and divergent roles of PRDM and SOX transcription factors. Curr. Top. Dev. Biol. 2019, 135, 35–89.
- Irie, N.; Sybirna, A.; Surani, M.A. What Can Stem Cell Models Tell Us About Human Germ Cell Biology? Curr. Top. Dev. Biol. 2018, 129, 25–65.
- Xavier, M.J.; Salas-Huetos, A.; Oud, M.S.; Aston, K.I.; Veltman, J.A. Disease gene discovery in male infertility: Past, present and future. Hum. Genet. 2020.
- Yatsenko, S.A.; Rajkovic, A. Genetics of human female infertilitydagger. Biol. Reprod. 2019, 101, 549–566.
- Saitou, M.; Yamaji, M. Germ cell specification in mice: Signaling, transcription regulation, and epigenetic consequences. Reproduction 2010, 139, 931–942.
- Tang, F.; Barbacioru, C.; Wang, Y.; Nordman, E.; Lee, C.; Xu, N.; Wang, X.; Bodeau, J.; Tuch, B.B.; Siddiqui, A.; et al. mRNA-Seq whole-transcriptome analysis of a single cell. Nat. Methods 2009, 6, 377–382.
- Kobak, D.; Berens, P. The art of using t-SNE for single-cell transcriptomics. Nat. Commun. 2019, 10, 5416.
- Becht, E.; McInnes, L.; Healy, J.; Dutertre, C.A.; Kwok, I.W.H.; Ng, L.G.; Ginhoux, F.; Newell, E.W. Dimensionality reduction for visualizing single-cell data using UMAP. Nat. Biotechnol. 2018.
- Ramskold, D.; Luo, S.; Wang, Y.C.; Li, R.; Deng, Q.; Faridani, O.R.; Daniels, G.A.; Khrebtukova, I.; Loring, J.F.; Laurent, L.C.; et al. Full-length mRNA-Seq from single-cell levels of RNA and individual circulating tumor cells. Nat. Biotechnol. 2012, 30, 777–782.
- Picelli, S.; Bjorklund, A.K.; Faridani, O.R.; Sagasser, S.; Winberg, G.; Sandberg, R. Smart-seq2 for sensitive full-length transcriptome profiling in single cells. Nat. Methods 2013, 10, 1096–1098.
- Hashimshony, T.; Wagner, F.; Sher, N.; Yanai, I. CEL-Seq: Single-cell RNA-Seq by multiplexed linear amplification. Cell Rep. 2012, 2, 666–673.
- Yanai, I.; Hashimshony, T. CEL-Seq2-Single-Cell RNA Sequencing by Multiplexed Linear Amplification. Methods Mol. Biol. 2019, 1979, 45–56.
- Sasagawa, Y.; Nikaido, I.; Hayashi, T.; Danno, H.; Uno, K.D.; Imai, T.; Ueda, H.R. Quartz-Seq: A highly reproducible and sensitive single-cell RNA sequencing method, reveals non-genetic gene-expression heterogeneity. Genome Biol. 2013, 14, R31.
- Jaitin, D.A.; Kenigsberg, E.; Keren-Shaul, H.; Elefant, N.; Paul, F.; Zaretsky, I.; Mildner, A.; Cohen, N.; Jung, S.; Tanay, A.; et al. Massively parallel single-cell RNA-seq for marker-free decomposition of tissues into cell types. Science 2014, 343, 776–779.
- Fan, H.C.; Fu, G.K.; Fodor, S.P. Expression profiling. Combinatorial labeling of single cells for gene expression cytometry. Science 2015, 347, 1258367.
- Fan, X.; Zhang, X.; Wu, X.; Guo, H.; Hu, Y.; Tang, F.; Huang, Y. Single-cell RNA-seq transcriptome analysis of linear and circular RNAs in mouse preimplantation embryos. Genome Biol. 2015, 16, 148.
- Macosko, E.Z.; Basu, A.; Satija, R.; Nemesh, J.; Shekhar, K.; Goldman, M.; Tirosh, I.; Bialas, A.R.; Kamitaki, N.; Martersteck, E.M.; et al. Highly Parallel Genome-wide Expression Profiling of Individual Cells Using Nanoliter Droplets. Cell 2015, 161, 1202–1214.
- Klein, A.M.; Mazutis, L.; Akartuna, I.; Tallapragada, N.; Veres, A.; Li, V.; Peshkin, L.; Weitz, D.A.; Kirschner, M.W. Droplet barcoding for single-cell transcriptomics applied to embryonic stem cells. Cell 2015, 161, 1187–1201.
- Sheng, K.; Cao, W.; Niu, Y.; Deng, Q.; Zong, C. Effective detection of variation in single-cell transcriptomes using MATQ-seq. Nat. Methods 2017, 14, 267–270.
- Zheng, G.X.; Terry, J.M.; Belgrader, P.; Ryvkin, P.; Bent, Z.W.; Wilson, R.; Ziraldo, S.B.; Wheeler, T.D.; McDermott, G.P.; Zhu, J.; et al. Massively parallel digital transcriptional profiling of single cells. Nat. Commun. 2017, 8, 14049.
- Cao, J.; Packer, J.S.; Ramani, V.; Cusanovich, D.A.; Huynh, C.; Daza, R.; Qiu, X.; Lee, C.; Furlan, S.N.; Steemers, F.J.; et al. Comprehensive single-cell transcriptional profiling of a multicellular organism. Science 2017, 357, 661–667.
- Aicher, T.P.; Carroll, S.; Raddi, G.; Gierahn, T.; Wadsworth, M.H., 2nd; Hughes, T.K.; Love, C.; Shalek, A.K. Seq-Well: A Sample-Efficient, Portable Picowell Platform for Massively Parallel Single-Cell RNA Sequencing. Methods Mol. Biol. 2019, 1979, 111–132.
- Habib, N.; Avraham-Davidi, I.; Basu, A.; Burks, T.; Shekhar, K.; Hofree, M.; Choudhury, S.R.; Aguet, F.; Gelfand, E.; Ardlie, K.; et al. Massively parallel single-nucleus RNA-seq with DroNc-seq. Nat. Methods 2017, 14, 955–958.
- Rosenberg, A.B.; Roco, C.M.; Muscat, R.A.; Kuchina, A.; Sample, P.; Yao, Z.; Graybuck, L.T.; Peeler, D.J.; Mukherjee, S.; Chen, W.; et al. Single-cell profiling of the developing mouse brain and spinal cord with split-pool barcoding. Science 2018, 360, 176–182.
- Salomon, R.; Kaczorowski, D.; Valdes-Mora, F.; Nordon, R.E.; Neild, A.; Farbehi, N.; Bartonicek, N.; Gallego-Ortega, D. Droplet-based single cell RNAseq tools: A practical guide. Lab Chip 2019, 19, 1706–1727.
- Bacher, R.; Kendziorski, C. Design and computational analysis of single-cell RNA-sequencing experiments. Genome Biol. 2016, 17, 63.
- Islam, S.; Zeisel, A.; Joost, S.; La Manno, G.; Zajac, P.; Kasper, M.; Lonnerberg, P.; Linnarsson, S. Quantitative single-cell RNA-seq with unique molecular identifiers. Nat. Methods 2014, 11, 163–166.
- Grun, D.; Kester, L.; van Oudenaarden, A. Validation of noise models for single-cell transcriptomics. Nat. Methods 2014, 11, 637–640.
- Chen, W.; Li, Y.; Easton, J.; Finkelstein, D.; Wu, G.; Chen, X. UMI-count modeling and differential expression analysis for single-cell RNA sequencing. Genome Biol. 2018, 19, 70.
- Vallejos, C.A.; Marioni, J.C.; Richardson, S. BASiCS: Bayesian Analysis of Single-Cell Sequencing Data. PLoS Comput. Biol. 2015, 11, e1004333.
- Katayama, S.; Tohonen, V.; Linnarsson, S.; Kere, J. SAMstrt: Statistical test for differential expression in single-cell transcriptome with spike-in normalization. Bioinformatics 2013, 29, 2943–2945.
- Ding, B.; Zheng, L.; Zhu, Y.; Li, N.; Jia, H.; Ai, R.; Wildberg, A.; Wang, W. Normalization and noise reduction for single cell RNA-seq experiments. Bioinformatics 2015, 31, 2225–2227.
- Tang, W.W.; Kobayashi, T.; Irie, N.; Dietmann, S.; Surani, M.A. Specification and epigenetic programming of the human germ line. Nat. Rev. Genet 2016, 17, 585–600.
- Gunesdogan, U.; Magnusdottir, E.; Surani, M.A. Primordial germ cell specification: A context-dependent cellular differentiation event [corrected]. Philos. Trans. R. Soc. Lond. B Biol. Sci. 2014, 369.
- Hajkova, P.; Ancelin, K.; Waldmann, T.; Lacoste, N.; Lange, U.C.; Cesari, F.; Lee, C.; Almouzni, G.; Schneider, R.; Surani, M.A. Chromatin dynamics during epigenetic reprogramming in the mouse germ line. Nature 2008, 452, 877–881.
- Seki, Y.; Hayashi, K.; Itoh, K.; Mizugaki, M.; Saitou, M.; Matsui, Y. Extensive and orderly reprogramming of genome-wide chromatin modifications associated with specification and early development of germ cells in mice. Dev. Biol. 2005, 278, 440–458.
- Seki, Y.; Yamaji, M.; Yabuta, Y.; Sano, M.; Shigeta, M.; Matsui, Y.; Saga, Y.; Tachibana, M.; Shinkai, Y.; Saitou, M. Cellular dynamics associated with the genome-wide epigenetic reprogramming in migrating primordial germ cells in mice. Development 2007, 134, 2627–2638.
- Hayashi, K.; Ogushi, S.; Kurimoto, K.; Shimamoto, S.; Ohta, H.; Saitou, M. Offspring from oocytes derived from in vitro primordial germ cell-like cells in mice. Science 2012, 338, 971–975.
- Hayashi, K.; Ohta, H.; Kurimoto, K.; Aramaki, S.; Saitou, M. Reconstitution of the mouse germ cell specification pathway in culture by pluripotent stem cells. Cell 2011, 146, 519–532.
- Kurimoto, K.; Yamaji, M.; Seki, Y.; Saitou, M. Specification of the germ cell lineage in mice: A process orchestrated by the PR-domain proteins, Blimp1 and Prdm14. Cell Cycle 2008, 7, 3514–3518.
- Magnusdottir, E.; Dietmann, S.; Murakami, K.; Gunesdogan, U.; Tang, F.; Bao, S.; Diamanti, E.; Lao, K.; Gottgens, B.; Azim Surani, M. A tripartite transcription factor network regulates primordial germ cell specification in mice. Nat. Cell Biol. 2013, 15, 905–915.
- Ohinata, Y.; Payer, B.; O’Carroll, D.; Ancelin, K.; Ono, Y.; Sano, M.; Barton, S.C.; Obukhanych, T.; Nussenzweig, M.; Tarakhovsky, A.; et al. Blimp1 is a critical determinant of the germ cell lineage in mice. Nature 2005, 436, 207–213.
- Weber, S.; Eckert, D.; Nettersheim, D.; Gillis, A.J.; Schafer, S.; Kuckenberg, P.; Ehlermann, J.; Werling, U.; Biermann, K.; Looijenga, L.H.; et al. Critical function of AP-2 gamma/TCFAP2C in mouse embryonic germ cell maintenance. Biol. Reprod. 2010, 82, 214–223.
- Kim, Y.; Capel, B. Balancing the bipotential gonad between alternative organ fates: A new perspective on an old problem. Dev. Dyn. 2006, 235, 2292–2300.
- Western, P.S.; Miles, D.C.; van den Bergen, J.A.; Burton, M.; Sinclair, A.H. Dynamic regulation of mitotic arrest in fetal male germ cells. Stem Cells 2008, 26, 339–347.
- Brinster, R.L. Germline stem cell transplantation and transgenesis. Science 2002, 296, 2174–2176.
- Mehlmann, L.M. Stops and starts in mammalian oocytes: Recent advances in understanding the regulation of meiotic arrest and oocyte maturation. Reproduction 2005, 130, 791–799.