Your browser does not fully support modern features. Please upgrade for a smoother experience.
Please note this is an old version of this entry, which may differ significantly from the current revision.
Subjects:
Engineering, Civil
|
Others
Cities are moving towards new mobility strategies to tackle smart cities’ challenges such as carbon emission reduction, urban transport multimodality and mitigation of pandemic hazards, emphasising on the implementation of shared modes, such as bike-sharing systems.
- bike-sharing systems
1. Introduction
Changes are taking place in the future development of the transport sector. To this aim, concrete plans are already in place, such as the Sustainable Development Goals (SDGs) [1], the New Urban Agenda [2] and the Organisation for Economic Co-operation and Development (OECD) Greening Transport [3], and adopted by United Nations member states since 2016.
To cope with these challenges, the New Urban Agenda and OECD Greening Transport set up the guidelines for a sustainable future that connects to the SDG11 Cities and Communities [4].
Bike-sharing systems (BSS) improve urban accessibility, multimodality in transportation and mobility sustainability, and more cities in the world are implementing such sharing modes to tackle increased expansion of urban mobility, air pollution and changes in urban mobility patterns and behaviour, trends exacerbated by the recent pandemic crisis.
Since 2016, more than 1000 bike-sharing systems are running in 60 countries [5], and many improvements have been made in bike-sharing systems. The latest systems allow real-time data collection using sensors and wireless communications, generating large quantities of data [6]. The collected data improve intelligent processes of data analytics through machine learning techniques.
2. Methodology
The systematic literature review was performed by adopting the preferred reporting items for systematic reviews and meta-analyses (PRISMA) methodology [7], based on the PRISMA statement that consists of a checklist and a flow diagram.
he process workflow consists of understanding all the stages of the study, as shown in Figure 1.
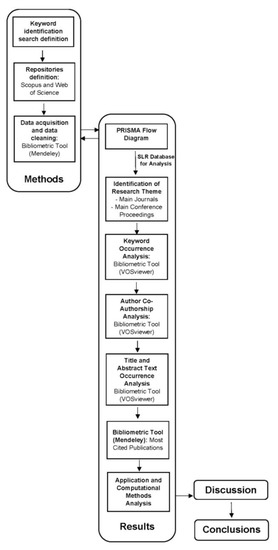
Figure 1. Process workflow.
3. PRISMA Flow Diagram
A PRISMA flow diagram illustrates our process of SLR data set creation for further quantitative and qualitative analyses (Figure 3). The initial step in this approach identified publications through a database search, resulting in a total of 162 publications (Scopus: 140; Web of Science: 22). The main inclusion criteria for such publications were original research papers written in English and published in peer-reviewed journals and relevant conference proceedings in said time period. Review papers, position papers and reports were excluded. Subsequently, we removed duplicates (e = 20). Then we performed abstract screening. Step 1 excluded articles without abstracts and out of the scope of the research (e = 128). Step 2 excluded articles not related to transport (e = 9), and step 3 eliminated from our survey papers not related to urban mobility (e = 5). Finally, the full texts of the remaining 35 papers were read, assessed and fitted on the scope of the research. As such, in the full-text-screening phase, all papers were considered and were eligible for systematic review. Therefore, this eligibility phase excluded none of such remaining papers. From these, 24 were published in scientific journals, whereas 11 were published in conference proceedings.
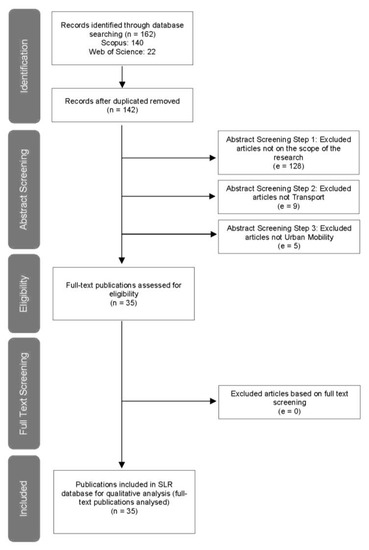
Figure 3. PRISMA flow diagram (n = retained; e = excluded).
4. Keyword Occurrence Analysis
Keyword occurrence analysis was performed using the mentioned bibliometric research tool for network analysis, VOSviewer. The analysis was performed using a full counting method, encompassing 44 screened keywords, with a minimum threshold of 1 occurrence. Of the total 44, only 35 keywords were selected for the purpose of the analysis (Table 3). Most of the analysed keywords were related to machine learning techniques applied to bike-sharing systems. The top five identified terms were big data (2 occurrences, 10 total link strength), bike-sharing (2 occurrences, 10 total link strength), deep learning (2 occurrences, 9 total link strength), long short-term memory networks (1 occurrence, 6 total link strength) and sharing mobility (1 occurrence, 6 total link strength), all aligned with the keyword search.
Table 3. Keyword occurrences ranked by link strength.

In keyword co-occurrence analysis, 8 clusters (Figure 4 and Figure 5) were identified with 35 items and 77 links. The biggest nodes of each cluster in the network were identified as bike-sharing systems (red), long short-term memory (cyan), machine learning (brown), clustering algorithm (yellow), big data (green), deep learning (orange), sharing mobility (purple) and bike-sharing (blue).
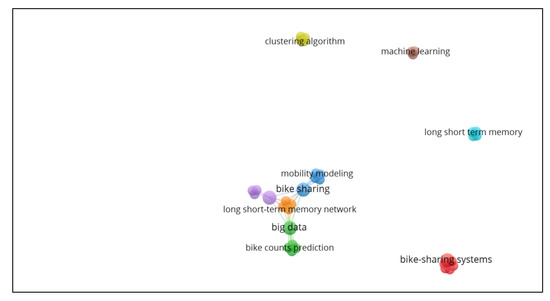
Figure 4. Keyword occurrence network visualisation.
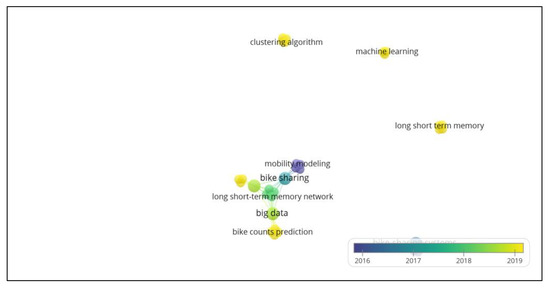
Figure 5. Keyword occurrence by year overlay visualisation.
The connections among the research themes identified by keyword co-occurrence are shown in Figure 4 and Figure 5. There is a large, interconnected network of keywords, as well as groups of keywords that occur together in individual articles, mostly in 2019. The keyword analysis showed fields of the research reinforcing the topics of machine learning and bike-sharing systems and identified machine learning techniques applied to bike-sharing systems, such as clustering algorithm and deep learning.
Looking closer at the interconnected network of Figure 6 (18 items, 4 clusters and 47 links), prediction algorithms, such as deep learning, convolutional long short-term and long short-term memory network, were identified regarding rebalancing, bike count prediction and flow prediction.
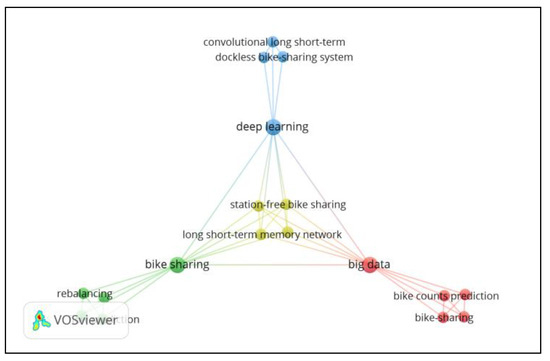
Figure 6. Keyword occurrence network visualisation (4 interconnected clusters).
Finally, machine learning techniques applied to bike-sharing systems were clearly defined in the SLR analysis, showing two main trends: clustering (classification) and prediction.
5. Author Co-Authorship Analysis
Author occurrence analysis was performed with the previously mentioned bibliometric research tool for network analysis, VOSviewer.
The analysis on authorship was performed using a full counting method, choosing the minimum threshold of 1, resulting in a total of 140 authors meeting the threshold, of which 35 authors were analysed (Figure 7).
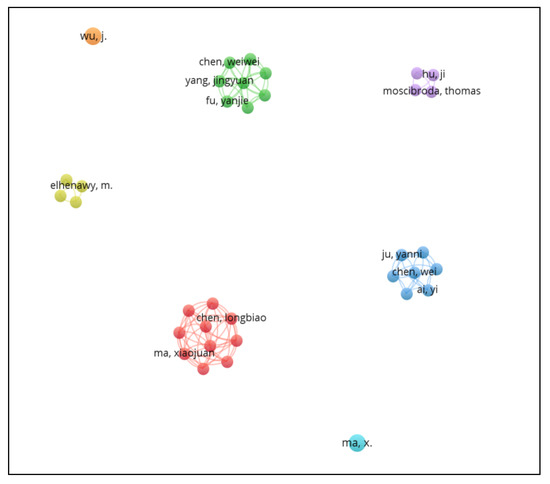
Figure 7. Author co-authorship analysis network visualisation.
The top 10 identified authors were Chen, L. [8], Jakubowicz, J. [8], Li, S. [8], Ma, X. [8], Nguyen, T. M. T. [8], Pang, G. [8], Wang, L. [8], Wu, Z. [8], Yang, D. [8] and Zhang, D. [8], all with a link strength of 9.
In author co-authorship analysis, 7 clusters were identified with 35 items and 106 links. Cluster 1 (red) corresponds to the top 10 author co-authorship ranked by link strength (Table 4), Cluster 2 (green) has 8 items identified (Chen, W. [9], Fu, Y. [9], Li, Q. [9], Liu, J. [9], Qu, M. [9], Xiong, H. [9], Yang, J. [9] and Zhong, H. [9]), Cluster 3 (blue) has seven items identified (Ai, Y. [10], Chen, W. [10], Gan, M. [10], Ju, Y. [10], Li, Z. [10], Yu, D. [10] and Zhang, Y. [10]), Cluster 4 (yellow) has four items identified (Elhenawy, M. [11], Ghanem, A. [11], House, L. [11] and Rakha, H. A. [11]), Cluster 5 (purple) has four items identified (Hu, J. [12], Moscibroda, T. [12], Shu, Y. [12] and Yang, Z. [12]), Cluster 6 (cyan) has one item (Ma, X. [13][14]) and Cluster 7 (orange) has one item, Wu, J [15][16].
Table 4. Author co-authorship ranked by link strength.
Cluster 3 and Cluster 7 correspond to authors who published articles in 2019. Cluster 4 corresponds to authors with publications in 2017 and 2018; as for the remaining authors, articles were published in 2016.
Figure 8 shows that the top 10 author co-authorship were published in 2016, showing that the academic community had strong ties in 2016.
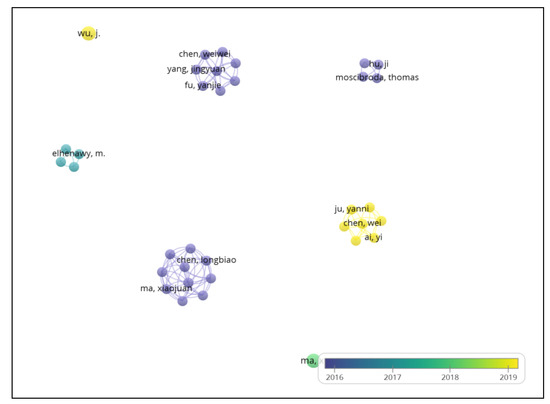
Figure 8. Author co-authorship analysis by year overlay visualisation.
The highest number of relevant articles were published from 2017 to 2019, showing that the academic community got broader with more researchers involved and more interested in machine learning techniques applied to bike-sharing systems, as shown in Section 3.5.
3.5. Title and Abstract Text Occurrence Analysis
This analysis (with VOSviewer) was performed on text data using a full counting method and included 749 screened items with a minimum threshold of 2 occurrences, resulting in 160 items. The relevance score was calculated for 40% of the sample as a standard reference for the calculation. The process result is shown in Table 5 for the 13 most relevant terms.
Table 5. Title and abstract text occurrences ranked by relevance.
The analysis computed a network with 64 items, 8 clusters, 310 links and a total link strength of 987 (Figure 9). The network highlighted an eight-cluster network, being the biggest nodes of each identified as gcnn ddgf model (orange), neural network (brown), lstm nns (cyan), random forest (yellow), approach(green), algorithm(red), prediction model (purple) and prediction(blue). The identified machine learning techniques were also coherent with the ones identified in the keyword analysis, namely deep learning, clustering algorithm and long short-term memory, also suggesting other techniques, such as graph convolutional neural networks with data-driven graph filter (GCNN-DDGF) and neural networks (RNN and CNN).
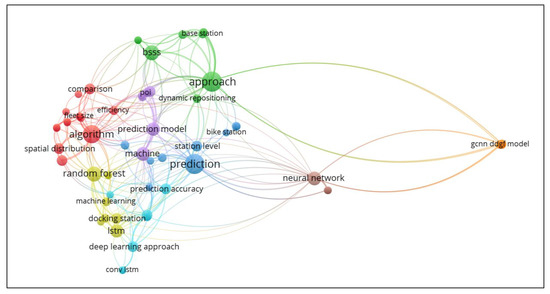
Figure 9. Title and abstract text occurrence network visualisation.
Figure 10 shows that neural network, a machine learning technique, is applied to bike-sharing systems studies in most of the articles published since 2016. A clear evolution is observed in the application of this machine learning technique [9][17][18][19][20][21] studied by authors till 2019.
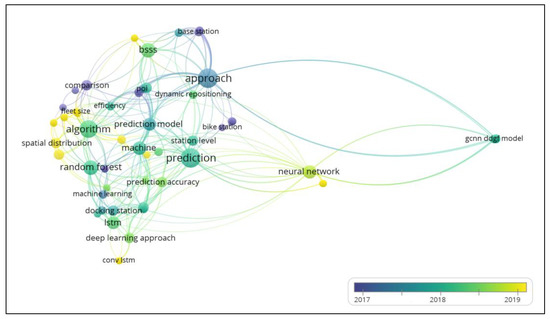
Figure 10. Title and abstract text occurrence by year overlay visualisation.
This entry is adapted from the peer-reviewed paper 10.3390/ijgi10020062
References
- Inter-Agency and Expert Group on Sustainable Development Goal Indicators, Report of the Inter-Agency and Expert Group on Sustainable Development Goal Indicators (E/CN.3/2016/2/Rev.1), Annex IV. 2016. Available online: (accessed on 7 June 2020).
- United Nations. Habitat III New Urban Agenda: Quito Declaration on Sustainable Cities and Human Settlements for All. Habitat III Conference, no. October 2016; p. 24. Available online: (accessed on 7 June 2020).
- OECD. Greening Household Behaviour; OECD: Paris, France, 2011.
- Klopp, J.M.; Petretta, D.L. The urban sustainable development goal: Indicators, complexity and the politics of measuring cities. Cities 2017, 63, 92–97.
- Meddin, R.; DeMaio, P.J. The Meddin Bike-Sharing World Map. Google Maps. 2020. Available online: (accessed on 3 October 2020).
- Chen, C.; Ma, J.; Susilo, Y.; Liu, Y.; Wang, M. The promises of big data and small data for travel behavior (aka human mobility) analysis. Transp. Res. Part C Emerg. Technol. 2016, 68, 285–299.
- Moher, D.; Liberati, A.; Tetzlaff, J.; Altman, D.G.; The PRISMA Group. Preferred reporting items for systematic reviews and meta-analyses: The PRISMA statement. PLoS Med. 2009, 6, e1000097.
- Chen, L.; Zhang, D.; Wang, L.; Yang, D.; Ma, X.; Li, S.; Wu, Z.; Pan, G.; Nguyen, T.-M.-T.; Jakubowicz, J. Dynamic Cluster-Based over-Demand Prediction in Bike Sharing Systems. In Proceedings of the 2016 ACM International Joint Conference on Pervasive and Ubiquitous Computing, Heidelberg, Germany, 12–16 September 2016; pp. 841–852.
- Liu, J.; Li, Q.; Qu, M.; Chen, W.; Yang, J.; Xiong, H.; Zhong, H.; Fu, Y. Station Site Optimization in Bike Sharing Systems. In Proceedings of the IEEE International Conference on Data Mining, ICDM, Atlantic City, NJ, USA, 14–17 November 2015; pp. 883–888.
- Ai, Y.; Li, Z.; Gan, M.; Zhang, Y.; Yu, D.; Chen, W.; Ju, Y. A deep learning approach on short-term spatiotemporal distribution forecasting of dockless bike-sharing system. Neural Comput. Appl. 2019, 31, 1665–1677.
- Ashqar, H.I.; Elhenawy, M.; Almannaa, M.H.; Ghanem, A.; Rakha, H.A.; House, L. Modeling Bike Availability in A Bike-Sharing System Using Machine Learning. In Proceedings of the 5th IEEE International Conference on Models and Technologies for Intelligent Transportation Systems, MT-ITS 2017, Naples, Italy, 26–28 June 2017; pp. 374–378.
- Yang, Z.; Hu, J.; Shu, Y.; Cheng, P.; Chen, J.; Moscibroda, T. Mobility Modeling and Prediction in Bike-Sharing Systems. In Proceedings of the 14th Annual International Conference on Mobile Systems, Applications, and Services—MobiSys ’16, Singapore, 26–30 June 2016; pp. 165–178.
- Liu, L.; Sun, L.; Chen, Y.; Ma, X. Optimizing fleet size and scheduling of feeder transit services considering the influence of bike-sharing systems. J. Clean. Prod. 2019, 236, 117550.
- Chen, L.; Ma, X.; Nguyen, T.M.T.; Pan, G.; Jakubowicz, J. Understanding bike trip patterns leveraging bike sharing system open data. Front. Comput. Sci. 2017, 11, 38–48.
- Duan, Y.; Wu, J. Optimizing Rebalance Scheme for Dock-Less Bike Sharing Systems with Adaptive User Incentive. In Proceedings of the IEEE International Conference on Mobile Data Management, Hong Kong, China, 10–13 June 2019; pp. 176–181.
- Jiang, J.; Lin, F.; Fan, J.; Lv, H.; Wu, J. A Destination Prediction Network Based on Spatiotemporal Data for Bike-Sharing. Complexity 2019, 2019.
- Wang, B.; Kim, I. Short-Term Prediction for Bike-Sharing Service Using Machine Learning. Transp. Res. Procedia 2018, 34, 171–178.
- Chen, P.-C.; Hsieh, H.-Y.; Sigalingging, X.K.; Chen, Y.-R.; Leu, J.-S. Prediction of Station Level Demand in a Bike Sharing System Using Recurrent Neural Networks. In Proceedings of the 2017 IEEE 85th Vehicular Technology Conference (VTC Spring), Sydney, Australia, 4–7 June 2017; pp. 1–5.
- Zhou, Y.; Huang, Y. Context Aware Flow Prediction of Bike Sharing Systems. In Proceedings of the 2018 IEEE International Conference on Big Data, Big Data 2018, Seattle, WA, USA, 10–13 December 2018; pp. 2393–2402.
- Pan, Y.; Zheng, R.C.; Zhang, J.; Yao, X. Predicting bike sharing demand using recurrent neural networks. Procedia Comput. Sci. 2019, 147, 562–566.
- Liu, X.; Gherbi, A.; Li, W.; Cheriet, M. Multi features and multi-time steps LSTM based methodology for bike sharing availability prediction. Procedia Comput. Sci. 2019, 155, 394–401.
This entry is offline, you can click here to edit this entry!