Major milestones in the design of near infrared spectrometers as well as their demonstrated efficiency in the mitigation of food security issues with regards to commonly consumed food matrices are herein presented.
- food authenticity
- food adulteration
- chemometrics
- fingerprinting
- NIR spectroscopy
1. Introduction
Herschel’s discovery of the near infrared energy back in 1800 marked the beginning of a novel era of experimentation, without which, elucidating basic phenomena would not be possible [1]. This conceptual knowledge later translated into industrial applications that were first initiated by Karl Norris in agriculture-related applications. In his pioneering study, near infrared (NIR) spectroscopy enabled the analysis of agricultural commodities, namely by determining the protein content of wheat [2].
Covering the range 780–2500 nm of the electromagnetic (EM) spectrum, NIR spectroscopy captures samples’ spectra in reflection, interactance, and transmission modes, thus providing rich information regarding the vibration of their elemental molecular bonds [3]. Upon interacting with the EM radiation, the captured spectra comprise both overtones and combination bands involving mainly hydrogen-bonded functional groups (–CH, –NH, –OH –SH). Such broad bands are highly informative and demand chemometric tools to disclose the correlation between spectral information and the structural features of the samples [4].
A possible historical overview of the evolution of near infrared spectrometers with the main milestones is illustrated in Figure 2.
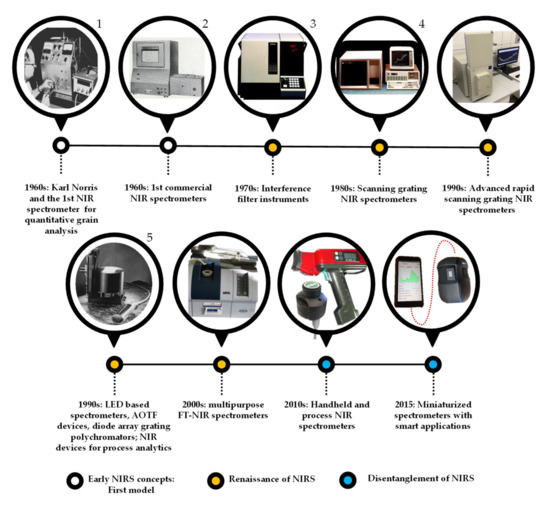
Figure 2. Overview of the evolution of near infrared spectrometers. Reproduced with permission from K H Norris [2] published by Journal of Near Infrared Spectroscopy (2020)1, K H Norris (2008)2,3 Technicon Instruments Corporation [5] published by Analytical Chemistry (2020)4, and J Malinen [6] published by Sensors and Actuators B (2020)5. The rest of the figures are self-developed based on authors’ own pictures.
The first scanning spectrometers that employed NIR light were equipped with prism-grating monochromators, covering the UV-VIS-NIR range from 185 to 870 nm. Though, for many years during the renaissance of NIR spectroscopy, interference filter instruments were the most used. Still, in the late 1990s, 85% of instruments used for routine monitoring were estimated to be filter instruments [7]. The great advancements of the 1990s in electronics, including detectors and computer technology, resulted in the rise of the rapid scanning grating monochromators, which became the ultimate choice for both research and applications.
As a result of the upsurge of Raman spectroscopy, the development of FT-NIR (Fourier transform NIR) instrumentation came about in the 1990s [7]. First, traditional mid-IR spectroscopic companies provided conversions of their classical mid-IR instruments, but later launched the production of NIR dedicated FT instruments. These developments met a silent but significant market need coming from analytical chemists who were more familiar with FT-IR instrumentation used in the analytical IR, thus, were more apt to open to the new field of NIR spectroscopy—combined with often demonized multivariate data analysis—when at least the instrumentation was known. In the early 2000s, the agri-food sector was dominated by benchtop grating spectrometers, while FT-NIR spectrometers started to spread in pharmaceutical applications, where their narrow bandpass meant an advantage, even with the compromise of a lower signal-to-noise ratio. After several market changes and instrument developments, the above-mentioned barriers are rarely present, and both types of devices can be found in both fields, agri-food or pharma.
Regarding the detectors, silicon (Si) is still widely used for short-wave NIR (780–1100 nm), and lead sulphide (PbS) has been changed to indium gallium arsenide (InGaAs) that is less sensitive to temperature when used in the 800–1700 nm range, allowing cost-effective applications. The addition of optical fibers to the spectrometers allows collecting spectral information among conditions that are ineligible for highly precise and sensitive instruments.
The versatility in the design of NIR spectrometers has been further extended through gradual improvements aimed at enhancing the functionality of NIR spectroscopy resulting in a plethora of instruments [8]. The most recent and most significant achievement of NIR spectroscopy was the miniaturization, which undoubtedly resulted in the disentanglement of the technology [9]. The palm-sized or even smaller devices, containing e.g., linear variable filter with photodiode detector array, acousto-optic tunable filter, or micro-electro-mechanical systems with single photodiode detector, combined with advanced data transfer technologies, have opened new fields for applications, both in terms of handheld end-user devices and process analytical tools [10]. It became quite normal to be able to purchase a NIR scanner for personal use, and it is common to include a NIR device in an industrial process where quality has to be monitored or optimized. We are now in the era of ex-laboratory applications of NIR spectroscopy.
Multivariate data analysis of NIR spectroscopy has also undergone huge developments [11], sometimes in combination with the hardware. Karl Norris used scanning devices at USDA that allowed the spectroscopic inspection of the spectral data, instead of the purely statistical approaches that could be used by those having access to filter devices measuring at some discrete wavelengths. Having this advantage, Norris developed his derivative calculation method for data treatment in combination with a parsimonious interactive multiple regression based on sums and ratios of different wavelength channels. This was, particularly, to decrease additive and multiplicative effects caused by light scattering and path length variations [12]. Since derivative was not applicable for discrete spectral values of an instrument having 19 fixed wavelength filters, Harald Martens had to develop another correction method to overcome the burden of light scattering [13]. This is why nowadays we can use multiplicative scatter correction (MSC) in our calculations [14]. The regression methods started from multiple linear regression, when some discrete values were applied, and later, when scanning spectrometers generated a large amount of data, data reduction techniques became necessary. Principal component analysis turned to be the ultimate method to describe multidimensional variation and patterns, and to reduce the number of variables [15]. The most used quantitative linear calibration method is the partial least squares (PLS) regression [16]. With the decreased limitations in scanning speed, it became easy to collect thousands of spectra and create a large training database, which allows using other methods such as artificial neural network (ANN) or support vector machine (SVM). The SVM may be a better option when working with high dimensions but is very sensitive to outliers and noisy data and sometimes underperforms when large datasets are involved [17]. ANN has also been acknowledged for the ability to deliver an output even when incomplete information was used during training.
Just as on the side of spectrometers, users now have a vast variety of software and multivariate data analytical tools, starting from spectral pretreatments, through simplified data analysis, to detailed chemometrics when spectral information is translated to real analytical information. Push-button applications where an end-user can get feedback easily and rapidly are also continuing to evolve. With the progress in spectroscopic and IT hardware, tiny devices can do the scanning and hidden computers can deliver the results in any form within a blink of an eye. The only question remains: is that result good enough? Care must be exercised because in many cases little spectroscopic and sample handling knowledge is still necessary to avoid false assumptions. Nonetheless, the analytical advantages of NIR spectroscopy have been widely explored in the food industry.
2. Dairy Products
In inspecting the quality of dairy products, NIR spectroscopy was used in a wide spectrum of analysis. Research efforts were centered around monitoring the production of feta and Grana Padano cheeses and showed that using a discrete filter-based NIR analyzer, NIR could give a precise and direct representation of both production processes [18][19]. In another study, a scanning monochromator (SMC) with a fiber-optic probe was used to classify cheeses from different milk mixtures of cow, ewe, and goat milk, and their ripening time. When using the scores of the PCA for the artificial neural network model, a 100% accuracy was obtained for the classification of the ripening of the cheese samples. The classification according to the milk mixtures, however, was not as efficient with only 50% accuracy [20].
NIR light backscatter using a fiber optic sensor was also applied to monitor the incubation of the yoghurt. The results of the study highlighted the correlation between the changes of the spectra and pH of the samples (R2 > 0.99), indicating the adequacy of NIR as an alternative tool to pH meters during yoghurt incubation [21].
Application of NIR spectroscopy for detecting adulteration of different dairy products is also an immensely studied field. A study by Kamboj et al. [22] deployed an SMC spectrometer in the wavelength range of 700–2500 in reflectance mode to quantify added water in milk. Their results showed R2 values higher than 0.9 for the prediction of adulteration level.
Another reported application consisted of analyzing grated cheese adulterated with microcellulose, silicon-dioxide, wheat flour, wheat semolina, and sawdust using FT-IR with NIR module. The results showed that NIR was able to discriminate adulterated samples from nonadulterated ones with a classification accuracy of the PLS-DA models that is higher than 90% [23].
3. Sweeteners Including Honey
Authenticating organic sugars from those originating from other conventional sources is another major field of application of NIR spectroscopy.
Bázár et al. applied a benchtop NIR spectrometer with SMC, coupled to aquaphotomics for the classification and prediction of sugars in low concentration glucose, fructose, and lactose solutions obtaining R2 in the range of 0.7–0.99 depending on the wavelength range and sugar type [24].
Tahir et al. used the fusion of NIR and Raman-spectroscopy for the prediction of p-hydroxybenzoic acid (PHBA) content of honey and found strong correlation between the fused data and the PHBS content [25].
A handheld spectrometer with linear variable filter was used in diffuse reflectance mode in the wavelength range of 900–1650 nm, for the discrimination of crystal, demerara, and brown sugars with PLS-DA resulting in R2 < 0.99 [26].
Hungarian researchers analyzed linden, acacia, chestnut, and multifloral honeys and their mixtures using a benchtop NIR spectrometer and found average recognition and prediction abilities of 95.95% and 92.61%, respectively, using LDA for the botanical origin classification. For the geographical origin identification, 99.13% and 95.65% LDA accuracies were found [27].
Italian researchers also analyzed honey samples and built models using NIR-Flex 500 spectrometer and Raman spectroscopy for the botanical origin identification and revealed an accuracy amounting to 79% in the case of the NIR measurement [28].
An FT-NIR spectrophotometer was applied for the detection of adulteration in honey using glucose/fructose solutions and revealed the efficiency of NIR in the differentiation of authentic and adulterated samples with 95% recognition accuracy [29].
Bázár et al. [30] analyzed honey adulteration with HFCS syrups using benchtop SMC spectrometer and the aquaphotomics aspect of NIR and revealed the changes in the honey water structure as an effect of syrup addition. In this regard, the addition of syrup resulted in higher absorbance in the range of less H-bonded water (1320–1420 nm).
Similar results were obtained in another study using rice syrup as an adulterant of linden honey using benchtop double beam SMC instrument [31].
In a study of honey adulteration, authentic samples counterfeited with rice, beet, and corn, maltose, and high-fructose corn syrup and sucrose syrup in the range of 10–60% were analyzed with a SMC spectrometer and rapid content analyzer module for reflectance measurements, and with an ATR-FTIR spectrometer. The fusion of the two methods provided better accuracies (>90%) than those obtained using the two methods separately [32].
Benchtop SMC NIR spectrometer was also proven efficient when other adulterants comprising rice, brown cane, invert sugar, and fructose syrup in a concentration range of 5–40% were artificially added to honey and subjected to spectroscopic analysis. This study revealed correct classification of the samples with R2 values higher than 0.98 for the prediction of the syrup concentration [33].
Italian researchers applied a low level of heat treatment (39 °C for 30 min) and overheating (55 °C for 24 h) on three types of honey. After recording their NIR spectra using a benchtop SMC instrument, the results showed distinctive characteristics of the three types of honey in terms of their respective spectral pattern, however, the low level heat treatment did not affect the spectra of the samples [34].
Similar results were obtained in other studies using handheld instruments in the spectral range of 900–1700, where heat treatment of the samples (especially above 50 °C) affected the spectra of the samples and contributed to the determination of this rather widely spread kind of fraud [35][36].
4. Beverages
Beverages cover a very wide range of drinks providing a huge potential for the applications of NIR spectroscopy in the characterization of their quality from the most various aspects.
4.1. Coffee
From determining coffee origin to evaluating the quality attributes, resorting to NIR spectroscopy has been extensively reported in the literature. Marquetti et al. [37], for instance, deployed a benchtop NIR spectrometer and recorded the spectra of coffee samples to assess their genotypic and geographical origin. After multiplicative scatter correction and 2nd derivative, the results of the PLS-DA enabled the correct discrimination of the geographical origin of the samples with 94.4% accuracy. In another study, diffuse reflectance spectra of different green coffee samples were analyzed using a benchtop NIR instrument and helped to predict the sensory properties (acidity, bitterness, flavor, cleanliness, body, and overall quality) of the samples with R2 coefficients exceeding 0.84 [38]. Other studies were aimed at screening the characteristics of coffee such as measuring the color and Arabica content using FT-NIR spectroscopy with R2 > 0.9 [39][40] as well as classifying Robusta and Arabica coffee samples according to the quality of the cup with the help of ATR-FTIR instrument. What these results have shown is that NIR spectroscopy could be used efficiently for the quality control of coffee.
4.2. Tea
Instant green teas were analyzed using benchtop and portable NIR devices, the results showed that these instruments could be used to determine the main quality components of tea. The results comparing the benchtop and portable device showed, in the case of the prediction of total catechin, that the portable device provided higher R2 values and lower prediction error, while in the case of the caffeine better results were obtained using the benchtop instrument [41]. Matcha tea, another trending product, was also analyzed with portable NIR instruments and satisfactory results were obtained for the estimation of the polyphenol and amino acid content of the tea samples after choosing the most accurate pretreatment methods. The best results consisted of R2 of 0.86 for the prediction of polyphenols and 0.96 for the determination of amino acids [42].
4.3. Fruit juices
Citric and tartaric acids were assessed and predicted with good precision (R2 > 0.98) and low errors (RMSECV < 0.62) when a handheld SMC spectrometer in reflectance mode was used [43]. This substantiates the importance of NIR spectroscopy for rapid monitoring of additives and preservatives in fruit juices when either transmittance, reflectance, or diffuse-reflectance mode is used. In combination with standard analytical techniques, both a benchtop and handheld SMC NIR in reflectance mode could discriminate different varieties of green and orange fleshed melons with 100% classification accuracy in LDA and predict multiple sensory parameters in PLS regression with high precision (R2 up to 0.96) and low errors (RMSECV as low as 0.24 g/mL) after cross-validation [44]. Transmittance mode benchtop FT-NIR provided high R2 in cross-validation (up to 0.94) and low errors (RMSECV as low as 5.07 mg nitrogen/L) when it was used to measure total yeast assimilable nitrogen, free amino nitrogen, and ammonia in 900 grape juice samples from 28 cultivars over three seasons [45]. This suggests that NIR can provide juice makers with the opportunity to make timelier and more informed nutrient supplementation decisions to achieve the desired juice style or quality.
4.4. Soft drinks
Glucose, fructose, and sucrose contents of commercial soft drinks could also be rapidly predicted with precision (R2CV) higher than 0.91 and errors lower than 1.0 g/mL [46] when reflectance spectra from a benchtop SMC spectrometer were analyzed. This suggests a rapid approach for sugar content determination in soft drinks.
Reflectance NIR spectra from a handheld SMC instrument were used to fingerprint soluble solids contents of tea soft drink with a cross-validation R2 as high as 0.98 [47].
Furthermore, NIR proved to be a viable option in monitoring caffeine levels in soft drinks when more than 100 soft drinks were accurately classified and predicted with a benchtop FT-NIR spectrometer in transmission mode [48].
Ascorbic acid content of powdered soft drinks was determined and predicted with high accuracies after reflectance measurement with a benchtop FT-NIR [49]. This is particularly important because powdered soft drinks are often fortified with antioxidants such as ascorbic acid and, therefore, normally controlled by titration or chromatographic methods which can be both expensive and time-consuming.
4.5. Mineral water
Three types of commercial mineral water, ultra-pure water, and deionized water were successfully discriminated with a benchtop SMC spectrometer in transflectance mode. It was revealed that the original spectra of water were more suitable than the second derivative spectra in discriminating the different waters with more 95% variance in PCA [50]. This emphasizes the importance of NIR spectra pretreatment techniques in optimizing results.
Aquaphotomics operates on the principle of using water as a holistic marker to extract information about many different water molecular conformations and their interaction with surrounding solutes through their absorbance bands and a light–water phenomenon [51]. Using NIR spectroscopy in combination with the aquaphotomics approach, seven commercial mineral waters and tap water were discriminated based on spectra variations using a mini SMC spectrometer in transmission mode [52].
This approach has been used in other studies regarding water such as the monitoring of water quality where aqueous solutions of acetic acid, lactose, and sodium chloride could be characterized by specific wavebands [53], using a benchtop SMC spectrometer.
5. Meat
NIR spectroscopy has unlimited potential for meat quality assessment because of its noninvasive analytical advantages.
Among many others it has been shown that NIR spectroscopy can rapidly detect freshness associated compounds in oxen [54], total viable count in pork [55][56], and bos grunniens meat [57].
Using a benchtop SMC spectrometer protein and intramolecular fat content of rabbit hind meat was determined with an R2 of 0.89 and 0.85, respectively, for fresh samples. Freeze-dried samples showed better accuracies with R2 of 0.99 (for fat) and 0.95 (for protein) [58].
A benchtop SMC spectrometer was used to predict meat chemical and fatty acid (FA) composition from 63 steers fed with sunflower or flaxseed in combination with high forage diets. Crude protein, moisture, fat content, saturated, monounsaturated, and branched FA and conjugated linoleic acid content were predicted with high precision (R2 as high as 0.97) and accuracy (RMSEC lower than 0.98 mg/g) [59]. These findings show the suitability of NIR spectroscopy for screening meat and meat-based products based on the content of beneficial FAs to human health.
Good calibrations were built for the total lipid content of beef resulting an R2 of 0.95 and SECV of 0.25 in cross-validation, when a SMC benchtop spectrometer was used [60].
For quality parameters determination purposes, NIR spectroscopy could predict sodium content in commercially processed meat [61] and in vacuum dried ham slices [62]. Other parameters such as ash and dry matter in freeze-dried ostrich meat were also studied [63].
Drip loss, color, and pH of 131 commercial pork loins were also predicted with high accuracies when NIR spectroscopy was used by Kapper et al. [64]. Similar studies also reported a good classification accuracy for pork tenderness (72%) and juiciness (73%) when a spectrometer with a bifurcated optical cable that resulted in a single reading from 400 to 1395 nm was used [65].
Portable NIR spectrometers have been used for cost-saving but also for reliable monitoring of ham [62], beef [70][71], and routine analysis of Iberian pork [72]. Monounsaturated fatty acids, oleic acid, and saturated fatty acids could be predicted in wagyu beef carcass with R2 of 0.79, 0.71, 0.81, respectively, when a handheld fiber optic spectrometer was used [72].
6. Fish
Although there are not many studies about NIR spectroscopy applications in fish, the noninvasive advantages of NIR spectroscopy have been explored by some researchers for fish quality and the number of publications has increased in this field as well.
It is often difficult to differentiate between fresh and frozen/thawed fillets because fillets frozen below −60 °C do not show visual characteristics changes when thawed. In this regard, the classification of fresh and frozen fillet performed with a benchtop SMC spectrometer resulted in a high classification accuracy of 92% [73]. The outcome of this study is essential because fresh tuna is more expensive than thawed tuna, and it is important to prevent certain cases where frozen/thawed products are sold as fresh to deceive the consumer.
The pH, total volatile basic nitrogen (TVB-N), thiobarbituric acid reactive substances (TBARS), and ATP-related compounds (K value) of the bighead carp (Aristichthys nobilis) were predicted with high precision (R2 higher the 0.81) and low errors (RMSEP as low as 0.081) when a benchtop FT-NIR was used [74]. The study provides an alternative rapid approach for the determination of fish freshness.
For the analysis of sensory qualities, six textural properties (water holding capacity, hardness, resilience, springiness, chewiness, and shear force) of the silver carp fish (Hypophthalmichthys molitrix) were determined with NIR spectroscopy and predicted with high R2 (greater than 0.86 for all the parameters) and low error (RMSEP as low as 0.10) [74]. The determined sensory qualities are relevant in making consumer choices for fish consumption.
Another way of deceiving the consumer is done through the substitution of fish species. This was also investigated when a benchtop FT-NIR instrument was used for the authentication of Atlantic mullet and flounder fish fillets species with a 100% classification yield [75].
Handheld NIR devices have also successfully been used to distinguish fillets and patties of Atlantic cod with 100% correct classification in LDA [76].
7. Fats and Oils
Many varieties of vegetable oils, peanut oil, bean oil, rapeseed oil, sesame oil, oil-tea camellia seed oil, and olive oil, were investigated in the temperature range of 50–160 °C with two-dimensional correlation near-infrared spectroscopy (2D-NIR). In the 1666–1818 nm wavelength region, due to the elevating temperature, clear differences were observable in the 2D-NIR spectroscopy map. Thereby, the different oils could be distinguished directly by auto peaks and cross peaks [77].
Several other studies dealt with the detection of adulteration in diesel/biodiesel blends with vegetable oil. Back in 2015, one study using ultra-compact and FT-NIR spectrometers found that multiple linear regression (MLR) combined with successive projections algorithm (SPA) was the best modelling strategy. RMSEP values were 0.34% and 0.22%, and the limits of detection values (LOD) were 0.40% and 0.34%, for the ultra-compact and FT-NIR, respectively [78].
Casale and Simonetti (2014) comprehensively summarized the most important findings about NIR spectroscopy in the evaluation of olive oils. According to the review, NIR studies are primarily applied for adulteration detection, geographical origin prediction, quality parameter determination (including oxidative stability), and online process monitoring [79]. In a 2004 study, transmittance spectra of olive oil mixtures were analyzed in the 833–2500 nm range using a FT-NIR spectrometer to classify and quantify various adulterants. After multiplicative scatter correction (MSC), Savitzky–Golay smoothing, and mean normalization, the PLS models predicted corn, sunflower, soya, walnut, and hazelnut oil adulteration with R2 higher than 0.99 and error limits between ±0.57 and ±1.32% w/w. Additionally, the developed PCA models classified an unknown sample with an accuracy of nearly 100% [80].
Another study on olive oil counterfeiting, applying FT-NIR in the 1000–2500 nm range, revealed that the standard error of predictions ranged between 2.49 and 2.88% V/V for the olive-sunflower oil binary mixture, and 1.42–6.38% V/V for the ternary mixtures of olive–sunflower–corn oil. The R2 values of models estimating olive oil content were typically more than 0.99 [81].
To ensure the quality of fried foods, it is important to know how frying time and temperature affect physicochemical properties of the oils. Szabó et al. [82] measured conventional fat quality indices during prolonged heating of lard, and performed NIR-based calibrations using transflectance spectra recorded with a SMC spectrometer. Based on the cross-validation results, NIR spectroscopy was shown to be a rapid, solvent-free alternative for the estimation of acid value (AV) (R2 = 0.79) and p-anisidine value (pAV) (R2 = 0.77). In another study, Szabó et al. [83] introduced NIR spectroscopy models for predicting the deterioration level of four frying fats, such as rapeseed oil, sunflower oil, lard, and goose fat. Cross-validation precision for the amount of heat treatment (heating hours × temperature) exceeded 0.9, while calibrations for AV, PV, pAV, and total polar material (TPM) reached R2 over 0.8. Szabó et al. [84] combined NIR spectroscopy with a highly effective data reduction method, the polar qualification system, and developed models for identifying frying fat types, and for monitoring the quality changes of frying fats during long term usage. A Turkish study aimed to predict free fatty acid (FFA), TPM, viscosity, and smoke point of frying oils (refined hazelnut and peanut oils) by an FT-NIR spectrometer (780–2500 nm) and PLS regression after 5–35 h of dough frying. The results showed good correlation with the reference data. The r values of the standard quality parameters in the above listed order were 92.58, 94.61, 81.95, and 84.07, and the RMSEP values were 0.121, 3.96, 22.30, and 8.74, respectively (Öğütcü et al. 2012). Similar research was conducted on olive, sunflower, corn, and seeds oil after several hours of heating with and without foodstuff. In the measurements, a multipurpose analyzer FT-NIR spectrometer was utilized and the transmission spectra were recorded in the 666–2631 nm spectral range. Using a global model built on the spectra of all types of oils, the prediction of polymerized triglyceride content (PTG) was made with 2.28% w/w error [85].
Studies on canola oil have also shown that prolonged frying can be accurately identified with FT-NIR technique in the 1000–2500 nm wavelength range. The research used acid, peroxide, and carbonyl values as reference, then K-means, PAM, and hierarchical cluster analysis were performed to classify samples into harmful and less harmful categories [86].
Together, the above summarized studies corroborate the suitability of NIR spectroscopy in determining fat and oil authenticity by measuring quality parameters with high accuracy.
Furthermore, NIR spectroscopy proved to be an effective method for determining the level of degradation in frying oils.
8. Fruits and Vegetables
According to the summary of Cattaneo and Stellari (2019), among horticultural products, apples are most often tested with NIR spectroscopy [87]. Certain apple varieties are prone to internal diffuse browning. To detect this defect, beside some destructive methods, visible-shortwave NIR spectroscopy was used with different optical geometries. In the analysis, a handheld device using interactance mode (302–1150 nm), an “in-house” instrument employing partial transmission (302–1150 nm), and full transmission (600–973 nm) were used. The best results were obtained with the transmission arrangement, where R2 and RMSEP values of 0.83 and 0.63, were achieved, respectively, when predicting the defect score on a 5-point scale. Among the classification methods (PLS-DA, LDA, MD, SVM, SIMCA, MLoR), the best separation of acceptable fruits was determined with PLS-DA, classification accuracy higher than 95% and false discovery rate less than 2% were attained [88]. The FT-NIR spectroscopy in diffuse reflectance mode (1000–2500 nm range) proved to be successful when “Golden Delicious” apples from different altitudes and various apple cultivars were classified with PCA and quadratic discriminant analysis (QDA). Independent model validation resulted in a correct classifications rate of 87.5% and 86.3% for orchard elevation and for cultivar, respectively [89]. Other researchers also used the aforementioned methodology aiming to evaluate the long-term performance of calibration model for SSC prediction using the slope/bias (S/B) correction method on “Fuji” apples harvested between 2012 and 2018. The PLS model validations with five independent sets were realized in the 0.501–0.654% RMSEP range. The 15 selected wavelengths coupled with S/B correction could replace the whole analyzed spectra [90].
To investigate the feasibility of NIR spectroscopy in vegetable authentication, outdoor and greenhouse-grown bell peppers of different ripeness (green, red, yellow) were collected and analyzed in the 1600–2400 nm spectral range using a handheld microelectromechanical system-based device (reflectance mode) coupled with PLS-DA. The predictive models accurately discriminated the samples based on the cultivation conditions, where 89.73% and 88% correct classifications were obtained when unbalanced and balanced sets were used for model building. Classification accuracy between 88.28% and 91.37% was achieved when grouping was done according to ripeness. The dry matter and SSC predictions were realized with R2 values of 0.62, 0.63 and SECV between 0.66% and 0.75%, respectively [91]. A study by the same authors confirmed that NIR spectroscopy in static measuring position allows assessing some quality traits of freshly harvested Lamuyo peppers, such as color index (a*/b*), dry matter, SSC, and TA. The regression coefficients indicated 980 (water absorption), 1170–1360 nm (2nd overtone of C-H stretching) wavelengths important for parameter prediction [92].
Sweet corn is one of the most processed vegetables, the consumer acceptance of which is mostly determined by its sweet taste, which is given by the sugar content and composition. The soluble solid content of intact super sweet corn kernels was predicted using a SMC NIR reflectance analyzer in the 860–2500 nm range and synergy interval PLS (SI-PLS) after the best spectral pretreatment was selected. The best prediction was obtained when the 1349−1513, 1842−2005, 2005−2168, and 2337−2500 nm wavelength ranges were applied. To improve the predictive accuracy, the authors performed (CARS)-Si-PLS, hence the RMSEP amounted to 5.8292 mg/g and the correlation coefficient of the prediction set was equal to 0.8431 [93].
The NIR spectroscopy is widely and effectively used for testing horticultural products, both for quality property determination and authentication purposes. The estimation accuracy of the individual characteristics depends largely on what we would like to evaluate. The success of the investigation is dictated by the subject of the analysis, e.g., what physical properties a component has, in other words, what optical behavior or what sort of absorption it has in the NIR range.
This entry is adapted from the peer-reviewed paper 10.3390/s20195479
References
- Davies, A.M.C. William Herschel and the discovery of near infrared energy. NIR News 2000, 11, 3–5.
- Norris, K.H. History of NIR. J. Near Infrared Spectrosc. 1996, 4, 31–37.
- Qu, J.; Liu, D.; Cheng, J.; Pu, H.; Zeng, X.A. Applications of Near-infrared Spectroscopy in Food Safety Evaluation and Control: A Review of Recent Research Advances. Crit. Rev. Food Sci. Nutr. 2015, 55, 1939–1954.
- Ciurczak, E.W. Principles of Near-Infrared Spectroscopy. In Handbook of Near-Infrared Analysis, 2nd ed.; Burns, D.A., Ciurczak, E.W., Eds.; Marcel Dekker: New York, NY, USA; Basel, Switzerland, 2001.
- Technicon Instruments Corporation. Anal. Chem. 1987, 59, 226A–227A.
- Malinen, J.; Känsäkoski, M.; Rikola, R.; Eddison, C.G. LED-based NIR spectrometer module for hand-held and process analyser applications. Sens. Actuators B Chem. 1998, 51, 220–226.
- Williams, P.; Norris, K. Near-Infrared Technology in the Agricultural and Food Industries; American Association of Cereal Chemists: St. Paul, MN, USA, 1987; ISBN 091325049X.
- Beć, K.B.; Huck, C.W. Breakthrough potential in near-infrared spectroscopy: Spectra simulation. A review of recent developments. Front. Chem. 2019, 7, 48.
- Crocombe, R.A. Portable Spectroscopy. Appl. Spectrosc. 2018, 72, 1701–1751.
- Beć, K.B.; Grabska, J.; Siesler, H.W.; Huck, C.W. Handheld near-infrared spectrometers: Where are we heading? NIR News 2020, 31, 28–35.
- Naes, T.; Isakson, T.; Fearn, T.; Davies, T.; Publications, N.I.R. A user-friendly guide to multivariate calibration and classification. J. Chemom. 2002, 17, 571–572.
- Norris, K.H. Understanding and Correcting the Factors Which Affect Diffuse Transmittance Spectra. NIR News 2001, 12, 6–9.
- Martens, H.; Jensen, S.Å.; Geladi, P. Multivariate Linearity Transformation for Near-Infrared Reflectance Spectrometry. In Nordic Symposium on Applied Statistics; Christie, O.H.J., Ed.; Stokkand Forlag: Stavanger, Norway, 1983; pp. 208–232.
- Martens, H.; Stark, E. Extended multiplicative signal correction and spectral interference subtraction: New preprocessing methods for near infrared spectroscopy. J. Pharm. Biomed. Anal. 1991, 9, 625–635.
- Cowe, I.A.; McNicol, J.W. The Use of Principal Components in the Analysis of Near-Infrared Spectra. Appl. Spectrosc. 1985, 39, 257–266.
- Geladi, P.; Kowalski, B.R. Partial least-squares regression: A tutorial. Anal. Chim. Acta 1986, 185, 1–17.
- Granato, D.; Putnik, P.; Kovačević, D.B.; Santos, J.S.; Calado, V.; Rocha, R.S.; Da Cruz, A.G.; Jarvis, B.; Rodionova, O.Y.; Pomerantsev, A. Trends in Chemometrics: Food Authentication, Microbiology, and Effects of Processing. Compr. Rev. Food Sci. Food Saf. 2018, 17, 663–677.
- Adamopoulos, K.G.; Goula, A.M.; Petropakis, H.J. Quality control during processing of feta cheese—NIR application. J. Food Compos. Anal. 2001, 14, 431–440.
- Marinoni, L.; Stroppa, A.; Barzaghi, S.; Cremonesi, K.; Pricca, N.; Meucci, A.; Pedrolini, G.; Galli, A.; Cabassi, G. On site monitoring of Grana Padano cheese production using portable spectrometers. In Proceedings of the 18th International Conference on Near Infrared Spectroscopy, Copenhagen, Denmark, 11–15 June 2017; pp. 85–90.
- Soto-Barajas, M.C.; González-Martín, M.I.; Salvador-Esteban, J.; Hernández-Hierro, J.M.; Moreno-Rodilla, V.; Vivar-Quintana, A.M.; Revilla, I.; Ortega, I.L.; Morón-Sancho, R.; Curto-Diego, B. Prediction of the type of milk and degree of ripening in cheeses by means of artificial neural networks with data concerning fatty acids and near infrared spectroscopy. Talanta 2013, 116, 50–55.
- Arango, O.; Trujillo, A.J.; Castillo, M. Inline control of yoghurt fermentation process using a near infrared light backscatter sensor. J. Food Eng. 2020, 277, 1–6.
- Kamboj, U.; Kaushal, N.; Mishra, S.; Munjal, N. Application of Selective Near Infrared Spectroscopy for Qualitative and Quantitative Prediction of Water Adulteration in Milk. Mater. Today Proc. 2020, 24, 2449–2456.
- Visconti, L.G.; Rodríguez, M.S.; Di Anibal, C.V. Determination of grated hard cheeses adulteration by near infrared spectroscopy (NIR) and multivariate analysis. Int. Dairy J. 2020, 104, 104647.
- Bázár, G.; Kovacs, Z.; Tanaka, M.; Furukawa, A.; Nagai, A.; Osawa, M.; Itakura, Y.; Sugiyama, H.; Tsenkova, R. Water revealed as molecular mirror when measuring low concentrations of sugar with near infrared light. Anal. Chim. Acta 2015, 896, 52–62.
- Tahir, H.E.; Arslan, M.; Mahunu, G.K.; Jiyong, S.; Xiaobo, Z.; Gasmalla, M.A.A.; Mariod, A.A. Data Fusion Approach Improves the Prediction of Single Phenolic Compounds in Honey: A Study of NIR and Raman Spectroscopies. eFood 2019, 1, 173–180.
- De Oliveira, V.M.A.T.; Baqueta, M.R.; Março, P.H.; Valderrama, P. Authentication of organic sugars by NIR spectroscopy and partial least squares with discriminant analysis. Anal. Methods 2020, 12, 701–705.
- Kaszab, T.; Bodor, Z.; Kovacs, Z.; Benedek, C. Classification models of hungarian honey samples based on analytical and physical characteristics. Hung. Agric. Eng. 2017, 32, 22–28.
- Ballabio, D.; Robotti, E.; Grisoni, F.; Quasso, F.; Bobba, M.; Vercelli, S.; Gosetti, F.; Calabrese, G.; Sangiorgi, E.; Orlandi, M.; et al. Chemical profiling and multivariate data fusion methods for the identification of the botanical origin of honey. Food Chem. 2018, 266, 79–89.
- Zhu, X.; Li, S.; Shan, Y.; Zhang, Z.; Li, G.; Su, D.; Liu, F. Detection of adulterants such as sweeteners materials in honey using near-infrared spectroscopy and chemometrics. J. Food Eng. 2010, 101, 92–97.
- Bázár, G.; Romvári, R.; Szabó, A.; Somogyi, T.; Éles, V.; Tsenkova, R. NIR detection of honey adulteration reveals differences in water spectral pattern. Food Chem. 2016, 194, 873–880.
- Bodor, Z.; Zaukuu, J.Z.; Aouadi, B.; Benedek, C.; Kovacs, Z. Application of NIRS and Aquaphotomics for the detection of adulteration of honey, paprika and tomato Paste. In SZIEntific Meeting for Young Researchers: Ifjú Tehetségek Találkozója; Szent István University: Budapest, Hungary, 2019; pp. 76–91. ISBN 978-963-269-886-1.
- Huang, F.; Song, H.; Guo, L.; Guang, P.; Yang, X.; Li, L.; Zhao, H.; Yang, M. Detection of adulteration in Chinese honey using NIR and ATR-FTIR spectral data fusion. Spectrochim. Acta Part. A Mol. Biomol. Spectrosc. 2020, 235, 118297.
- Aliaño-González, M.J.; Ferreiro-González, M.; Espada-Bellido, E.; Palma, M.; Barbero, G.F. A screening method based on Visible-NIR spectroscopy for the identification and quantification of different adulterants in high-quality honey. Talanta 2019, 203, 235–241.
- Segato, S.; Merlanti, R.; Bisutti, V.; Montanucci, L.; Serva, L.; Lucatello, L.; Mirisola, M.; Contiero, B.; Conficoni, D.; Balzan, S.; et al. Multivariate and machine learning models to assess the heat effects on honey physicochemical, colour and NIR data. Eur. Food Res. Technol. 2019, 245, 2269–2278.
- Bodor, Z.; Ghdir, C.; Zaukuu, J.-L.Z.; Benedek, C.; Kovacs, Z. Detection of heat treatment of honey with near infrared spectroscopy. Hung. Agric. Eng. 2019, 36, 57–62.
- Bodor, Z.; Koncz, F.A.; Zaukuu, J.-L.Z.; Kertész, I.; Gillay, Z.; Kaszab, T.; Kovacs, Z.; Benedek, C. Effect of heat treatment on chemical and sensory properties of honeys. Anim. Welf. Ethol. Hous. Syst. 2017, 13, 39–48.
- Marquetti, I.; Link, J.V.; Lemes, A.L.G.; dos Santos Scholz, M.B.; Valderrama, P.; Bona, E. Partial least square with discriminant analysis and near infrared spectroscopy for evaluation of geographic and genotypic origin of arabica coffee. Comput. Electron. Agric. 2016, 121, 313–319.
- Ribeiro, J.S.; Ferreira, M.M.C.; Salva, T.J.G. Chemometric models for the quantitative descriptive sensory analysis of Arabica coffee beverages using near infrared spectroscopy. Talanta 2011, 83, 1352–1358.
- Bertone, E.; Venturello, A.; Giraudo, A.; Pellegrino, G.; Geobaldo, F. Simultaneous determination by NIR spectroscopy of the roasting degree and Arabica/Robusta ratio in roasted and ground coffee. Food Control 2016, 59, 683–689.
- Craig, A.P.; Botelho, B.G.; Oliveira, L.S.; Franca, A.S. Mid infrared spectroscopy and chemometrics as tools for the classification of roasted coffees by cup quality. Food Chem. 2018, 245, 1052–1061.
- Sun, Y.; Wang, Y.; Huang, J.; Ren, G.; Ning, J.; Deng, W.; Li, L.; Zhang, Z. Quality assessment of instant green tea using portable NIR spectrometer. Spectrochim. Acta Part A Mol. Biomol. Spectrosc. 2020, 240, 118576.
- Wang, J.; Zareef, M.; He, P.; Sun, H.; Chen, Q.; Li, H.; Ouyang, Q.; Guo, Z.; Zhang, Z.; Xu, D. Evaluation of matcha tea quality index using portable NIR spectroscopy coupled with chemometric algorithms. J. Sci. Food Agric. 2019, 99, 5019–5027.
- De Carvalho, B.M.A.; De Carvalho, L.M.; Dos Reis Coimbra, J.S.; Minim, L.A.; De Souza Barcellos, E.; Da Silva Júnior, W.F.; Detmann, E.; De Carvalho, G.G.P. Rapid detection of whey in milk powder samples by spectrophotometric and multivariate calibration. Food Chem. 2015, 174, 1–7.
- Németh, D.; Balazs, G.; Daood, H.G.; Kovacs, Z.; Bodor, Z.; Zaukuu, J.L.Z.; Szentpeteri, V.; Kokai, Z.; Kappel, N. Standard analytical methods, sensory evaluation, NIRS and electronic tongue for sensing taste attributes of different melon varieties. Sensors 2019, 19, 5010.
- Petrovic, G.; Aleixandre-Tudo, J.L.; Buica, A. Viability of IR spectroscopy for the accurate measurement of yeast assimilable nitrogen content of grape juice. Talanta 2020, 206, 120241.
- Ilaslan, K.; Boyaci, I.H.; Topcu, A. Rapid analysis of glucose, fructose and sucrose contents of commercial soft drinks using Raman spectroscopy. Food Control 2015, 48, 56–61.
- Li, X.; He, Y.; Wu, C.; Sun, D.W. Nondestructive measurement and fingerprint analysis of soluble solid content of tea soft drink based on Vis/NIR spectroscopy. J. Food Eng. 2007, 82, 316–323.
- Rácz, A.; Héberger, K.; Fodor, M. Quantitative determination and classification of energy drinks using near-infrared spectroscopy. Anal. Bioanal. Chem. 2016, 408, 6403–6411.
- De Santana, M.C.; Ferreira, M.M.C.; Pallone, J.A.L. Control of ascorbic acid in fortified powdered soft drinks using near-infrared spectroscopy (NIRS) and multivariate analysis. J. Food Sci. Technol. 2020, 57, 1233–1241.
- Cen, H.; Bao, Y.; He, Y.; Sun, D.W. Visible and near infrared spectroscopy for rapid detection of citric and tartaric acids in orange juice. J. Food Eng. 2007, 82, 253–260.
- Tsenkova, R. Aquaphotomics: Dynamic spectroscopy of aqueous and biological systems describes peculiarities of water. J. Near Infrared Spectrosc. 2009, 17, 303–313.
- Munćan, J.S.; Matija, L.; Simić-Krstić, J.B.; Nijemčević, S.S.; Djuro, L. Discrimination of mineral waters using near-infrared spectroscopy and aquaphotomics. Hem. Ind. 2014, 68, 257–264.
- Kovacs, Z.; Bázár, G.; Oshima, M.; Shigeoka, S.; Tanaka, M. Water spectral pattern as holistic marker for water quality monitoring. Talanta 2016, 147, 598–608.
- Prieto, N.; Manteco, A.R.; Lavı, P.; Andre, S. Potential use of near infrared reflectance spectroscopy (NIRS) for the estimation of chemical composition of oxen meat samples. Meat Sci. 2006, 74, 487–496.
- Huang, L.; Zhao, J.; Chen, Q.; Zhang, Y. Nondestructive measurement of total volatile basic nitrogen (TVB-N) in pork meat by integrating near infrared spectroscopy, computer vision and electronic nose techniques. Food Chem. 2014, 145, 228–236.
- Boschetti, L.; Ottavian, M.; Facco, P.; Barolo, M.; Serva, L.; Balzan, S.; Novelli, E. A correlative study on data from pork carcass and processed meat (Bauernspeck) for automatic estimation of chemical parameters by means of near-infrared spectroscopy. Meat Sci. 2013, 95, 621–628.
- Zhang, L.; Sun, B.; Xie, P.; Li, H.; Su, H.; Sha, K.; Huang, C.; Lei, Y.; Liu, X.; Wang, H. Using near infrared spectroscopy to predict the physical traits of Bos grunniens meat. LWT Food Sci. Technol. 2015, 64, 602–608.
- Bazar, G.; Szabo, A.; Andrassy-Baka, G.; Romvari, L.; Locsmandi, R.; Princz, Z.; Jekkel, G. NIRS Prediction for Protein and Intramuscular Fat Content of Rabbit Hind Leg Meat. Agriculture 2007, 13, 1–5.
- Prieto, N.; López-campos, Ó.; Aalhus, J.L.; Dugan, M.E.R.; Juárez, M.; Uttaro, B. Use of near infrared spectroscopy for estimating meat chemical composition, quality traits and fatty acid content from cattle fed sun fl ower or fl axseed. Meat Sci. 2014, 98, 279–288.
- Mourot, B.P.; Gruffat, D.; Durand, D.; Chesneau, G.; Mairesse, G.; Andueza, D. Breeds and muscle types modulate performance of near-infrared reflectance spectroscopy to predict the fatty acid composition of bovine meat. Meat Sci. 2015, 99, 104–112.
- De Marchi, M.; Manuelian, C.L.; Manfrin, D.; Meneghesso, M.; Cassandro, M.; Penasa, M. Prediction of sodium content in commercial processed meat products using near infrared spectroscopy. Meat Sci. 2017, 125, 61–65.
- Campos, M.I.; Mussons, M.L.; Antolin, G.; Debán, L.; Pardo, R. On-line prediction of sodium content in vacuum packed dry-cured ham slices by non-invasive near infrared spectroscopy. Meat Sci. 2017, 126, 29–35.
- Viljoen, M.; Hoffman, L.C.; Brand, T.S. Prediction of the chemical composition of freeze dried ostrich meat with near infrared reflectance spectroscopy. Meat Sci. 2005, 69, 255–261.
- Kapper, C.; Klont, R.E.; Verdonk, J.M.A.J.; Urlings, H.A.P. Prediction of pork quality with near infrared spectroscopy (NIRS): 1. Feasibility and robustness of NIRS measurements at laboratory scale. Meat Sci. 2012, 91, 294–299.
- Zamora-Rojas, E.; Garrido-Varo, A.; de Pedro-Sanz, E.; Guerrero-Ginel, J.E.; Pérez-Marín, D. Prediction of fatty acids content in pig adipose tissue by near infrared spectroscopy: At-line versus in-situ analysis. Meat Sci. 2013, 95, 503–511.
- Alamprese, C.; Casale, M.; Sinelli, N.; Lanteri, S.; Casiraghi, E. Detection of minced beef adulteration with turkey meat by UV e vis, NIR and MIR spectroscopy. LWT Food Sci. Technol. 2013, 53, 225–232.
- Kamruzzaman, M.; Sun, D.; Elmasry, G.; Allen, P. Fast detection and visualization of minced lamb meat adulteration using NIR hyperspectral imaging and multivariate image analysis. Talanta 2013, 103, 130–136.
- Mamani-linares, L.W.; Gallo, C.; Alomar, D. Identification of cattle, llama and horse meat by near infrared reflectance or transflectance spectroscopy. Meat Sci. 2012, 90, 378–385.
- Rady, A.; Adedeji, A. Assessing different processed meats for adulterants using visible-near-infrared spectroscopy. Meat Sci. 2018, 136, 59–67.
- De Marchi, M. On-line prediction of beef quality traits using near infrared spectroscopy. Meat Sci. 2013, 94, 455–460.
- Piao, S.; Okura, T.; Irie, M. On-site evaluation of Wagyu beef carcasses based on the monounsaturated, oleic, and saturated fatty acid composition using a handheld fiber-optic near-infrared spectrometer. Meat Sci. 2017, 137, 258–264.
- Zamora-Rojas, E.; Pérez-Marín, D.; De Pedro-Sanz, E.; Guerrero-Ginel, J.E.; Garrido-Varo, A. Handheld NIRS analysis for routine meat quality control: Database transfer from at-line instruments. Chemom. Intell. Lab. Syst. 2012, 114, 30–35.
- Reis, M.M.; Martínez, E.; Saitua, E.; Rodríguez, R.; Pérez, I.; Olabarrieta, I. Non-invasive differentiation between fresh and frozen/thawed tuna fillets using near infrared spectroscopy (Vis-NIRS). LWT Food Sci. Technol. 2017, 78, 129–137.
- Agyekum, A.A.; Kutsanedzie, F.Y.H.; Annavaram, V.; Mintah, B.K.; Asare, E.K.; Wang, B. FT-NIR coupled chemometric methods rapid prediction of K-value in fish. Vib. Spectrosc. 2020, 108, 103044.
- Alamprese, C.; Casiraghi, E. Application of FT-NIR and FT-IR spectroscopy to fish fillet authentication. LWT Food Sci. Technol. 2015, 63, 720–725.
- Grassi, S.; Casiraghi, E.; Alamprese, C. Handheld NIR device: A non-targeted approach to assess authenticity of fish fillets and patties. Food Chem. 2018, 243, 382–388.
- Hui, Z.Z.C.B.Y. Identification of Edible Vegetable Oil by Two Dimensional Correlation Near-infrared Spectroscopy. J. Chin. Cereal. Oils Assoc. 2011, 9.
- Paiva, E.M.; Rohwedder, J.J.R.; Pasquini, C.; Pimentel, M.F.; Pereira, C.F. Quantification of biodiesel and adulteration with vegetable oils in diesel/biodiesel blends using portable near-infrared spectrometer. Fuel 2015, 160, 57–63.
- Casale, M.; Simonetti, R. Near infrared spectroscopy for analysing olive oils. J. Near Infrared Spectrosc. 2014, 22, 59–80.
- Christy, A.A.; Kasemsumran, S.; Du, Y.; Ozaki, Y. The detection and quantification of adulteration in olive oil by near-infrared spectroscopy and chemometrics. Anal. Sci. 2004, 20, 935–940.
- Özdemir, D.; Öztürk, B. Near infrared spectroscopic determination of olive oil adulteration with sunflower and corn oil. J. Food Drug Anal. 2007, 15, 40–47.
- Szabo, A.; Bazar, G.; Andrassy-Baka, G.; Romvari, L.; Locsmandi, R. A Near Infrared Spectroscopic (NIR) Approach to Estimate Quality Alterations During Prolonged Heating of Lard. Acta Aliment. 2009, 38, 97–106.
- Bázár, G.; Szabó, A.; Romvári, R. NIR based quality control of frying fat samples by means of Polar Qualification System. Food Control 2010, 21, 992–997.
- Szabó, A.; BázáR, G.; Locsmándi, L.; Romvári, R. Quality alterations of four frying fats during long-term heating (conventional analysis and NIRS calibration). J. Food Qual. 2010, 33, 42–58.
- Kuligowski, J.; Carrión, D.; Quintás, G.; Garrigues, S.; de la Guardia, M. Direct determination of polymerised triacylglycerides in deep-frying vegetable oil by near infrared spectroscopy using Partial Least Squares regression. Food Chem. 2012, 131, 353–359.
- Guo, H.; Li, P.; Guo, J.; Xiao, N. Study on the Quality Assessment of Canola Oil after Prolonged Frying Using Near-Infrared Spectroscopy. In Proceedings of the 2019 International Conference on Machine Learning, Big Data and Business Intelligence (MLBDBI), Taiyuan, China, 8–10 November 2019; pp. 354–357.
- Cattaneo, T.M.P.; Stellari, A. NIR Spectroscopy as a Suitable Tool for the Investigation of the Horticultural Field. Agronomy 2019, 9, 503.
- Khatiwada, B.P.; Subedi, P.P.; Hayes, C.; Jnr, L.C.C.C.; Walsh, K.B. Assessment of internal flesh browning in intact apple using visible-short wave near infrared spectroscopy. Postharvest Biol. Technol. 2016, 120, 103–111.
- Eisenstecken, D.; Stürz, B.; Robatscher, P.; Lozano, L.; Zanella, A.; Oberhuber, M. The potential of near infrared spectroscopy (NIRS) to trace apple origin: Study on different cultivars and orchard elevations. Postharvest Biol. Technol. 2019, 147, 123–131.
- Fan, S.; Li, J.; Xia, Y.; Tian, X.; Guo, Z.; Huang, W. Long-term evaluation of soluble solids content of apples with biological variability by using near-infrared spectroscopy and calibration transfer method. Postharvest Biol. Technol. 2019, 151, 79–87.
- Sánchez, M.; Torres, I.; de la Haba, M.; Chamorro, A.; Garrido-Varo, A.; Pérez-Marín, D. Rapid, simultaneous, and in situ authentication and quality assessment of intact bell peppers using near-infrared spectroscopy technology. J. Sci. Food Agric. 2019, 99, 1613–1622.
- Sánchez, M.; Pintado, C.; de la Haba, M.; Torres, I.; García, M.; Pérez-Marín, D. In situ ripening stages monitoring of Lamuyo pepper using a new-generation near-infrared spectroscopy sensor. J. Sci. Food Agric. 2020, 100, 1931–1939.
- Yang, Q.; Yang, X.; Zhang, Q.; Wang, Y.; Song, H.; Huang, F. Quantifying Soluble Sugar in Super Sweet Corn Using Near-Infrared Spectroscopy Combined with Chemometrics. Optik 2020, 220, 165128.