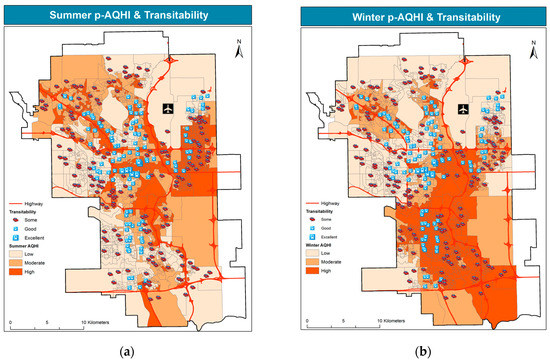
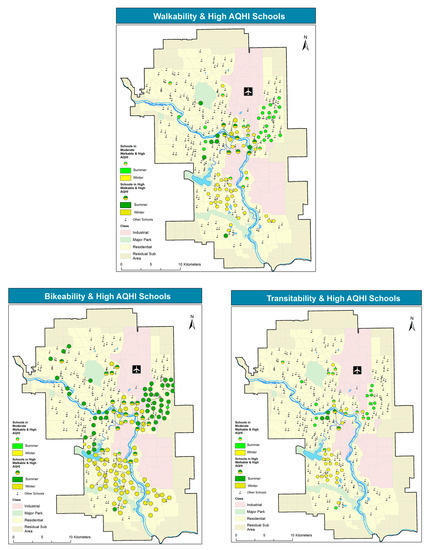
An exploratory spatial analysis investigates the location of schools in Calgary (Canada) in relation to air pollution and active transportation options. Air pollution exhibits marked spatial variation throughout the city, along with distinct spatial patterns in summer and winter; however, all school locations lie within low to moderate pollution levels. Conversely, the study shows that almost half of the schools lie in low walkability locations; likewise, transitability is low for 60% of schools, and only bikability is widespread, with 93% of schools in very bikable locations. School locations are subsequently categorized by pollution exposure and active transportation options. This analysis identifies and maps schools according to two levels of concern: schools in car-dependent locations and relatively high pollution; and schools in locations conducive of active transportation, yet exposed to relatively high pollution. The findings can be mapped and effectively communicated to the public, health practitioners, and school boards. The study contributes with an explicitly spatial approach to the intra-urban public health literature. Developed for a moderately polluted city, the methods can be extended to more severely polluted environments, to assist in developing spatial public health policies to improve respiratory outcomes, neurodevelopment, and metabolic and attention disorders in school-aged children.
- spatial analysis
- air pollution
- active transportation
- walkability
- schools
- children
- proximity
- public health
- GIS (geographic information systems)
- Calgary
1. Introduction
2. Materials and Methods
2.1. Study Area
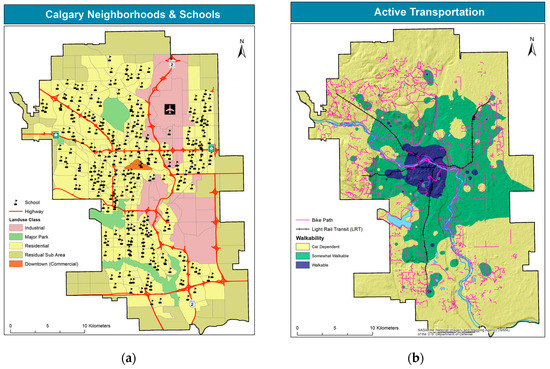
2.2. Data
2.3. Methods
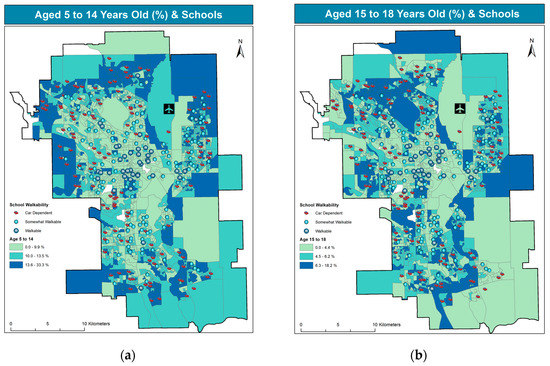
3. Results

4. Discussion
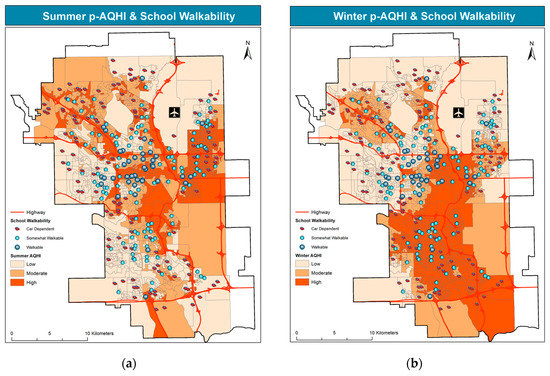
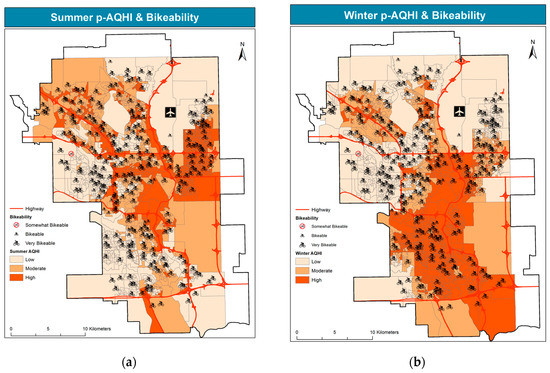
4.1. Air Pollution and School Location
4.2. Measuring Active Transportation
4.3. Schools, Car Dependence, and Air Pollution
4.4. Recommandations and Future Work
5. Conclusions
Acknowledgments
Author Contributions
Conflicts of Interest
References
- Dockery, D.W.; Pope, C.A.; Xu, X.; Spengler, J.D.; Ware, J.H.; Fay, M.E.; Ferris, B.G., Jr.; Speizer, F.E. An association between air pollution and mortality in six US cities. N. Engl. J. Med. 1993, 329, 1753–1759. [Google Scholar] [CrossRef] [PubMed]
- Gryparis, A.; Forsberg, B.; Katsouyanni, K.; Analitis, A.; Touloumi, G.; Schwartz, J.; Samoli, E.; Medina, S.; Anderson, H.R.; Niciu, E.M.; et al. Acute effects of ozone on mortality from the “Air Pollution and Health a European Approach” Project. Am. J. Respir. Crit. Care Med. 2004, 170, 1080–1087. [Google Scholar] [CrossRef] [PubMed]
- Monrad, M.; Sajadieh, A.; Christensen, J.S.; Ketzel, M.; Raaschou-Nielsen, O.; Tjønneland, A.; Sørensen, M. Long-Term Exposure to Traffic-Related Air Pollution and Risk of Incident Atrial Fibrillation: A Cohort Study. Environ. Health Perspect. 2017, 125, 422–427. [Google Scholar] [CrossRef] [PubMed]
- Jerret, M.; McConnell, R.; Wolch, J.; Chang, R.; Lam, C.; Dunton, G.; Gilliland, F.; Lurmann, F.; Islam, T.; Berhane, K. Traffic-related air pollution and obesity formation in children: A longitudinal, multilevel analysis. Environ. Health 2014, 13. [Google Scholar] [CrossRef] [PubMed]
- Sunyer, J.; Esnaola, M.; Alvarez-Pedrerol, M.; Forns, J.; Rivas, I.; López-Vicente, M.; Suades-González, E.; Foraster, M.; Garcia-Esteban, R.; Basagaña, X. Association between traffic-related air pollution in schools and cognitive development in primary school children: A prospective cohort study. PLoS Med. 2015, 12, e1001792. [Google Scholar] [CrossRef] [PubMed]
- Richardson, D.B.; Volkow, N.D.; Kwon, M.-P.; Kaplan, R.M.; Goodchild, M.F.; Croyle, R.T. Spatial turn in health research. Science 2013, 339, 1390–1392. [Google Scholar] [CrossRef] [PubMed]
- Goodchild, M.F.; Janelle, D.G. Thinking Spatially in the Social Sciences. In Spatial Integrated Social Science; Oxford University Press: Oxford, UK, 2004; pp. 3–17. [Google Scholar]
- Anselin, L.; Getis, A. Spatial statistical analysis and geographic information systems. In Perspectives on Spatial Data Analysis; Advances in Spatial Science; Springer: Berlin/Heidelberg, Germany, 2010; pp. 35–47. [Google Scholar]
- Shahid, R.; Berazzon, S.; Knudtson, M.L.; Ghali, W.A. Comparison of distance measures in spatial analytical modeling for health service planning. BMC Health Serv. Res. 2009, 9, 200. [Google Scholar] [CrossRef] [PubMed]
- Fotheringham, A.S.; Brunsdon, C.; Charlton, M. Geographically Weighted Regression: The Analysis of Spatially Varying Relationships; Wiley: West Sussex, UK, 2002. [Google Scholar]
- Anselin, L. Local indicator of spatial association—LISA. Geogr. Anal. 1995, 2, 93–115. [Google Scholar] [CrossRef]
- Wang, W.; Ying, Y.; Wu, Q.; Zhang, H.; Ma, D.; Xiao, W. A GIS-based spatial correlation analysis for ambient air pollution and AECOPD hospitalization in Jinan, China. Respir. Med. 2015, 109, 372–378. [Google Scholar] [CrossRef] [PubMed]
- Lee, D.; Mitchell, R. Controlling for localized spatio-temporal autocorrelation in long-term air pollution and health studies. Stat. Methods Med. Res. 2014, 23, 488–506. [Google Scholar] [CrossRef] [PubMed]
- Brunekreef, B.; Holgate, S.T. Air Pollution and health. Lancet 2002, 360, 1233–1242. [Google Scholar] [CrossRef]
- Sunyer, J.; Suades-González, E.; García-Esteban, R.; Rivas, I.; Pujol, J.; Alvarez-Pedrerol, M.; Basagaña, X. Traffic-Related Air Pollution and Attention in Primary School Children. Epidemiology 2017, 28, 181–189. [Google Scholar] [CrossRef] [PubMed]
- Lachapelle, U.; Frank, L.D.; Sallis, J.F.; Saelens, B.; Conway, T.L. Active transportation by transit-dependent and choice riders and potential displacement of leisure physical activity. J. Plan. Educ. Res. 2015, 36, 225–238. [Google Scholar] [CrossRef]
- Mueller, N.; Rojas-Rueda, D.; Cole-Hunter, T.; de Nazelle, A.; Dons, E.; Gerike, R.; Götschi, T.; Int Panis, L.; Kahlmeier, S.; Nieuwenhuijsen, M. Health impact assessment of active transportation: A systematic review. Prev. Med. 2015, 76, 103–114. [Google Scholar] [CrossRef] [PubMed]
- Maghelal, P.K.; Capp, C.J. Walkability: A review of existing pedestrian indices. J. Urban Reg. Inf. Syst. Assoc. 2011, 23, 5–17. [Google Scholar]
- Laxer, R.E.; Janssen, I. The proportion of youth’s physical inactivity attributable to neighborhood built environment features. Int. J. Health Geogr. 2013, 12, 31. [Google Scholar] [CrossRef] [PubMed]
- Prince, S.A.; Tremblay, M.S.; Prud’homme, D.; Colley, R.; Sawada, M.; Kristjansson, E.A. Neighbourhood differences in objectively measures physical activity, sedentary time and body mass index. J. Prev. Med.2011, 1, 182–189. [Google Scholar]
- Sallis, J.F.; Prochaska, J.J.; Tylor, W.C. A review of correlates of physical activity of children and adolescents. Med. Sci. Sports Exerc. 2000, 32, 963–975. [Google Scholar] [CrossRef] [PubMed]
- Dyck, D.V.; Sallis, J.F.; Cardon, G.; Deforche, B.; Adams, M.A.; Geremia, C.; Bourdeaudhij, I.D. Associations of neighbourhood characteristics with active park use: An observational study in two cities in the USA and Belgium. Int. J. Health Geogr. 2013, 12, 26. [Google Scholar] [CrossRef] [PubMed][Green Version]
- Kligerman, M.; Sallis, J.F.; Ryan, S.; Frank, L.D.; Nader, P.R. Association of neighborhood design and recreation environment variables with physical activity and body mass index in adolescents. Am. J. Health Promot. 2007, 21, 274–277. [Google Scholar] [CrossRef] [PubMed]
- Duncan, D.T.; Aldstadt, J.; Whalen, J.; Melly, S.J.; Gortmaker, S.L. Validation of Walkscore for estimating neighborhood walkability: An analysis of four US metropolitan areas. Int. J. Environ. Res. Public Health 2011, 8, 4160–4179. [Google Scholar] [CrossRef] [PubMed]
- Carr, L.J.; Dunsiger, S.I.; Marcus, B.H. Walk Score as a global estimate of neighbourhood walkability. Am. J. Prev. Med. 2010, 39, 460–463. [Google Scholar] [CrossRef] [PubMed]
- Saelens, B.E.; Sallis, J.F.; Black, J.B.; Chen, D. Neighborhood-based differences in physical activity: An environment scale evaluation. Am. J. Public Health 2003, 93, 1552–1558. [Google Scholar] [CrossRef] [PubMed]
- Schlossberg, M.; Agrawal, A.W.; Irvin, K. An assessment of GIS-enabled walkability audits. J. Urban Reg. Inf. Syst. Assoc. 2008, 19, 5–11. [Google Scholar]
- Frank, L.D.; Sallis, J.F.; Saelens, B.E.; Leary, L.; Cain, K.; Conway, T.L.; Hess, P.M. The development of a walkability index: Application to the neighbourhood quality of life study. Br. J. Sports Med. 2010, 44, 924–933. [Google Scholar] [CrossRef] [PubMed]
- Giles-Corti, B.; Kelty, S.F.; Zubrik, S.R.; Villanueva, K. Encouraging walking for transport and physical activity in children and adolescents: How important is the built environment? Sports Med. 2009, 39, 995–1009. [Google Scholar] [CrossRef] [PubMed]
- Krambeck, H.; Shah, J. Evaluating and comparing quality of pedestrian infrastructure and services across developing cities: Global walkability index. In Proceedings of the Transportation Research Board 87th Annual Meeting, Washington, DC, USA, 13–17 January 2008. [Google Scholar]
- McCormack, G.; Giles-Corti, B.; Lange, A.; Smith, T.; Martin, K.; Pikora, T.J. An update of recent evidence of the relationship between objective and self-report measure of the physical environment and physical activity behaviours. J. Sci. Med. Sport 2004, 7, 81–92. [Google Scholar] [CrossRef]
- Moudon, A.V.; Hess, P.M.; Synder, M.C.; Stanilov, K. Effects of site design on pedestrian travel in mixed-use, medium-density environments. Transp. Res. Rec. 2003, 1758, 48–55. [Google Scholar] [CrossRef]
- Sallis, J.F.; Johnson, M.F.; Calfas, K.J.; Caparosa, S.; Nicholas, J.F. Assessing perceived physical environmental variables that may influence physical activity. Res. Q. Exerc. Sport 1997, 68, 345–351. [Google Scholar] [CrossRef] [PubMed]
- Frank, L.D.; Pivo, G. Impacts of mixed use and density on utilization of three modes of travel: Single occupant vehicle, transit, and walking. Transp. Res. Rec. 1994, 1466, 44–52. [Google Scholar]
- Walkscore. REDFIN. Seattle, WA, USA. Available online: https://www.walkscore.com/ (accessed on 10 February 2017).
- Jones, A.P.; van Sluijs, E.M.F.; Ness, A.R.; Haynes, R.; Riddoch, C.J. Physical activity in children: Does how we define neighbourhood matter? Health Place 2010, 16, 236–241. [Google Scholar] [CrossRef] [PubMed]
- Bertazzon, S.; Johnson, M.; Eccles, K.; Kaplan, G. Accounting for spatial effects in land use regression for urban air pollution modelling. Spat. Spat. Tempor. Epidemiol. 2015, 14–15, 9–21. [Google Scholar] [CrossRef] [PubMed]
- Liu, X.; Bertazzon, S. Fine scale spatiotemporal modelling of urban air pollution. In Proceedings of the Ninth International Conference on Geographic Information Science (GIScience 2016), Montreal, QC, Canada, 27–30 September 2016; Springer: Berlin, Germany, 2016; pp. 210–224. [Google Scholar]
- Bertazzon, S.; Underwood, F.; Johnson, M.; Zhang, J. Land Use Regression of Particulate Matter in Calgary, Canada. In Proceedings of the Ninth International Conference on Geographic Information Science (GIScience 2016), Montreal, QC, Canada, 27–30 September 2016; pp. 21–24. [Google Scholar]
- Shahid, R.; Bertazzon, S. Local spatial analysis and dynamic simulation of childhood obesity and neighbourhood walkability in a major Canadian city. AIMS Public Health 2015, 2, 616–637. [Google Scholar] [CrossRef]
- Statistics Canada. Census Profile. Available online: http://www12.statcan.gc.ca/census-recensement/2011/dp-pd/prof/index.cfm?Lang=E (accessed on 23 May 2017).
- CBE (Calgary Board of Education). School Walk Zones, Building and Modernizing Schools 2017. Available online: http://www.cbe.ab.ca/schools/building-and-modernizing-schools/Pages/school-walk-zones.aspx(accessed on 23 May 2017).
- City of Calgary. City of Calgary’s Open Data 2017. Available online: https://data.calgary.ca/ (accessed on 23 February 2017).
- Environmental System Research Institute 2017 (ESRI). Available online: http://www.esri.com/ (accessed on 7 June 2017).
- Statistics Canada. Census Dictionary, Census Year 2011, Online Catalogue No. 98-301-X 2012. Available online: http://www5.statcan.gc.ca/olc-cel/olc.action?ObjId=98-301-X&ObjType=2&lang=en&limit=0 (accessed on 10 March 2017).
- Calgary Region Airshed Zone 2017 (CRAZ). Available online: http://www.craz.ca (accessed on 7 June 2017).
- DeMers, M.N. Geographic Information Systems in Action 2017, 1st ed.; Wiley: New York, NY, USA, 2017; ISBN 978-119-22737-3. [Google Scholar]
- McGrew, J.C., Jr.; Monroe, C.B. An Introduction to Statistical Problem Solving in Geography 2009, 2nd ed.; Waveland Press Inc.: Long Grove, IL, USA, 2009. [Google Scholar]
- Air Quality Health Index. Environment & Climate Change Canada 2017. Available online: http://www.ec.gc.ca/cas-aqhi/default.asp?lang=En&n=CB0ADB16-1 (accessed on 17 May 2017).
- U.S. Environmental Protection Agency (U.S. EPA). Integrated Science Assessment (ISA) of Ozone and Related Photochemical Oxidants; Final Report, February 2013; U.S. Environmental Protection Agency: Washington, DC, USA, 2013.
- Wang, S.; Sun, L.; Rong, J.; Yang, Z. Transit Traffic Analysis Zone Delineating Method Based on Thiesssen Polygon. Sustainability 2014, 6, 1821–1832. [Google Scholar] [CrossRef]
- Lee, B.-J.; Kim, B.; Lee, K. Air Pollution Exposure and Cardiovascular Disease. Toxicol. Res. 2014, 30, 71–75. [Google Scholar] [CrossRef] [PubMed]
- Adams, M.D.; Yiannakoulias, N.; Kanaroglou, P.S. Air pollution exposure: An activity pattern approach for active transportation. Atmos. Environ. 2016, 140, 52–59. [Google Scholar] [CrossRef]
- The City of Calgary. Average Daily (24 h) Weekday Traffic Volume Downtwon 2011. Available online: http://www.calgary.ca/Transportation/TP/Documents/data/traffic_flow_maps/2011_flowmap_DT.pdf (accessed on 30 May 2017).
- Lawson, F.; Schuurman, N.; Amram, O.; Nathens, A.B. A geospatial analysis of the relationship between neighbourhood socio-economic status and adult severe injury in Greater Vancouver. Inj. Prev. 2015, 21, 21–265. [Google Scholar] [CrossRef] [PubMed]
- Grigsby-Toussaint, D.; Chi, S.-H.; Fiese, B.H. Where they live, how they play: Neighborhood greenness and outdoor physical activity among preschoolers. Int. J. Health Geogr. 2011, 10, 66. [Google Scholar] [CrossRef] [PubMed]
- Finn, K.; Johannsen, N.; Specker, B. Factors associated with physical activity in preschool children. J. Pediatr. 2003, 140, 81–85. [Google Scholar] [CrossRef] [PubMed]
- Abley, S.; Williams, R. Public Transport Accessibility Levels. In Proceedings of the IPENZ Transportation Group Conference, New Plymouth, New Zealand, 2–5 November 2008. [Google Scholar]
- Mamun, S.A.; Lownes, N. A Composite Index of Public Transit Accessibility. J. Public Transp. 2011, 14, 69–87. [Google Scholar] [CrossRef]
- Tuan, V.A.; Son, D.T. Accessibility to Public Transport Systems in Developing Countries—An Empirical Study in Ho Chi Minh City, Vietnam. J. East. Asia Soc. Transp. Stud. 2015, 11, 1240–1258. [Google Scholar]
- Weinberger, R.; Sweet, M.N. Integrating walkability into planning practice, Transportation Research Record. J. Transp. Res. Board 2012, 2322, 20. [Google Scholar] [CrossRef]
- Larsen, K.; Gillilsnf, J.; Hess, P.M. Route-based analysis to capture the environmental influences on child’s mode of travel between home and school. Ann. Assoc. Am. Geogr. 2011, 102, 1348–1365. [Google Scholar] [CrossRef]
- McCormack, G.R.; Shiell, A.; Giles-Corti, B.; Begg, S.; Veerman, J.L.; Geelhoed, E.; Amarasinghe, A.; Emery, J.C.H. The association between sidewalk length and walking for different purposes in established neighborhoods. Int. J. Behav. Nutr. Phys. Act. 2012, 9, 92. [Google Scholar] [CrossRef] [PubMed]
- Winters, M.; Teschke, K.; Brauer, M.; Fuller, D. Bike Score®: Associations between urban bikability and cycling behavior in 24 cities. Int. J. Behav. Nutr. 2016, 13. [Google Scholar] [CrossRef]
- Fletcher, R. ‘Something’s wrong here’: Parents pan CBE plan to have more kids use Calgary Transit. CBC News Calgary. 30 May 2017. Available online: http://www.cbc.ca/news/canada/calgary/school-bus-calgary-transit-parents-meeting-1.4137387 (accessed on 7 June 2017).
- De Nazelle, A.; Fruin, S.; Westerdahl, D.; Martinez, D.; Ripoll, A.; Kubesch, N.; Nieuwenhuijsen, M. A travel mode comparison of commuters’ exposure to air pollutants in Barcelona. Atmos. Environ. 2012, 59, 151–159. [Google Scholar] [CrossRef]