Ramp meters are traffic signals installed on freeway ramps to control the frequency at which vehicles enter the flow of traffic.
- freeway
- ramp
- traffic flow
1. Introduction
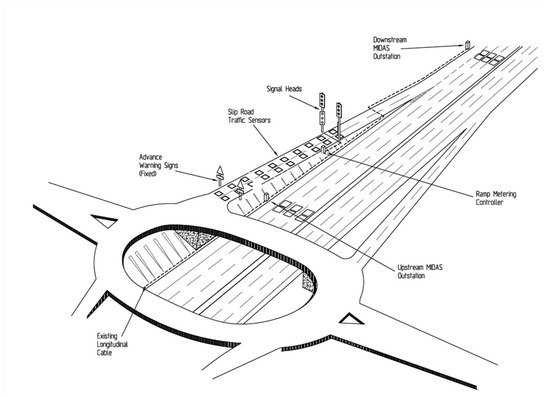
Vehicles attempting to access a busy freeway via an entry ramp might experience difficulty merging into traffic, struggling to find a gap between other drivers in the mainstream due to intense traffic volumes. When this happens, vehicles tend to line up behind the stop line on the ramp, forming a queue and waiting until the first user in the queue can move forward and enter the freeway. Subsequent users may still have to wait on the stop line until they too find a gap to access. This circumstance is a cause of congestion with all the related consequences, such as delays, decreased driving comfort levels, and a higher risk of accidents. Ramp meters are traffic signals installed on freeway ramps to control the frequency at which vehicles enter the flow of traffic [1]. The primary approach today consists of a combined system of traffic lights (on-ramps) connected with traffic sensors placed on the roadway (both on the freeway and the ramp) as showed in scheme in Figure 1. These traffic lights operate according to the intensity of the mainstream of traffic, signaling the ramp user when it is the right moment to enter the freeway. These specific traffic lights can be similar to standard ones (as in the Netherlands, where the background color of lights is yellow instead of black), although more often they will adopt exceptional cases and use just red and green lights. When amber is used, its duration after green is very brief, consisting of rapid flashes before transitioning to red.

Figure 1. Ramp metering scheme for a generic site, Highway Agency, UK [2].
Ramp meter systems are regulated by control algorithms using traffic-related input parameters, such as traffic flow density, vehicle speed, travel times, and crash and accident records to name a few. Many available algorithms have already been described in the literature, and some will be described in this paper. The benefits of ramp metering consist of a general improvement of mobility, reliability, efficiency, and safety, reducing congestion (i.e., increasing traffic speed and volume) by breaking up the platoons of cars on on-ramps and reducing demand. Even the environmental impact is reduced; the Federal Highway Administration of the U.S. Department of Transportation reports, for instance, that “Minneapolis identified a net annual savings of 1160 tons of emissions” and “Other simulation analysis shows ramp metering to be effective in reducing CO emissions by 1195 t per year” [1]. From the same study, in terms of cost–benefit analysis, “the measured benefits of implementing ramp metering systems can outweigh the associated costs by a ratio of 15 to 1, […] excellent for transportation improvements” [1].
The principal threats to the adoption of ramp metering are usually of a technical or financial nature, one being, for instance, the complexity of computer simulations and algorithms and another being the required funding for application. Besides that, further constraints may also arise due to political and bureaucratic aspects. Gathering support from the public might constitute a challenge as well. This article aims to offer a general overview of ramp metering, introducing its history briefly, describing the main engineering principles and algorithms, and proposing further considerations. The authors have selected and cited several articles considered by them to be representative for covering the subject on a general basis, focusing on research studies carried out over the last couple of years to describe some of the most recent algorithms and ramp metering models. Articles were chosen to cover the main aspects of ramp metering, presenting different types of approaches (e.g., fixed time and local control), introducing some of the commonly used computer algorithms (e.g., Asservissement Linéaire d’Entrée Autoroutière (ALINEA)) and software (e.g., VISSIM), reporting traffic-related key performance indicators (KPIs) for comparison, and showing how ramp metering can be applied to different scenarios (e.g., geography, public transport, and automated vehicles).
2. Background
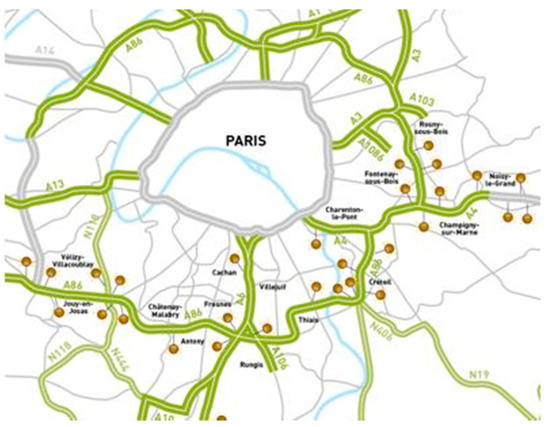
The first form of ramp metering consisted of a police officer manually directing the traffic flow from a ramp on the Eisenhower Expressway in Chicago, and it was deployed in the early 1960s. Ramp metering then spread on an experimental basis to other major cities in the United States (e.g., Detroit, Los Angeles, and Minneapolis–St. Paul) and became more and more tested and advanced. It eventually began to also be adopted in Europe and Oceania. Ramp metering began spreading in Europe during the 1980s, when the UK installed it first on the M6 near Walsall (later updated) in 1986. The Netherlands introduced ramp metering in Amsterdam in 1989, and it then spread to other cities like Rotterdam and Utrecht, and Paris (Figure 2) with more recent projects like the Praktijkproef Amsterdam started in 2013. In Germany, ramp metering can be found on the Autobahn around Hamburg, Munich, and several other areas in the Rhine-Ruhr region. In Europe, international research on the subject has been encouraged in the last two decades, with dedicated funding for projects like the Network of Excellence for Advanced Road Cooperative Traffic Management in the Information Society (NEARCTIS) and the European Ramp Metering Project (EURAMP).

Figure 2. Ramp metering deployment on Paris peri-urban motorways (AA2 Action, France) [3].
In Australia, this technology is widely used in Melbourne. The first form of similar traffic management was deployed in 1971, evolving into more recent solutions like integration with the Sydney Coordination Adaptive Traffic System (SCATS) [4]. Ramp metering eventually landed in New Zealand in the early 1980s, being gradually implemented over the years and representing the most extensive ramp metering system in the Southern Hemisphere [5]. The application of ramp metering to diverse cities and countries has significantly contributed to the evolution of this technology, as adaptation to the diverse city layouts and road setups across the globe is generally necessary (the differences between American metropolises and European cities, with their different road systems and extensions, immediately come to mind). Many research projects revolve around elaborating and improving algorithms, some of which will be reviewed in the following chapters.
Despite the benefits of ramp metering, its diffusion is often hindered by various kinds of challenges. Agencies commonly complain about the lack of political and financial support; the financial aspects include the costs for installation and maintenance, which includes staff training. Moreover, funding requests might compete with other projects having higher priority. Feasibility studies followed by cost–benefit analysis and performance metrics can demonstrate these systems’ economic validity, proving the advantages they can bring while reducing the expenses caused by their absence (e.g., costs related to accidents and freeway queues). Other local agencies (including the public) might contend the application of ramp metering due to a negative perception arising from a lack of both technical knowledge and awareness of the benefits. Implementing communication plans and information campaigns can be effective solutions, helping to gather consent and let the public get familiar with ramp meters. The geometry of existing ramps, in many cases, is not immediately compatible with ramp metering. It will not allow for easy installation, with common problems being inadequate acceleration lengths, ramps being too short or too close to each other, and visibility problems related to limited sight distances (vertical and horizontal spotting sights). If funding for infrastructure improvement schemes is available, this could represent an excellent opportunity to update the most strategically appropriate ramps with refurbishment and modernization work. Where this is not possible—or can be performed in conjunction—research for new solutions and technical approaches to be implemented should be done.
3. Economical Aspects and Critical Issues
As shown above, ramp metering represents an efficient technique that, with minimum economic impact, can affect a traffic volume management strategy positively on the freeway so that general traffic flow can occur without creating disease in minor roadways [21]. However, like any other engineering artifact, it is necessary to analyze the economic aspects deeply. Two main phases are fundamental: deployment and maintenance. From an economic point of view, they represent the immediate impact. The main obstacle of ramp metering system implementation regards the institution’s interests. With recent innovations, such as autonomous vehicles and smart cars [22], they are more likely to allocate funds to other transportation infrastructure upgrades concerning smart roads environments (SREs) [23] and intelligent transportation systems (ITSs), considering that future perspectives of communities are leading to the gradual implementation of smart cities [24]. Therefore, necessary investments for ramp metering deployment are first subjected to an in-depth analysis of the art’s context state and where it will be implemented. Of course, the analysis of traffic flow will be fundamental. However, it will not represent the main aspects, considering that ramp metering proposal congestion phenomena and capacities would have been detected. Ultimately, the investment quantity will be linked to the required adaptions of existing ramps being subjected to queues and platoons more frequently. It is possible to provide a piece of general information about investment and cost levels concerning ramp metering approaches and the control strategies, shown in Figure 8, and based on [25] if the expected investments levels are low, medium, or high and if the cost types are affected.

Figure 8. General comparison of control strategy cost levels [25].
This entry is adapted from the peer-reviewed paper 10.3390/su13020850
