Multiphase flows appear in many industrial and environmental applications (dredging, oil industry, mining industry, cement industry, among others), quite often as two-phase flows, either solid/liquid, liquid/liquid or gas/liquid flows.
When we speak about multiphase flows we are referring both to flow in channels or pipes or in other process units. In our studies we have been more directed to multiphase flows in pipes.
Being able to model and accurately predict the behaviour of such flows and to monitor, as well, the flows themselves, is of high importance to guarantee a stable flow and to optimize energy consumption, by designing adequately the conveying system, without the need to overdimensioning conveying equipment to avoid, for instance, pipe blockage.
Maria da Graça Rasteiro and Pedro Faia
- Multiphase systems
- Flows
- Solid/Liquid flows
- Liquid/Liquid flows
- Gas/liquid flows
- Modelling
- Tomography
Introduction
When dealing with multiphase flows, the size of the disperse phase (solid, liquid or gas) can vary and that influences the flow regime. Additionally, the difference in density of the two phases does also influence the flow regime. This is more notorious in the case of solid/liquid flows. Depending on the density difference it is possible to observe either a homogeneous distribution of the particles in the pipe cross-section (see for instance what happens when buoyant particles are being conveyed [1]) or a heterogeneous distribution in the pipe cross-section, when conveying settling suspensions of higher density[2]. In this last case different conveying regimes can be observed: heterogeneous regime; silding bed regime; stationary bed regime (see Figure 1). Also when liquid/liquid or gas/liquid systems are being conveyed, both stratified and homogeneous regimes can occur (see Figure 2).
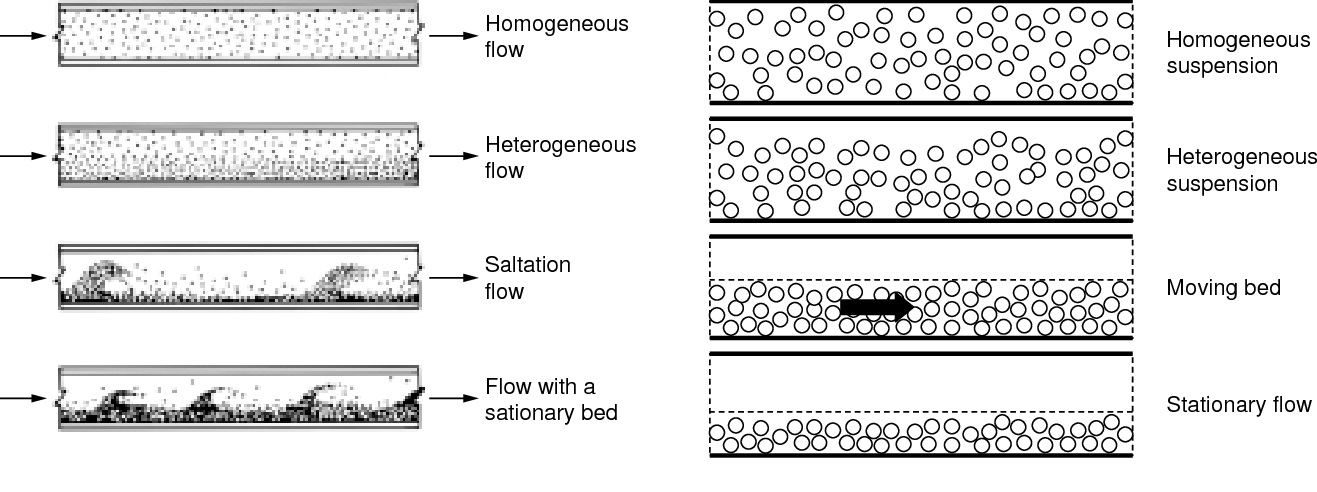
Figure 1. Different flow regimes for solid/liquid suspensions flows.
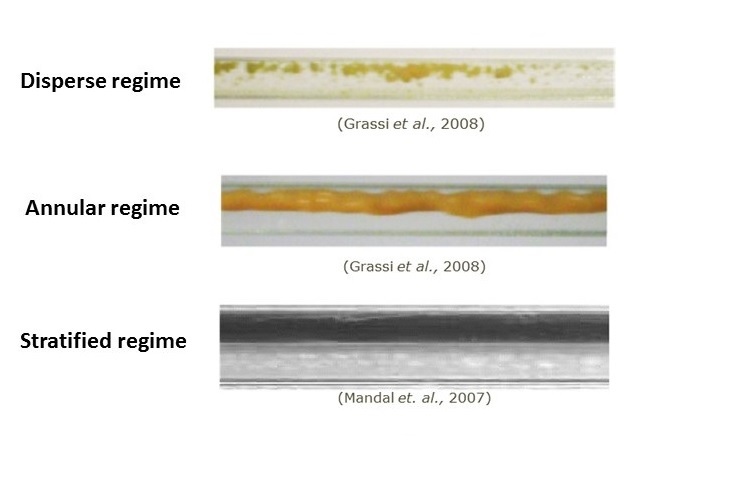
Figure 2. Different flow regimes for liquid/liquid flow in pipes.
The modelling of such systems is highly complex, even if the prediction of pressure drop in these systems is very important. The traditional way to deal with this issue is to use empirical correlations [3], which, of course, are always limited in their application. More recently, more precise approaches are beig followed, namely Euler-Euler approaches or Euler- Lagrangia models[2]. In the first case the system is treated using mixture properties to describe it, while, in the second case, the disperse phase is treated separately making use of Lattice Boltzman approaches or Discrete Element Methods (DEM)[2]. The reason to choose one of the referred approaches has to do with the computational effort which is much, much higher in the second case, limiting the use of this approach to dilute systems. The mixture model approach does still lead to an accurate prediction of pressure drop in the flow system for the different flow regimes, except for the case where stationary beds are formed.
Results for Settling Suspensions Flow: Modelling and Experimental
Some results (pressure drop and concentration profiles) for the flow of settling suspensions in pipes are presented below (0.44 mm diameter particles, density 2479 kg m-3). Both experimental and calculated values are presented. Concentrations up to 40% in volume have been tested. For the modelling the Euler-Euler approach was used, making use of the mixture model. A CFD platform (COMSOL) was used for the modelling calculations.
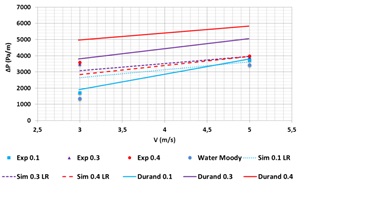
Figure 3. Pressure drop for the flow of a settling suspension (experimental, mixture model and Durand correlation)[2].
a)
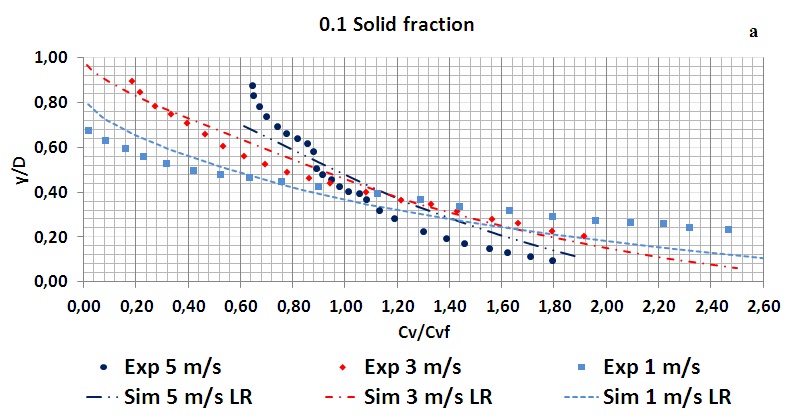
b)
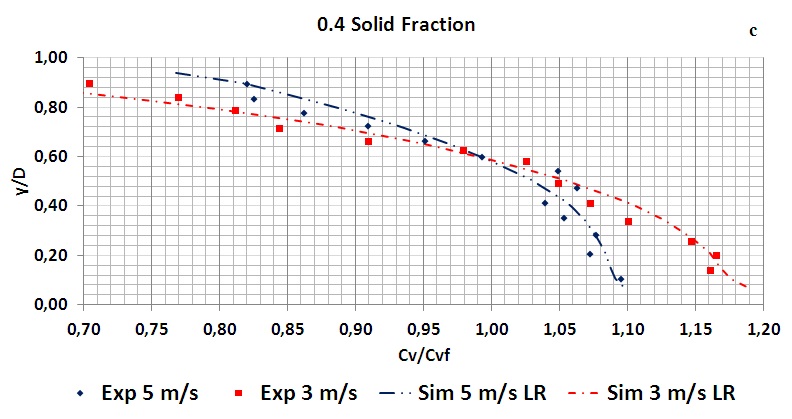
Figure 4. Concentration profiles for the flow of a settling suspension (experimental and mixture model): a) 10% volume concentration of particles; b) 40% volume concentration of particles[2].
In these graphs it is obvious the influence of the flow velocity in the solids distribution in the pipe cross-section.
In Figure 5 it is also possible to observe the solids distribution (particles with diameter between 0.1-0.2 mm, density 2500 kgm-3) for different solids concentration and flow velocities, acquired using electric impedance tomography (EIT)[4]. It is clear the influence of the solids concentration and flow velocity on the conveying regime: lower solids concentration and higher flow velocities lead to more homogeneous distributions, as can be observed from the images.
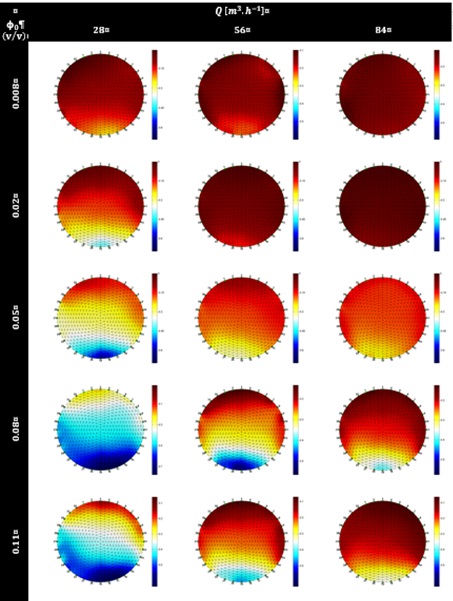
Figure 5. 2D EIT images for solid/liquid suspensions flows for three flow rates (velocities) and several particle concentrations. Different flow regimes can be observed[4].
Liquid/Liquid Flows: Experimental Monitoring
In the case of liquid/liquid flows it is possible to observe different conveying regimes, depending on the mixture velocity and concentration and characteristics of the disperse phase. The two main regimes are the disperse regime and the stratified regime, being also possible to observe, in some cases, the annular regime. There are some studies that allow us to observe the phases distribution in the pipe cross-section, most of them making use of sampling or imaging techniques to observe that distribution [5]. More recently, a new study made use of Electrical Tomography (EIT) to depict the different flow regimes (dispersed and stratified) depending on the operating conditions, as can be observed in Figures 6 and 7[6][7]. A liquid/liquid model mixture of paraffin/water was used in these studies.
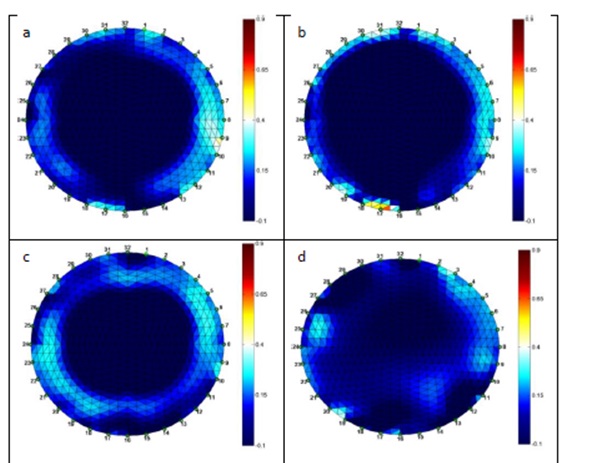
Figure 6. Dispersed flow regime of an oil/water mixture with 22% volume of oil for increasing mixture velocities: a) 0.9 m/s; b)1.5 m/s; c) 2.1 m/s; d) 2.6 m/s[6].
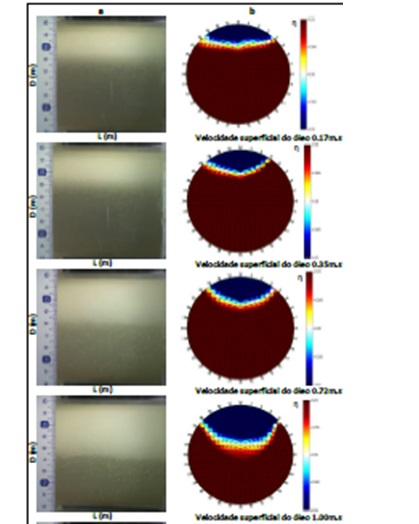
Figure 7. Stratified flow regime for an oil/water mixture, for a superficial water velocity of 0.30 m/s and for increasing oil velocities: a) 0.17 m/s; b) 0.35 m/s; c) 0.72 m/s; d) 1.0 m/s[7].
Regarding modelling of these systems, besides the use of empirical correlations[5], more recent studies made use of Euler-Euler approaches which have to include equations for the description of the oil/water interface in the case of the stratified regime[7]. In Figure 8 it is possible to observe a comparison between simulated and experimental images for the stratified regime of the flow of oil/water mixtures, for some of the situations depicted in Figure 7, a good fit being observed between calculated and experimental patterns.
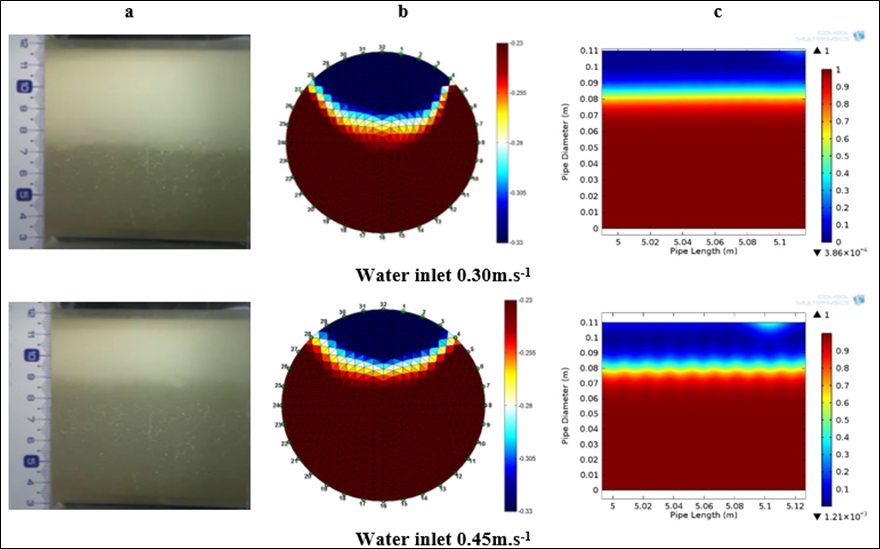
Figure 8. Images of the oil/water distribution inside the pipe for two water superficial velocities (stratified regime): a) photographs; b) EIT images; c) simulated patterns[7].
References
- Shook, C. A.; Flow of suspensions in pipelines: part II. Two mechanisms of particle suspension. The Canadian Journal of Chemical Engineering 1968, 46, 238, doi.org/10.1002/cjce.5450460405.
- R. Silva; Fernando A. P. Garcia; Pedro M. Faia; Maria G. Rasteiro; Settling Suspensions Flow Modelling: A Review. KONA Powder and Particle Journal 2015, 32, 41-56, 10.14356/kona.2015009.
- P. Doron; D. Barnea; Flow pattern maps for solid-liquid flow in pipes. International Journal of Multiphase Flow 1996, 22, 273-283, 10.1016/0301-9322(95)00071-2.
- R. Silva; P.M. Faia; Fernando Garcia; Maria G. Rasteiro; Characterization of solid–liquid settling suspensions using Electrical Impedance Tomography: A comparison between numerical, experimental and visual information. Chemical Engineering Research and Design 2016, 111, 223-242, 10.1016/j.cherd.2016.05.013.
- Oscar Mauricio Hernandez Rodriguez; Marcelo S. Castro; Interfacial-tension-force model for the wavy-stratified liquid–liquid flow pattern transition. International Journal of Multiphase Flow 2014, 58, 114-126, 10.1016/j.ijmultiphaseflow.2013.09.003.
- D. S. Santos; Pedro M. Faia; Fernando Garcia; Maria Graça Rasteiro; Experimental and Simulated Studies of Oil/Water Fully Dispersed Flow in a Horizontal Pipe. Journal of Fluids Engineering 2019, 141, 111301, 10.1115/1.4043498.
- D.S. Santos; P.M. Faia; F.A.P. Garcia; Maria G. Rasteiro; Oil/water stratified flow in a horizontal pipe: Simulated and experimental studies using EIT. Journal of Petroleum Science and Engineering 2019, 174, 1179-1193, 10.1016/j.petrol.2018.12.002.