Covid-19 transmission in US and UK have diverged 1.73 times faster than predicted by recursion models after November 2020. Transmission follows a 20% infection rate compared to the previous 10% rate, attributed to a more contagious variant of covid-19. The effect of vaccination on covid-19 trajectory is analysed for US data. Modelling indicates case numbers continue to rise for some time after vaccination.
- covid-19
- variant strains
- vaccine
- trajectory modification
- case number models
- Introduction
Covid-19 growth predictions are usually based on methods employing growth functions or differential equation solutions [1, 2, 3]. Alternative growth models using simplified logistic equations do not permit trajectory modifications at specific instances, while discrete recursive difference equations allow trajectory modulation by external functions [4, 5, 6].
Examination of covid-19 growth data for USA and UK provides some insight into the dynamics underlying growth mechanisms. Until late November 2020, recursive model predictions for covid-19 propagation show a close correlation with the actual data [7]. After that date, reported case numbers in many countries began rising faster than model predictions. Any argument suggesting that new trajectories result from more social activity and holidays is not borne out when compared across countries. A rapid divergence of case numbers from the predicted trajectory is investigated.
Vaccinations are accommodated in a recursion model by removing vaccinated subjects from background spread numbers. Inoculation rates required to reduce transmission and flatten covid-19 trajectories is considered. Cases are expected to decline slowly until the number of vaccinated individuals exceed the growth of community transmissions.
- Method
Derivation of the governing equations for limiting growth are published elsewhere [7]. The growth equation applicable to covid-19 simulation is described by;

where φ = (1+λ), ξ = -λ/V, V is the infectible target population (V=q P), q is percentage infected, P is the country population, λ < 1 and is a discretized modulating function. Equation (1) uses a discrete population count at interval T to calculate the next population value at interval (T+1). A fluctuating function modulating the difference equation may have a form . Before late November 2020, q = 0.1, while after this date q = 0.2. At each recursive iteration after discrete time T = 42 for USA (24-Nov-20) and for T = 44 for UK (8-Dec-20), P is reduced by vaccination number v according to 
- Application Examples and Discussion
Figure 1 shows US covid-19 case trajectory with a divergence occurring by 24-Nov-20 from 10% to about 20% of the population. For the latter trajectory, the new target population V = 0.2 P = 66 million, and P = 330 million. Figure 2 shows UK covid-19 case trajectory with divergence occurring at 8-Dec-20, two weeks after the US divergence commenced. UK population is P = 68 million, and 0.2 V =14 million as the new target population. Critical model values for equation (1) are listed in Table 1.
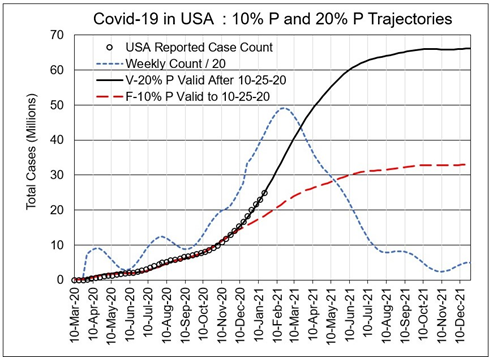
Figure 1. Recorded US covid-19 case numbers to 19-Jan-21, compared to model trajectories for 10% P and 20% P. After 24-Nov-20, trajectories diverge along the 20% P curve. Weekly moving average curve peaks at 350,000 cases/day near 10-Feb-21. Parameters for the two curves are shown in Table 1.
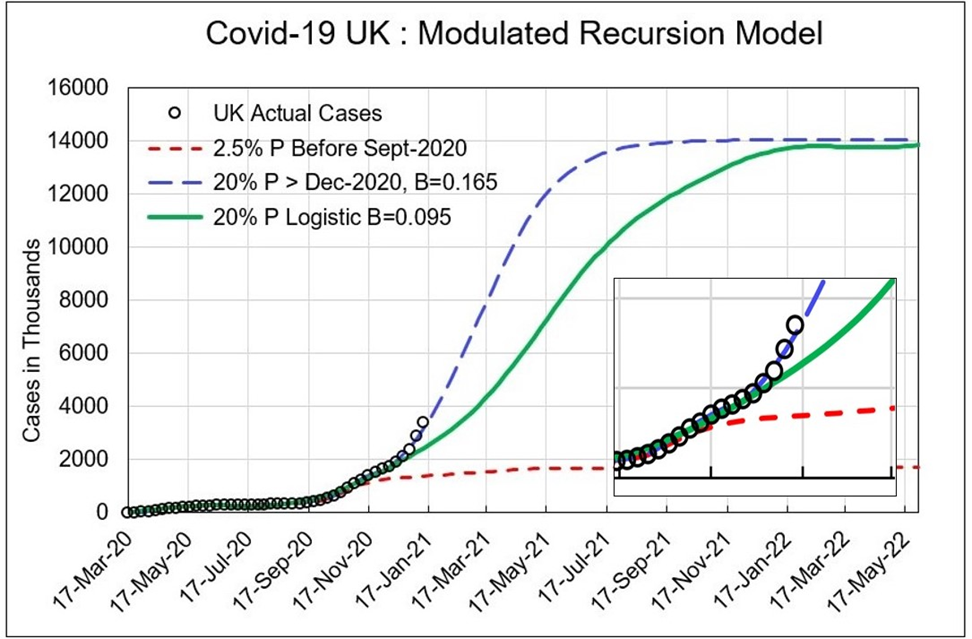
Figure 2. Recorded UK covid-19 case numbers to 19-Jan-21, compared to model trajectories for 10% P and 20% P. After 8-Dec-20, trajectories diverge along the 20% P curve. Parameters for the curves are shown in Table 1.
Table 1. Parameters for Equation (1) used in Figures 1 and 2.
|
|
V (million) |
T (at Diverge) |
N (T) (million |
λ |
Ao, Bo |
λ Ratio |
|
Figure 1 (US) |
33 |
T < 42 |
|
0.075 |
0.2, 0.04 |
|
|
|
66 |
T > 41 |
12.8 |
0.13 |
0.2, 0.04 |
1.733 |
|
Figure 2 (UK) |
6.8 |
T < 44 |
|
0.095 |
0.03, 0 |
|
|
|
14 |
T > 43 |
1.842 |
0.165 |
0.03, 0 |
1.736 |
The λ ratio for the diverged trajectory is 1.73, indicating that the infection trajectories which follow a 20% population level compared to the 10% level are 73 % more contagious. Constant is selected so that at the initialization of the simulation at T = 0, having a value in agreement with initial count data. Divergence in trajectories began in the USA about 2 weeks before detection in the UK, suggesting that the more contagious strain originated in the US.
- Effect of Vaccination on Trajectory – US Example
Equation (1) is modified to accommodate vaccination count, as discussed in the Introduction. The target V changes beyond T = 42 for USA, and beyond 44 for UK. In the US, the government planned to vaccinate 50 million subjects (100 million doses) within 3 months of 15-Dec-20, or about 4.2 million people/week. After March 2021, continued vaccinations are assumed pending supply and services. In the model, injection rates beginning in mid-December 2020 assume;
- 3 million subjects injected/week for 7 weeks, then 6 million injections/week for 5 weeks
- After mid-March 2021, 50 million subject injections may occur, with a best estimate of 4 million/week for 12 weeks.
Figure 3 shows model curves for USA with vaccination scenarios above. A 20% infected population target is used since this level existed at the end of November 2020.
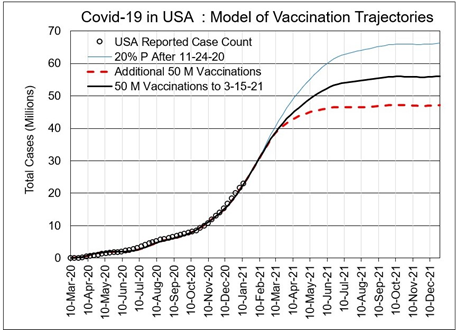
Figure 3. Vaccine-modified trajectories compared to no vaccinations for the current 20% infectible population target. Shown are the curves for the initial 100 million does (50 million subject injections requiring 2 shots). A further 50 million subject injections for another 12-week interval are possible.
- Concluding Comments
Covid-19 19 case numbers in many countries diverge from previous predictions within a few weeks of late November 2020, showing growth rates of 173% compared to the previous 9 months. New model trajectories match data when a target population of 20% is applied. Case numbers first diverged from predictions in the US during late November 2020, followed by similar divergence in the UK a few weeks later. Given that the divergence is related to a covid-19 mutation, the effects were first evident in the USA. Vaccinations are included in the model. Example data from the US show a slow reduction in case numbers by vaccination, trending towards a final case number equivalent to 15% of the population. Assumptions are that vaccines can be produced and delivered as planned.
References
- Dawed, M.Y., Koya, P.R., Goshu, A.T. Mathematical modelling of population growth: the case of logistic and von Bertalanffy models. Open J. Modelling and Simulation 2014, 2, 4.
- Verhulst, P.F. Recherches mathematiques sur la loi d’accroissement de la population. Nouv. Mem. De l’Academie Royale des Sci. et Belles-Lettre de Bruxxelle 1845, 18, 1-41.
- www.worldometers.info/coronavirus
- Levitt, M., Scaiewicz, A., Zontamed, F. Predicting the trajectory of any Covid-19 epidemic from the best straight line. medRxiv 28 June, 2020. doi: https://doi.org/10.1101/2020.06.26.20140814
- Lisena, B. Periodic solutions of logistic equations with time delay. Appl. Math. Lett 2007, 20, 1070-1074
- https://doi.org/10.1016/j.aml.2006.11.008
- Wu, K.,Darcet, D., Wang, Q., Sornett, D. Generalized logistic growth modelling of the Covid-19 outbreak in 29 provinces of China and the rest of the world medRxiv 16 Mar 2020 doi: https://doi.org/10.1101/2020.03.11.20034363
- Harrison, A. Recursion predicts Covid-19 trajectories Encyclopedia.pub 2020 https://encyclopedia.pub/3106