Tumbling mills have been widely implemented in many industrial sectors for the grinding of bulk materials. They have been used for decades in the production of fines and in the final stages of ore comminution, where optimal levels for the enrichment particles’ sizes are obtained. Even though these ubiquitous machines of relatively simple construction have been subjected to extensive studies, the industry still struggles with a very low energy efficiency of the comminution process. Moreover, obtaining an optimal size for the grinding product particles is crucial for the effectiveness of the following processes and waste production reduction. New, innovative processing methods and machines are being developed to tackle the problem; however, tumbling mills are still most commonly used in all ranges of the industry. Since heavy equipment retrofitting is the most costly approach, process optimization with dedicated models and control systems is the most preferable solution for energy consumption reduction. While the classic technological measurements in mineral processing are well adopted by the industry, nowadays research focuses on new methods of the mill’s internal dynamics analysis and control.
- Tumbling Mills
- Energy Efficiency
- Comminution productivity
- Vibration
- Sound
- Control
1. Introduction
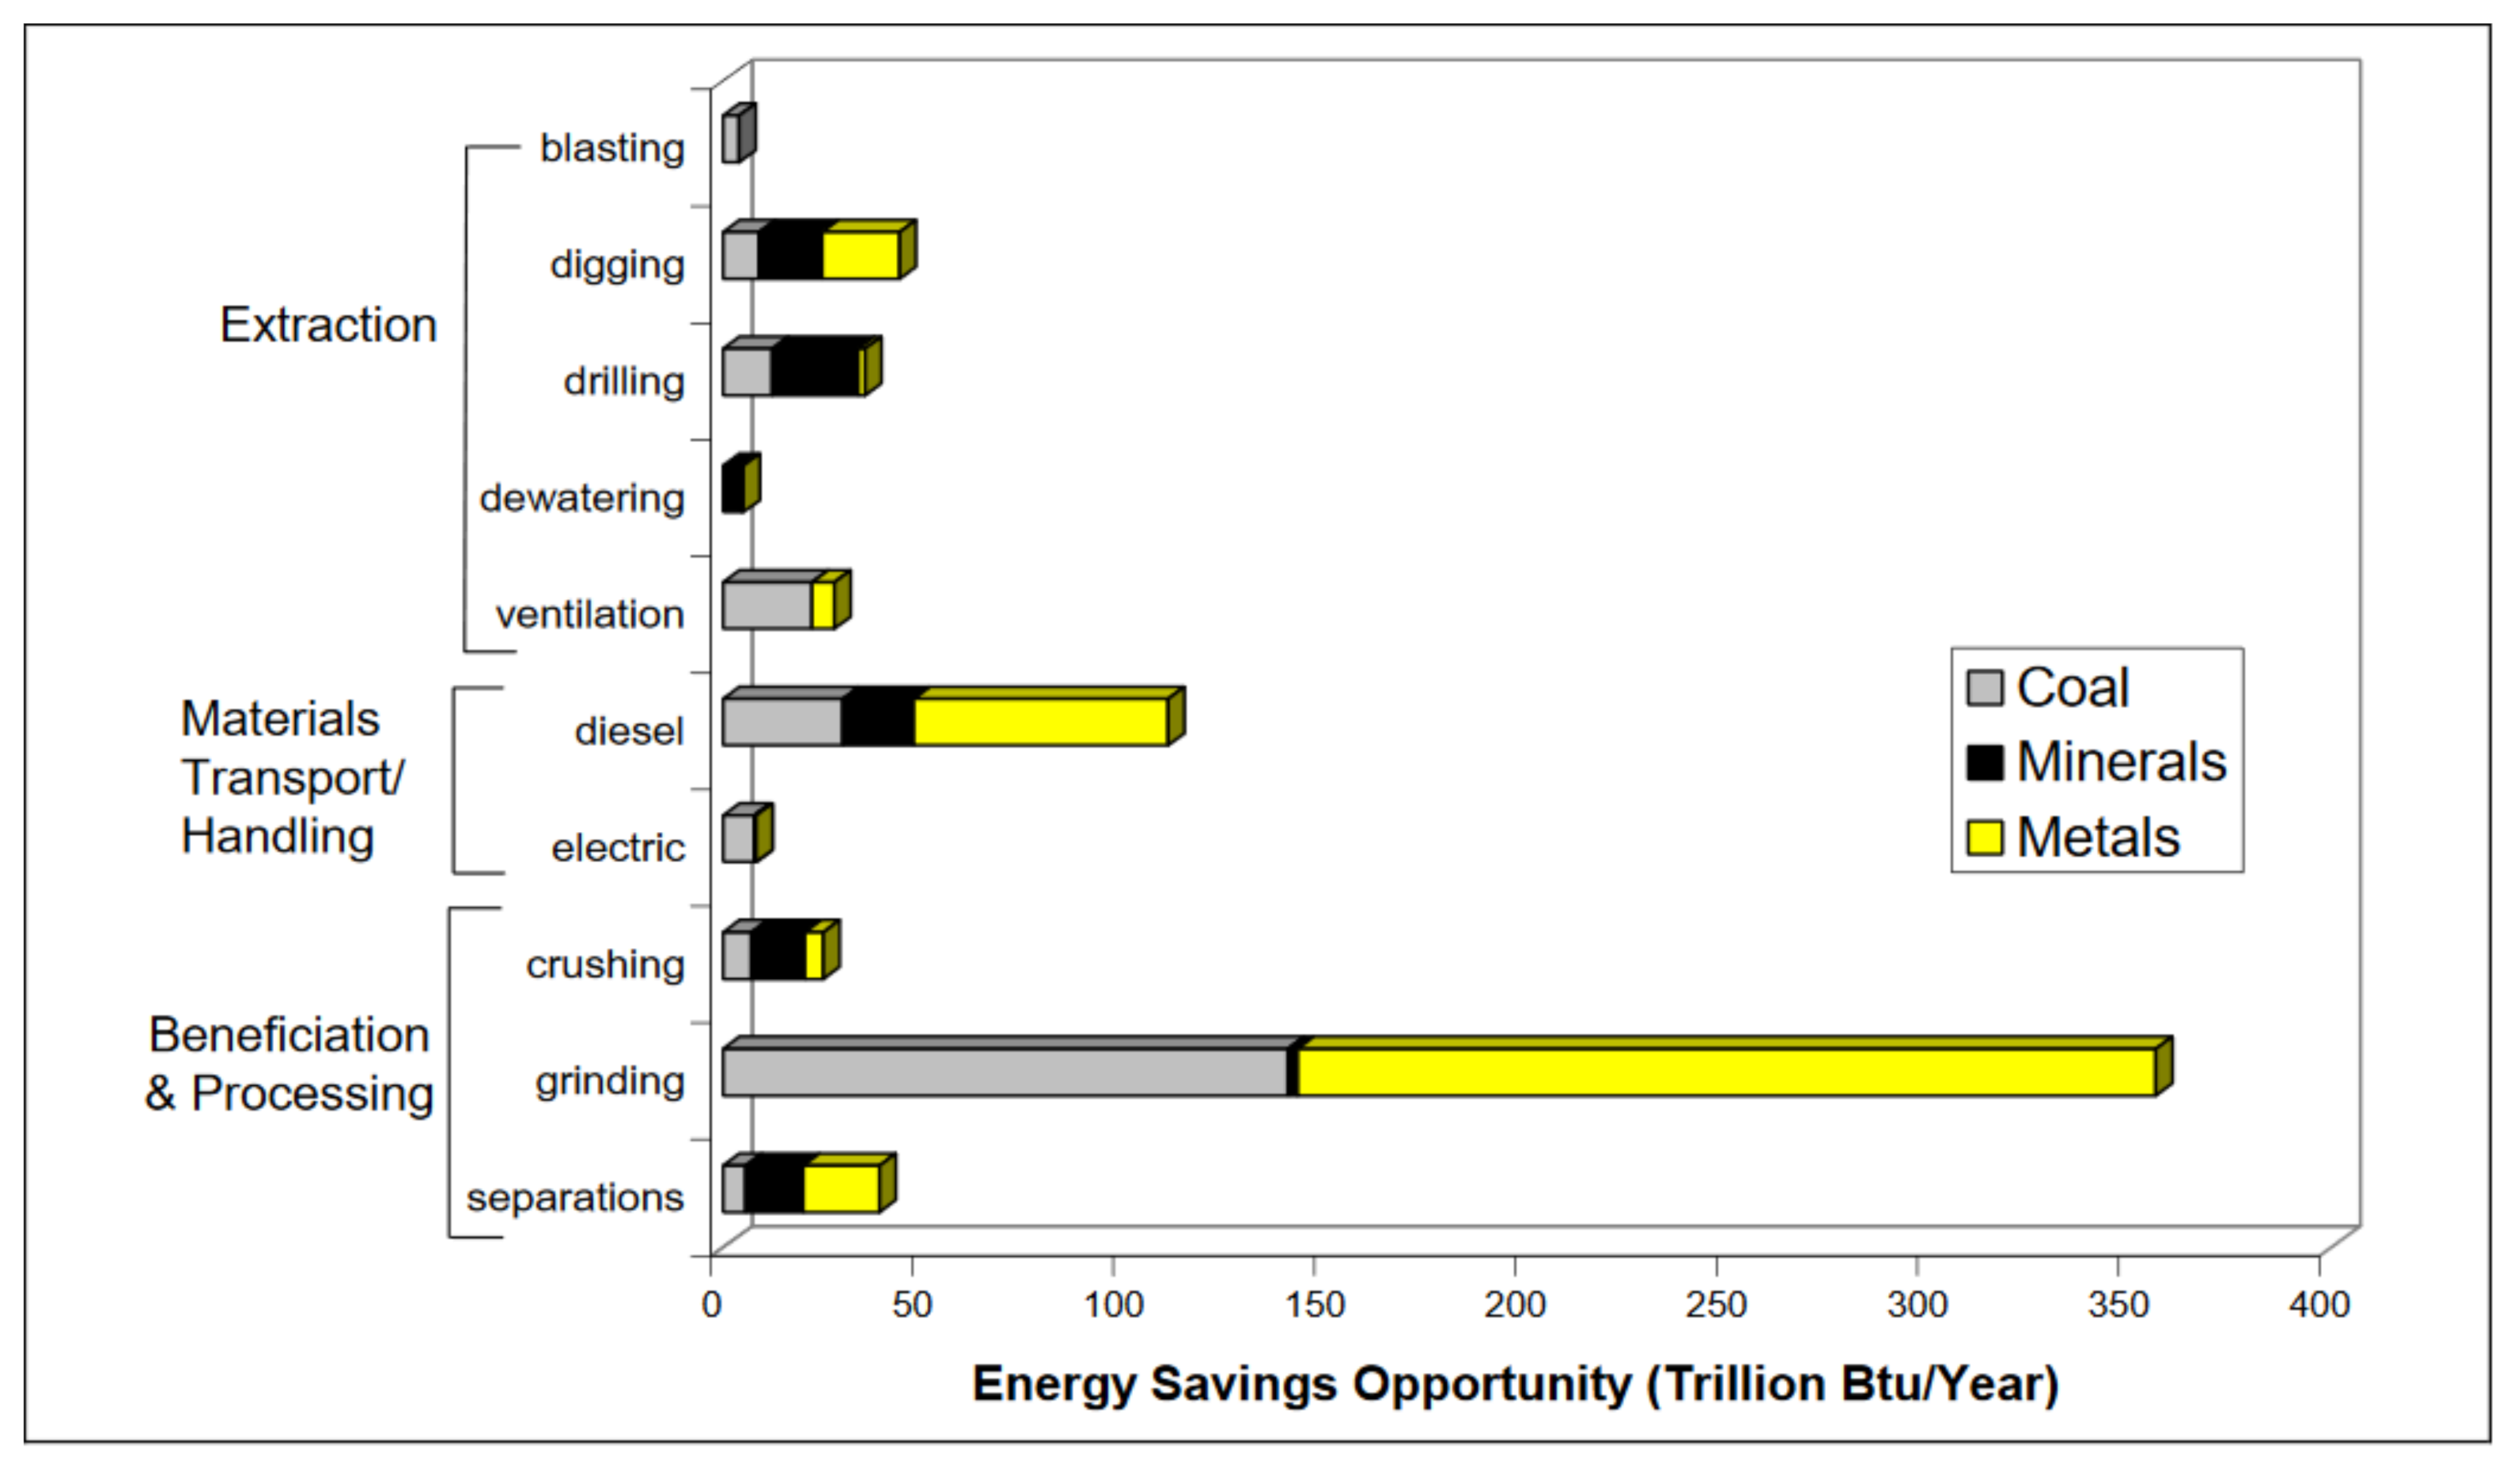
Up to 70% of the costs of materials size-reduction operations fall on the rock particle’s size reduction from 30–50 mm to 20–50 microns [1,2]. This operation is performed by the most common type of comminution equipment—ball mills. The design of ball mills was described back in the 18th century—and the principle of their operation has not changed; the only significant changes are the increased diameter and some new solutions for the mill’s drives introduced. Energy consumption in ball and rod mills reaches up to 10–20 kWh per ton of rock. According to the study prepared by the U.S. Department of Energy [3] the biggest potential for energy savings in all of the energy-intensive ore and coal mining-related operations is to be found in grinding optimization (see Figure 1). To increase efficiency, designers of mining equipment tried to improve all the elements of ball mills, such as the geared mechanical drives, bearings, their lubrication systems, and electric motors. Moreover, efforts have been made to optimize the size of the grinding bodies, control the filling level of the drum with the material, and stabilize the rotation speed. However, the main problem of dramatically low energy efficiency is still unresolved—about 30% of grinding bodies are not involved in the dynamical process—they remain in a boundary dead zone. A large portion of the impacts of grinding bodies appears on the internal liners. There are several approaches to the activated material and grinding bodies’ motion inside the mill.

First, new designs of energy-saving mills have been introduced in the market. For example, vertical (tower) Vertimill (Metso) and horizontal Isamill (Glencore Technology), which use, respectively, gravitation forces or several subsequent rotating disks inside to intensify the milling process. However, ball mills of the traditional design process the main portion of bulk materials in the world.
The next solution is the installation of so-called lifters, situated around the mill shell over the perimeter to promote higher trajectories of the balls falling down and to better mix the media treated. However, these additional elements quickly deteriorate due to the intensive wear and shock impacts on them. Hence, they may have an effect only within a short period of time after replacement.
A promising approach is to utilize the dynamic phenomena inside the mill. Namely, when the central part of bulk media moves in oscillatory (synchronous or resonance) mode against the mill shell, and the rest is a passive part of the load. This approach is more attractive from the viewpoint of implementation because it does not require any additional modernization of mechanical equipment. Only the instrumentation for signals’ measurement and processing, in combination with process parameters’ control—based on existing automation systems—is needed in such cases. However, such control needs in-depth knowledge of intra-mill load dynamics and its stages estimation by the different channels—electric motors current or power, vibration, and acoustic emission inside the equipment, or spatial sounds and mechanical torques of multi-motor drives. The realization of such an approach can only be based on advanced instrumentation—including wireless sensors, and dynamical models (both analytical and discrete elements), and signal processing techniques. These methods should account for the gradual changing of treated material properties (input variations and reduced-by-time-fractions) simultaneously with the wear of grinding balls and internal protective liners of the mill itself. Additionally, the influences of such intentionally produced oscillations on the torsional dynamics of mill drives need estimation.
This paper intends to represent a comprehensive retrospective overview of existing methods and recent trends in ball mills modeling and control aimed at increasing their energy efficiency and productivity by indirect measurements of internal dynamics with signals of different physical nature.
2. Methods of Measurements and Optimization of Tumbling Mills
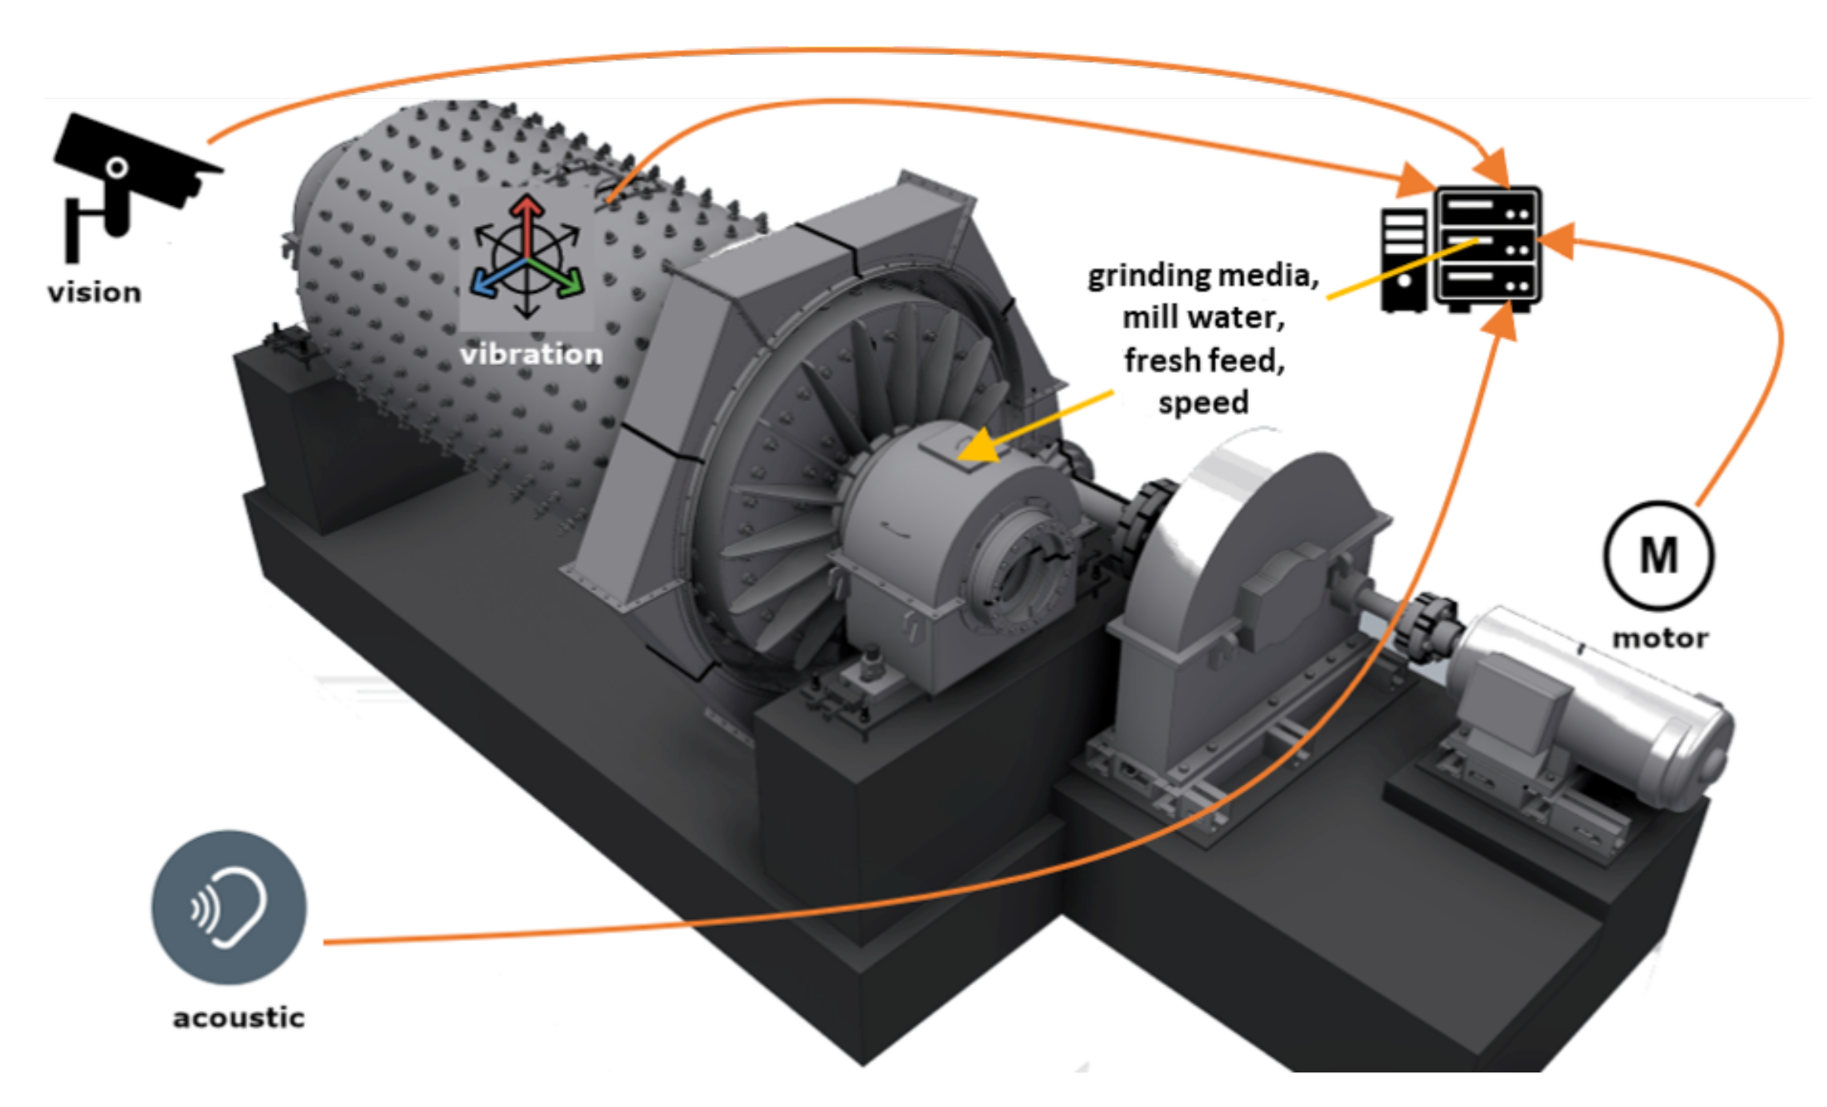
The measurements aimed at the evaluation of operating conditions and optimization of comminution. They have been classified according to the signal measured and the main criteria of optimization. The possible sources of informative data to be acquired on a tumbling mill or in its direct neighborhood, which were used by scientists and constitute an input for the process control systems used in the raw materials industry are acoustic emission in the surrounding of the mill, vibrations measured on the shell (possibly other parts of the machine), digital records of the output ore stream, current and other signals to be acquired from the motor control unit. A scheme showing the methods of measurement and the variables to be adjusted on the basis of multi-channel data acquisition is presented in Figure 2. Mill’s performance, monitored based on vision, acoustic, inertial data and motor signals can be optimized by the input of grinding media, changing of the slurry density (by adding process water), adjusting of the speed (expressed as a % of the critical speed) or increasing/decreasing of the mill’s load. All the mentioned adjustments influence the throughput and PSD of the product. Some of the crucial process parameters with their corresponding informative signals are presented in Table 3.

Table 3. Examples of milling process parameters to be assessed by the measurement of particular signals.
| Signal Measured/Process Parameters | Fill Level | Balls Wear | Liners Wear | Particle Size Distribution |
|---|---|---|---|---|
| Acoustic | ✓ | ✓ | ✓ | |
| Vibration | ✓ | ✓ | ✓ | |
| Vision | ✓ | |||
| Power draw | ✓ | ✓ | ✓ | |
| Torque | ✓ | |||
| Other signals from the electric motor | ✓ |
The majority of studies are based on vibration and acoustic emission measurements, which seem to be caused by three main reasons:
- Data acquisition methods and instrumentation for such signals are well proven in the industry;
- The price of the equipment is relatively low;
- Probably most importantly—it does not require direct contact of the sensor with the processed, highly abrasive material.
Acoustic emission technique is preferable for shock impacts sensing on the mill shell but requires wireless communication to record data. The same telemetry circuits are needed for strain gauges implementation on the rotating shafts of mechanical drives [65]. Therefore, it is important the measurement of angular backlashes in gear coupling [66] and to include in dynamical models of ball mills their drive-lines as the systems with non-linear parameters of stiffness [67].
The multi-motor drives of heavy ball mills with open couplings of the peripheral tire and pinion gears are subjected to intensive wear and excessive angular and radial clearances. The different kinds of dynamical processes occurring in the drives of ball mills are investigated in [70,71]. One of the effects occurring in such kind of drives is out-of-phase torsional vibrations in parallel lines [72] having high amplitudes, which may interfere with internal load dynamics and significantly affect mill speed control. The most difficult mode for mill drives is to start under load especially for synchronous AC motors. Control methods of soft start are implemented for such cases [73].
Although electric motor parameters are quite easy to register and use for process stability estimation in the existing automation systems of industrial plants [74], a surprisingly small number of works in the domain of ball mills is discovered. This is most likely related to the simplicity of the signal processing methods used, which are not allowing to recognize multivariate correlations in material properties in the motor current data, which is reacting only to the integral load inside the mill.
Therefore, as it follows from Table 2 and Table 3, the main efforts are undertaken in bulk media properties detection and related working conditions of the mill. Only a few studies are noted on the wear diagnostics of the grinding balls and protective liners, although this is very important for mills maintenance and balls replacement planning. Method of liners diagnostics is proposed in [69] based on analysis of infra-low frequencies (up to 0.01 Hz) of components in the active power spectrum. Another way to detect the wear of internal protective liners is to analyze self-excited torsional vibrations at the natural frequencies of the drive-line of the mill [75].
The application of the above-mentioned methods can be well described based on the MillVis system example [52]. As described in [54] the system uses vibration, acoustic, and vision measurements. Depending on the application (first or second stage grinding) it uses also other technological parameters like pulp density or average particle size. The latter is, however, accessible for mixed product streams from several mills sections and are used for global optimization purposes rather than individual mills' performance improvement.
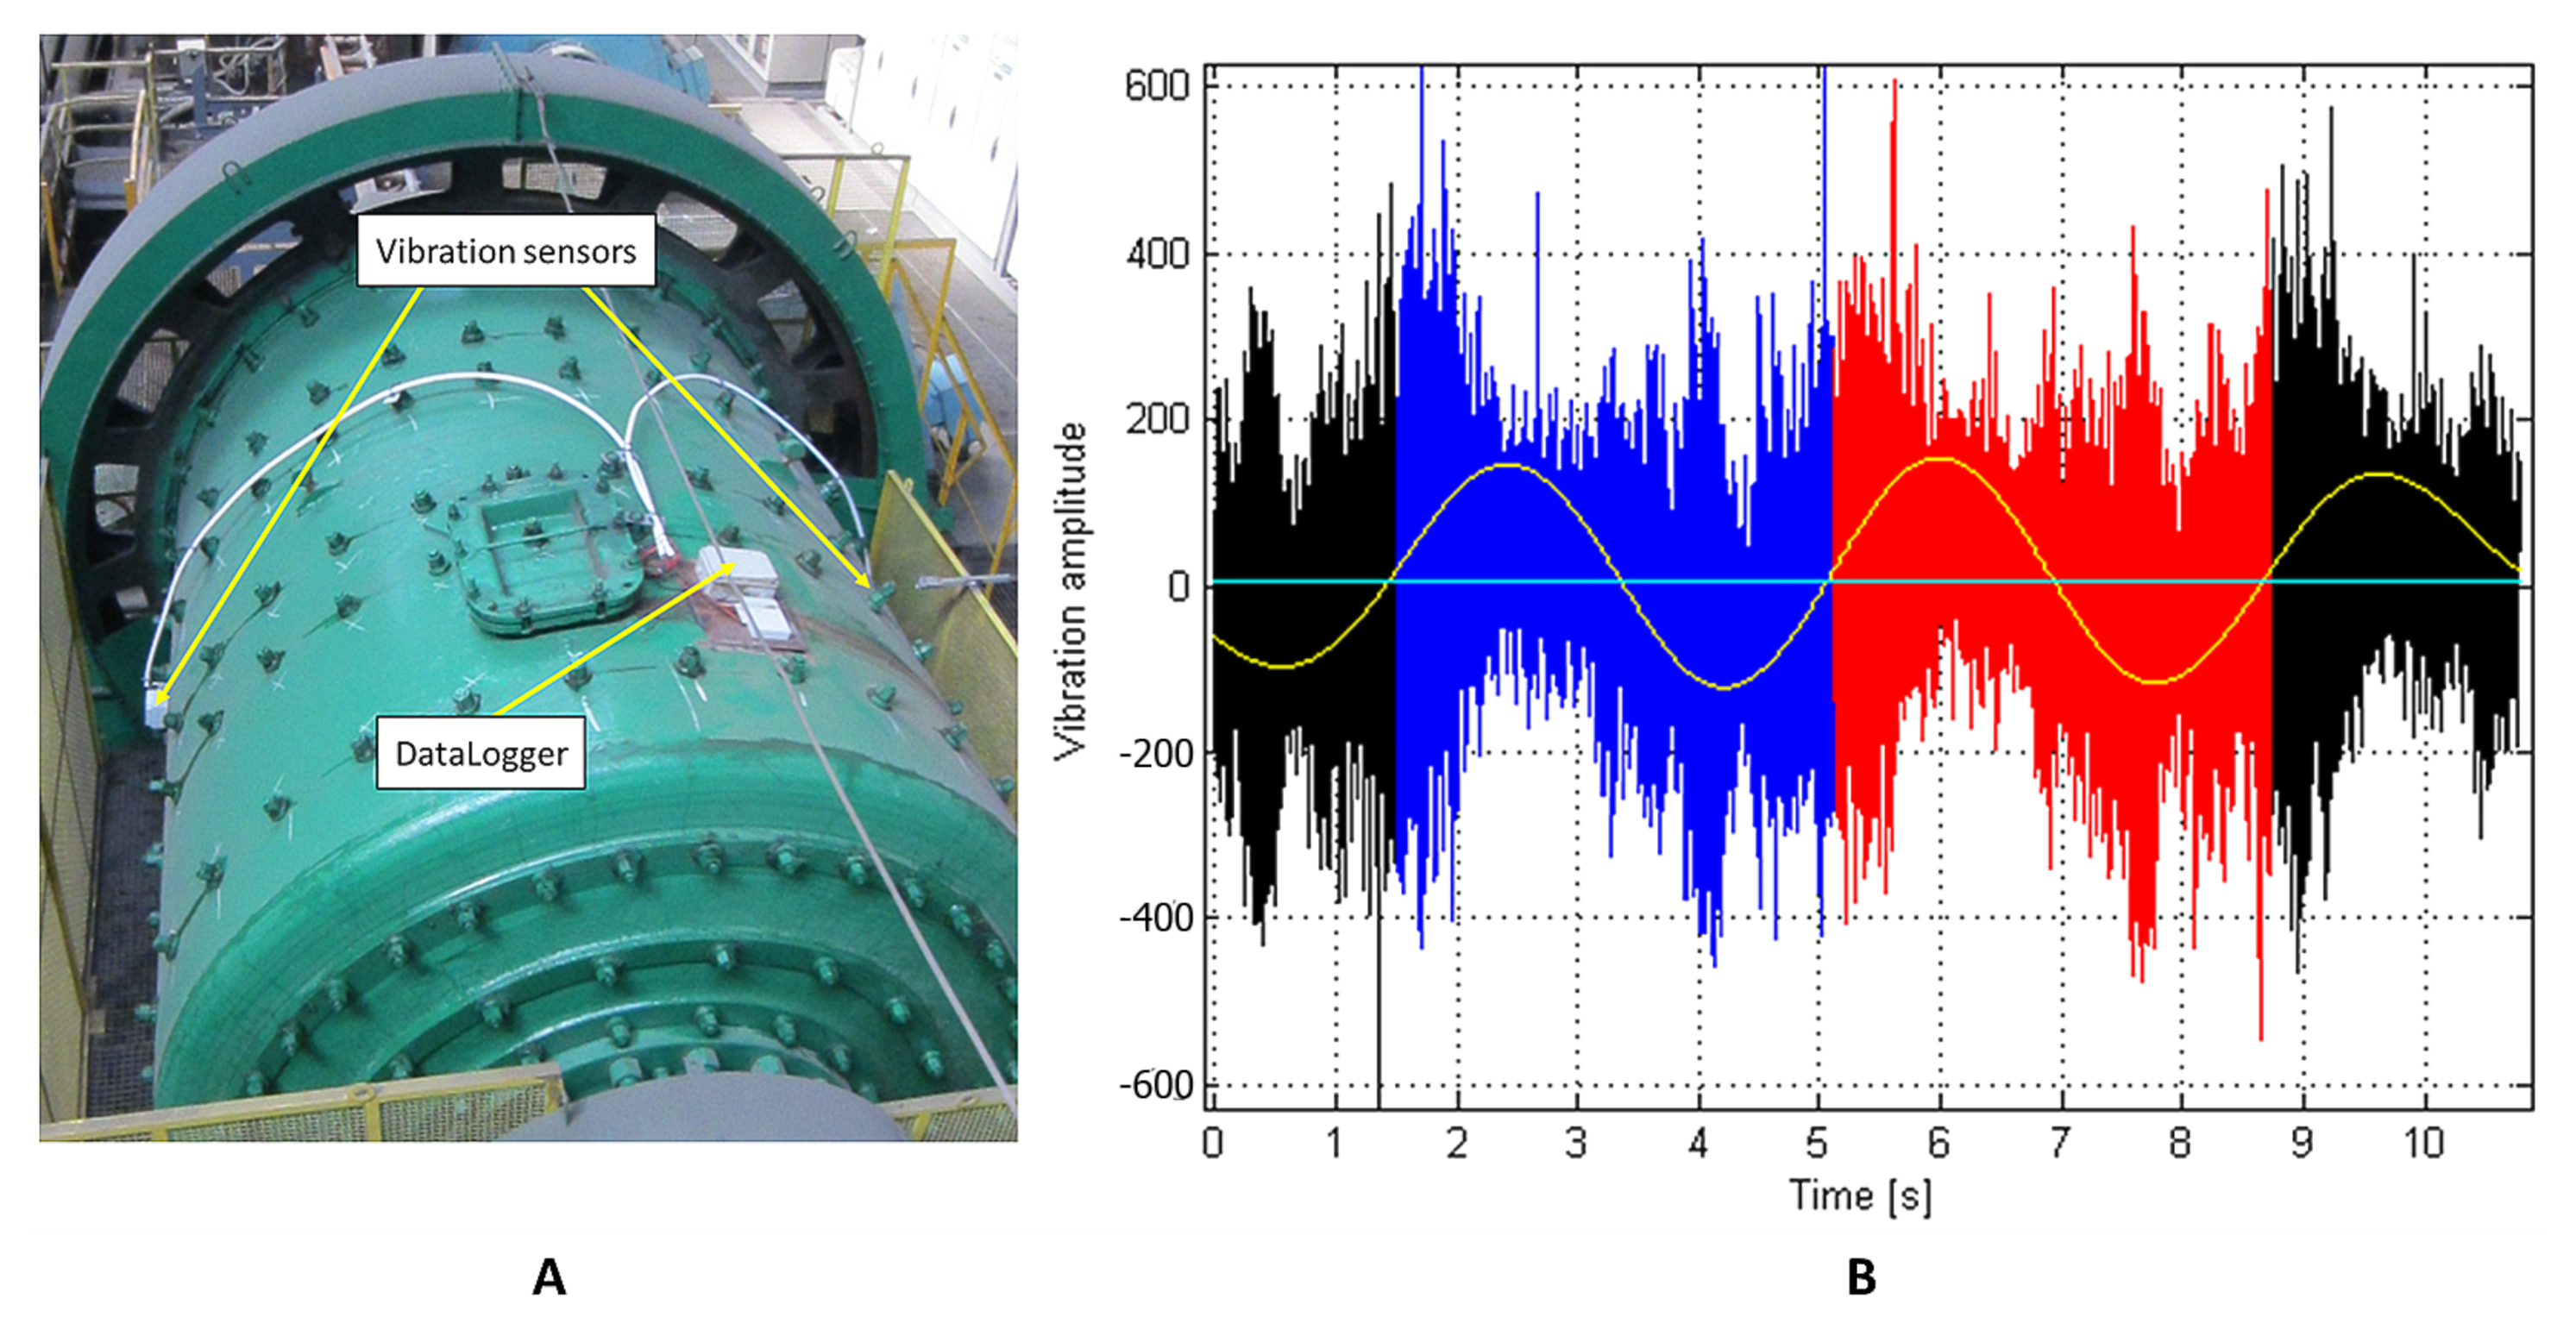
The system measures the mill’s vibrations with wireless DataLogger using accelerometers installed on the mill’s shell (see Figure 3A). Sensors and DataLogger rotate together with the mill, so wireless data transmission is required and device energy consumption optimization, since it operates using battery packages, rotating with the mill shell as well. According to the kinetics of grinding [76]—the vibration amplitude will rise while more of the kinetic energy of the grinding medium (e.g., steel balls) is transferred directly to the mill shell. The amplitude will be maximal when the balls hit the mill shell and the lowest when the balls sink in the processed material. Naturally, desired levels of the vibration amplitude will vary depending on the actual sensors' position following from the rotation of the mill. Thus, quite important is to correlate the amplitude measurements with the mill position. It is quite straightforward using the vibration signal from the individual sensor rotating together with the mill shell and low-pass filtering in the frequency domain [77].

Figure 3B shows exemplary data from two full convolutions of the mill represented by blue and red parts of the chart. Black parts represent the final stages of the previous convolution and initial stages of the following convolution. The yellow sine-wave-shaped chart is the filtration result, representing the position of one of the sensors rotating with the mill shell. Binding the angular position of the sensor with the vibration signal values allows one to perform easy-to-understand signal analysis using e.g., polar plots.
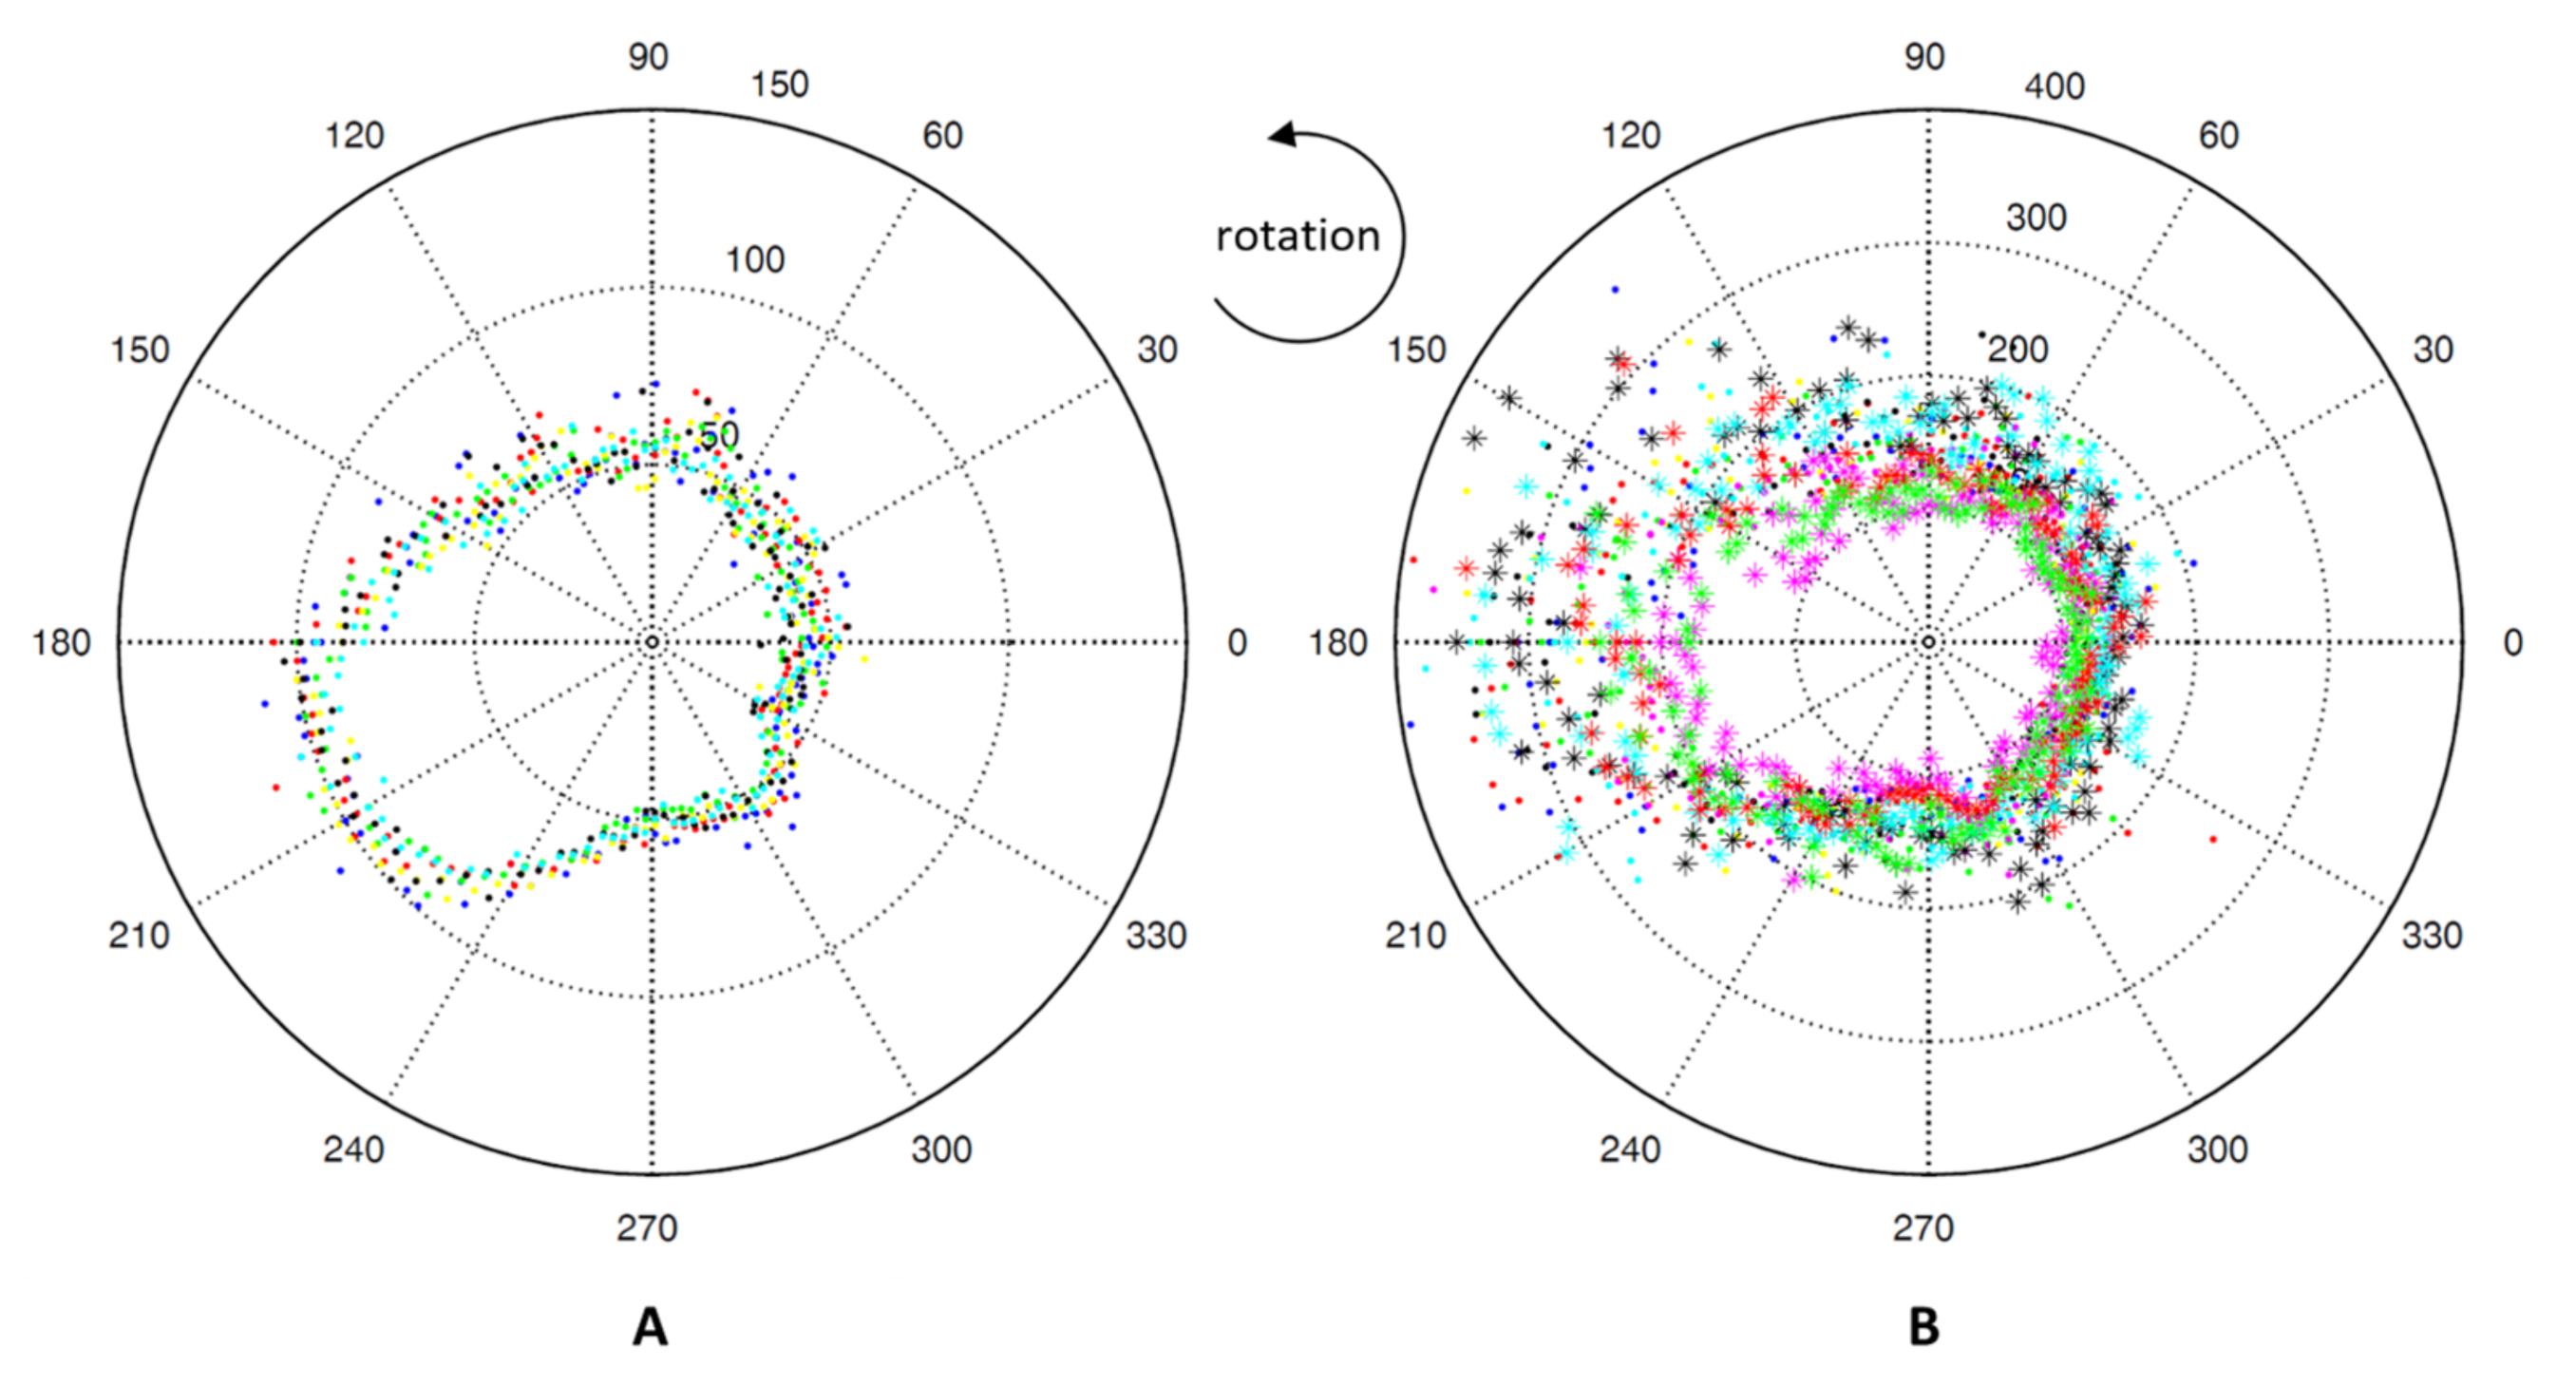
Figure 4 shows the comparison of the vibration signal for rod and ball mills. Each point on the polar plot represents the vibration amplitude (represented as a distance from the plot center) registered by the sensor in the given position during the mill rotation (represented by the angle value). One can easily observe the maximum amplitude angle changes with the process parameters variation (e.g., pulp density, throughput, grinding media charge).

The difference in the maximum amplitude angle for two compared mills is obvious and follows from different grinding media behavior inside the mill’s working chamber. The visual representation of the mill’s behavior on the polar plots is useful for the operators to determine the state of the grinding process and the technical condition of the mill itself. Constant analysis of the above-mentioned parameters allows predictive maintenance and increases machinery availability.
Vibration signal amplitude analysis is only one of the system components. Values of technological process parameters, together with vibration signals’ other parameters (e.g., dedicated indexes calculated at the frequency domain) and vision system measurements for the feed particles size distribution estimation are finally used by the dedicated software in the supervisory control layer to calculate optimal control set-points hints for the operator [78].
This entry is adapted from the peer-reviewed paper 10.3390/en13246735
