Your browser does not fully support modern features. Please upgrade for a smoother experience.
Please note this is an old version of this entry, which may differ significantly from the current revision.
Subjects:
Clinical Neurology
Musculoskeletal disorders and the following pain were common in most people’s daily life, and the musculoskeletal pain caused by musculoskeletal disorders was the second most common cause of disability. Many established factors, such as physical, biological, cognitive, behavioral, social, and occupation, were correlated with the pain following musculoskeletal disorders
- Multi-Modal Therapies for Kinesiophobia
1. Introduction
Fear was considered to be an explanation of why pain and associated outcomes such as disability persist once the body injury had healed [5,6], and the fear-avoidance model of pain was one of the frameworks which could explain the development and persistence of the pain and disability following a musculoskeletal injury [7,8]. According to this model, people with a trait tend to have fear and catastrophic thoughts in response to pain were more at risk of developing chronic musculoskeletal pain after an injury than people who did not have this tendency [6,8]. These people over-reacted in response to actual or potential threats, developing avoidance behaviors to prevent a new injury/re-injury [6]. Fear in relation to pain had been described with various conceptual definitions, among which pain-related fear, fear-avoidance beliefs, fear of movement, and kinesiophobia were the most commonly used [9].
Kinesiophobia was one of the most commonly used conceptual definitions which could describe fear in relation to pain [10]. Kinesiophobia (also known as the fear of movement) was defined as an excessive, irrational, and debilitating fear to carry out a physical movement due to a feeling of vulnerability to a painful injury or re-injury [10]. It could be acquired through a direct aversive experience such as pain and trauma or through social learning such as observation and instruction [11]. Kinesiophobia had been associated with pain, disability, and quality of daily life to some extent [12]. The prevalence of kinesiophobia in chronic pain was from 50% to 70% [13,14].
The objective of rehabilitation is to recover physical exercises’ performance, regain the capacity of daily activities, and restore social functions. In recent years, studies on the rehabilitation of musculoskeletal disorders had begun to focus on the fear in relation to pain [15,16]. The fear in relation to pain would cause people to produce fear-avoidance and had a negative effect on their quality of life. Therefore, not only the rehabilitation at the physical level but also the rehabilitation at the psychological level should be paid attention to [17,18,19,20]. At the same time, as mentioned above, kinesiophobia could be acquired through many different ways (e.g., personal experience, social learning) [11], therapies combined multi-modal from both psychological and physical perspectives had become increasingly popular [15,21,22]. However, at present, only a few studies focus on the advantage of multi-modal therapies over uni-modal therapies, and most of the studies on the rehabilitation of musculoskeletal disorders were limited to specific musculoskeletal disorders. There was a lack of high-quality evidence from the macro-perspective. To answer this question, the terms “physical therapy” and “psychological therapy” should be defined in this review at first.
In this review, the terms “physical therapy” and “psychological therapy” were defined as follows. “Physical therapy” was the therapy included: (1) exercise/training session or advice with a private plan; (2) passive physical therapies such as usual care; (3) treatments provided by professional therapists or medical staff without any psychological education. It should be emphasized that exercise/training advice without a private plan, waiting lists and interventions without any control, such as keeping normal daily life, would be excluded.
“Psychological therapy” was the therapy include (1) psychological education; (2) cognition-behavior therapy; (3) perceptive stimulation in non-injured body areas such as virtual reality equipment, laser, and relaxation; (4) therapeutic milieu involves interpersonal communication such as group session and feedback session. It should be emphasized that if the doctor-patient communication in the intervention involved only an explanation of the treatment or only guidance of exercise or only supervision in training, the intervention wouldn’t be regarded as psychological therapy.
Moreover, a quantitative indicator was required to assess the fear of movement, and there was not a specific tool to assess fear of movement directly [9]. The term “kinesiophobia” would be used. People with kinesiophobia would change their movements to avoid pain and adjust their motor behaviors [12]. The processing of pain and pain-related information in people with musculoskeletal disorders could be related to how kinesiophobia was perceived [23]. Therefore, a greater degree of kinesiophobia predicted greater levels of fear of pain and a great inclination to avoid physical movements [24].
Kinesiophobia could be measured by the Tampa Scale of Kinesiophobia (TSK) [25]. Since the Tampa Scale of Kinesiophobia had good validity in the quantization of kinesiophobia, the change of TSK scores would reflect the effect of therapy and be taken as a comparative indicator of therapy effect to some extent [26,27]. In the original version of the Tampa Scale of Kinesiophobia, participants would be asked to respond to how much they agreed with each of the 17 items, and the ratings available were: (1) disagree; (2) partially disagree; (3) partially agree; (4) strongly agree. The score of each item varies from 1–4 or 0–3. The responses were summed, and the generated score, which ranges from 17 to 68 or from 0 to 51 [13,25]. However, the TSK scores were usually reported as a secondary outcome, and that there was a limited number of studies that focus on the treatments for kinesiophobia. It made that a special study search strategy, information extraction, and data processing methods need to be applied.
2. Systematic Review of Related Studies
2.1. Study Selection, Information, and Original Data
In the database PubMed, by the search term “(kinesiophobia[Title/Abstract]) AND ((randomized) or (randomised)[Title/Abstract]) NOT ((design) or (protocol)[Title])”, and the limitation of “randomized controlled trials”, 55 studies had been screened out. In the database Medline (EBSCO), by the search term “AB kinesiophobia and AB (randomized or randomised) NOT TI (design or protocol)”, and the range of “Cochrane Central Register of Trials, Medline with Full Text, and CINAHL”, 507 studies had been screened out. In the database Ovid, by the search term “(kinesiophobia and (randomized or randomised) .ab not (design or protocol) .at” typed in the tool “Multi-Field Search”, and the limitation of English, 480 studies had been screened out. All the results would be downloaded and imported into EndNote X9 for further screening.
After deduplication and applying the exclusion criteria, 12 studies [32,33,34,35,36,37,38,39,40,41,42,43] of the total 1042 studies were included for analysis. The flow diagram could be seen in Figure 1. Based on the information of all the full texts included, the result of data collection and a summary measure of each included study could be seen in Table 1 and Table 2.
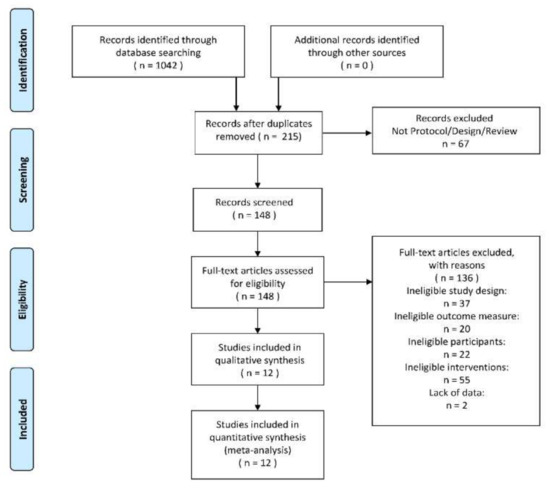
Figure 1. The PRISMA 2009 flow diagram of search and study selection.
Table 1. The result of data collection.

Table 2. The converted scores of TSK by the form of MEAN (SD).

2.2. Risk of Bias
The result of the criteria for judging the risk of bias in the “Risk of bias assessment tool” would be shown in Figure 2a,b. A funnel plot of the included studies, as in Figure 2c, illustrated the risk of bias across studies and showed the relationship between the sample size and the effect. And the result of the assessment of evidence quality, which was made by following the GRADE, would be put into the Supplementary File (Figure S1).
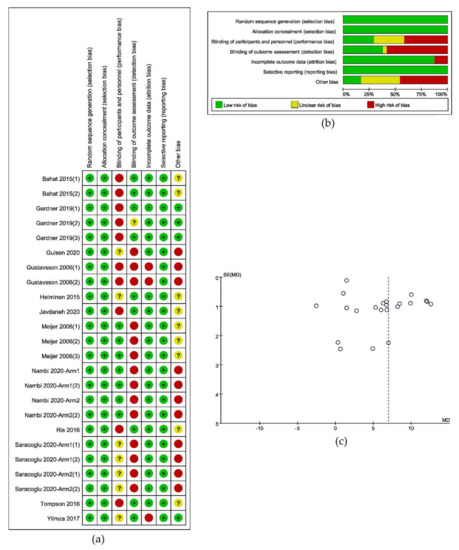
Figure 2. Results of risk of bias analysis: (a) Risk of bias summary; (b) Graph of risk of bias; (c) Funnel plot of included studies.
2.3. Data Extraction and Management
In the comparison of multi-modal interventions and uni-modal interventions with the scores of TSK as the outcome, all the 12 included studies were divided into 24 independent trials. The result of original data processing was shown in Table 3, and the forest plots of the pooled effect, which were calculated by RevMan5.3, were shown in Figure 3.
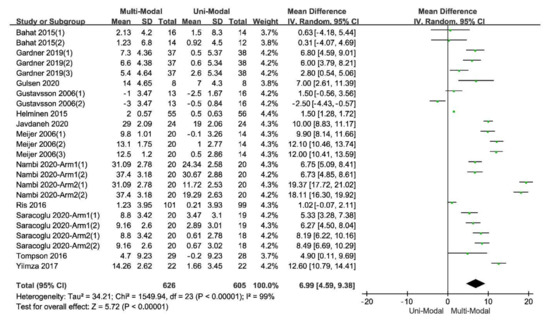
Figure 3. The forest plot of the comparison between the multi-modal therapies and uni-modal therapies.
Table 3. The result of original data processing.

The Q statistic of the meta-analysis of all included studies (equal to Chi2), T2, I2 and their 95% confidence intervals and prediction intervals of the comparisons’ effect could be seen in Table 4.
Table 4. The result of heterogeneity test of all included studies.

2.4. Additional Analysis
2.4.1. Subgroup Analysis
The calculation of subgroup analysis was based on the randomized effect model by RevMan5.3. According to the result of the subgroup analysis, there was a large heterogeneity within studies in subgroup analysis since the I2 of each subgroup analysis was large, meaning that the different subgroups may not be the sources of the heterogeneity within the included studies, and it was necessary to do a meta-regression.
According to the characteristics of participants and design of the included studies which might affect the effectiveness of therapies, there were five subdivisions in the subgroup analysis: (1) different types of pain, which included chronic low-back pain, chronic neck pain, and non-special low-back pain; (2) different ranges of participants’ mean age which included 20 to 30, 30 to 40, and more than 40 years old; (3) different durations of treatments which included 0 to 3 weeks, 4 to 6 weeks, 7 to 9 weeks and more than 9 weeks; (4) different follow-up times which included 0 to 12 weeks, 13 to 24 weeks and more than 24 weeks; (5) different types of uni-modal interventions in control groups, which include passive physical therapy, active exercise, and only psychological education (following the hypothesis that there were different effects between passive physical therapies, active exercise, and psychological-only interventions). The indexes of heterogeneity and their 95% confidence intervals were shown in Table 5, and all the forest plots of the subdivisions would be shown in Figure 4.
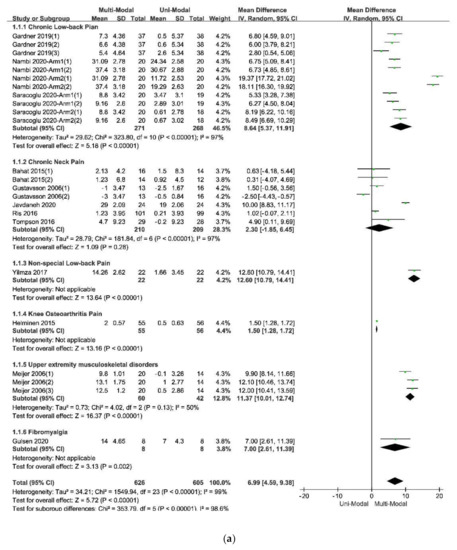
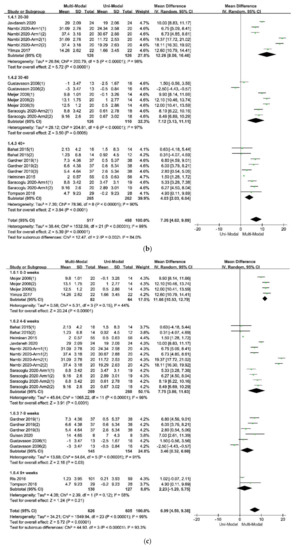
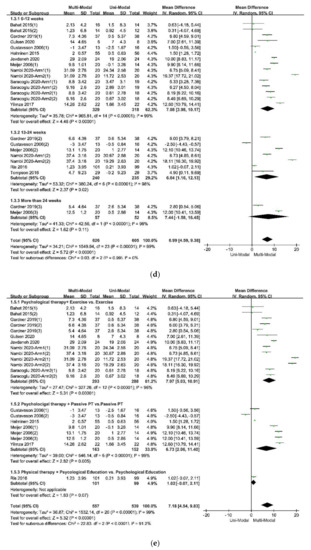
Figure 4. The forest plot of the subgroup analysis: (a) The subdivisions of different types of pain; (b) The subdivisions of different ranges of participants’ mean age; (c) The subdivisions of different durations of treatments; (d) The subdivisions of different follow-up times; (e) The subdivisions of different types of physical therapy in control groups.
Table 5. The result of heterogeneity test of subgroup analysis.

2.4.2. Meta-Regression
The large heterogeneity within the included studies made it necessary to do a meta-regression. The meta-regression made using STATA® 12 (StataCorp LLC, College Station, TX, USA), and the results can be seen in Figure 5 and Table 6.
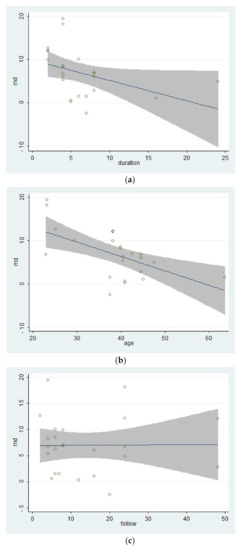
Figure 5. The bubble chats of the results of the three covariates in the meta-regression: (a) The duration of treatments; (b) Mean age of participants; (c) Follow-up times.
Table 6. Meta-regression result: The follow-up times and the SMD of effect.

The result of the meta-regression calculation for the covariate “follow-up times” showed that the proportion of the residual variation due to heterogeneity, which could be represented by the statistic “I-squared_res”, was 99.58%. It meant that only 0.42% of the residual variation could be explained by between-study variance. And the result of the meta-regression calculation of the covariate “mean age of participants” showed that the proportion of the residual variation due to heterogeneity, which could be represented by the statistic “I2residual” (I-squared_res), was 96.11%. It meant that only 3.89% of the residual variation could be explained by between-study variance. The proportion of the heterogeneity could be explained by between-study variance, which could be represented by the statistic “adjusted R2” (Adj R-squared), which was 33.10%. The result of the meta-regression calculation of the covariate “duration of treatments” showed that the proportion of the residual variation due to heterogeneity, which could be represented by the statistic “I2residual” (I-squared_res), was 98.38%. It meant that only 1.62% of the residual variation could be explained by between-study variance. The proportion of the heterogeneity could be explained by between-study variance, which could be represented by the statistic “adjusted R2” (Adj R-squared), which was 14.46%. Lastly, the result of the Monte Carlo Permutation Test for Single Covariate of Meta-regression, the adjusted p-value changed from 0.139 to 0.008 to 1000 within the covariate “duration of treatments”, “mean age of participants”, and “follow-up times”, indicating that there might not be the type I error existing within the included studies. The bubble chats of the results of the three covariates in the meta-regression.
2.4.3. Statistical Power
According to the result shown in Table 7, the meta-analysis’s statistical power was higher than any included study. Moreover, the statistical power of the heterogeneity analysis was less than that of the pooled effect because of the interactions between the covariables. The result was consistent with the previous hypothesis.
Table 7. The result of statistical power test of all included studies and meta-analysis.

3. Discussion
In this review, the fear-avoidance model of pain was used to explain the fear of physical movement following musculoskeletal disorders, and the clinic term “Kinesiophobia” was used to define and describe fear in relation to pain. Kinesiophobia could be acquired through personal experience or social learning and could be measured by the Tampa Scale of Kinesiophobia (TSK). Studies used the scores of TSK-17 as one of the outcomes and compared therapies combined multi-modal from both psychological and physical perspectives with therapies in uni-modal were included in this review to summarize the evidence that might support the application of multi-modal therapies for musculoskeletal disorders and the following pain.
Although a considerable heterogeneity within the included studies, the pooled effect was positive with a statistical significance, indicating that multi-modal therapies had an advantage over uni-modal therapies. High-quality evidence reported that a long-lasting multi-modal program was superior to the exercise program in reducing disability, fear-avoidance beliefs and pain, and enhancing the quality of life of patients with different kinds of pain [15]. The effects were clinically tangible and lasted for at least one year after the intervention ended [15,20,22].
The results of the subgroup analysis in the subdivision of different types of pain, which was showed in Figure 4a indicated that the multi-modal therapies were more used in the treatments for chronic pain in the people’s trunk, especially in the neck and low back. This result was consistent with the previous fear-avoidance model about the fear of pain, which was that the experience of chronic, ongoing pain tends to become fear of pain [6,8]. What’s more, multi-modal therapies combined with physical therapies and psychological therapies had an advantage over therapies from a physical perspective, no matter the physical therapy was passive or active, as was showed in Figure 4e. Therefore, it was necessary to add psychological therapies in the treatments of chronic pain. A similar effect was found in studies that compared passive and active treatments for neck-shoulder pain and used the Visual Pain Scale (VAS) as an outcome measure [44]. Simultaneously, the age of participants, the duration of treatments, and the different follow-up times might affect the results. Within these factors, the participants’ age was more likely to be taken into consideration since the pooled effects showed a decreasing trend with the increase of age in Figure 4b. According to the previous study results, older people were more often had a pain of longer duration, more frequently and of more complexity, felt more disabled, received more pain treatments and had more health problems, and often used passive coping for pain [45]. The influence of different durations of treatments seemed unclear, as was in Figure 4c. Perhaps there were few studies comparing different durations of treatments for pain or kinesiophobia, and each treatment protocol had a different optimal duration. It might result in low homogeneity among studies and poor goodness of fit of regression equations, as shown in Table 6. At last, the pooled effects at different follow-up times seemed stale, as was in Figure 4d, indicating that the effects of multi-modal therapies might clinically tangible and lasted for a long time [15,46].
According to the meta-regression results, the covariate “follow-up times” might not be the source of the heterogeneity because that different follow-up times of included studies could hardly explain the residual variation due to between-study variance [29]. On the contrary, the differences of mean age of participants and the duration of treatments could explain part of the between-study variance, meaning that the two covariates might be part of the sources of the heterogeneity and would affect the effects of therapies. What’s more, the meta-regression of the mean age of participants had a significant statistical difference, showing that the effect of multi-modal therapies might decrease with age. This result might be related to the mental health and capacity of recovery of older adults [47,48]. Besides, the result of the meta-regression of the duration of treatments tended to be statistically significant. It indicated that there might be no additional benefit from increasing the duration of therapy for kinesiophobia. Finally, the goodness of fit of the model used in the meta-regression for these covariates was low, indicating that the results should be interpreted carefully.
A considerable heterogeneity within the included studies could be seen in the heterogeneity test in the meta-analysis and the subgroup analysis. The heterogeneity might come from the different designs of these studies. For example, the included studies had differences in the FITT characteristics (frequency, intensity, time, environments, and types) of the training plan [49,50]. Moreover, the different populations of the participants, the different blinding method, and some other factors, especially the different validities and reliability of the Tampa Scale of Kinesiophobia for participants with different educational backgrounds, culture, personalities, and types of musculoskeletal disorders [26,27,51], might lead a heterogeneity within studies.
This review had some limitations. Firstly, few studies reported the detailed pain duration of the participants or discussed the different effects between gender, leading it infeasible to make subgroup analysis or meta-regression for these covariates. Secondly, the statistical part of some studies did not consider the test-retest reliability of the Tampa Scale of Kinesiophobia, setting the test-retest reliability as 1.00 in their analysis of variance, which was impossible in a subjective questionnaire, so that the accuracy of their results was affected. Thirdly, in the search strategy, there might be an absence of data because the scores of the Tampa Scale of Kinesiophobia are usually reported as the secondary outcome. Finally, some studies didn’t use the Tampa Scale of Kinesiophobia to measure the fear of physical movements.
The risk of bias was supposed to exist, and the source is various. For example, there were many musculoskeletal disorders that could lead to a fear of physical movements. Still, not all studies in the field of physical rehabilitation reported the score of the Tampa Scale of Kinesiophobia. In fact, to all kinds of musculoskeletal disorders with the following pain, the fear of physical movements was very common [1]. What’s more, different shortened versions of the Tampa Scale of Kinesiophobia, such as TSK-13 and TSK-11, were used in other studies [52,53], making these studies could not be included in the review. Lastly, other resources of publication bias could not be excluded [54,55,56,57].
The statistical power of all pooled effect analysis in this review was larger than that in any single primary study, subgroup analysis, and the heterogeneity test. This result accords with the statistical law of meta-analysis [29].
This entry is adapted from the peer-reviewed paper 10.3390/ijerph17249439
This entry is offline, you can click here to edit this entry!