This entry presents B-mode and color Doppler imaging of the prostate and testes in dogs suffering from benign prostate hyperplasia (BPH), and receiving deslorelin acetate (SuprelorinTM) or osaterone acetate (YpozaneTM). The study was planned as a controlled clinical trial, dogs were divided into negative control (healthy dogs, n = 10), positive control (dogs with BPH, n = 10), and study groups, III (n = 15), receiving deslorelin acetate (DA), and IV (n = 10), receiving osaterone acetate (OA). The B-mode appearance of the prostate parenchyma improved in all investigated dogs from the DA group, and in 60% of OA dogs.
- dog
- prostate
- benign prostatic hyperplasia
- ultrasonography
1. Introduction
Imaging is a very accurate tool for the identification of disease in patients suspected of reproductive tract disorders. B-mode ultrasonography allows for a detailed assessment of the inner structure, whereas Doppler ultrasonography accurately characterizes the nature of blood flow and organ vasculature. In dogs, the prostate is a bilobed gland, located astride the prostatic urethra and surrounded by a capsule [1]. Its size varies significantly between individuals, and often increases with age in non-castrated dogs. The first clinical manifestation of prostatic disease, apart from the gland enlargement, are the changes to echogenicity and heterogeneity of the gland parenchyma. Ultrasonography of the testes allows for the detection of palpable and non-palpable changes, or differentiating testicular from epididymal and scrotal diseases [1]. Although for a definitive diagnosis of prostate pathology transabdominal prostatic biopsy is the gold standard, a typical ultrasonographic picture, together with the clinical findings, are usually enough for a presumptive diagnosis, and in some cases suitable treatment [2]. More recently, Doppler ultrasonography has been utilized for providing useful data on blood flow patterns and velocity in relation to prostate gland status, or the association between testicular flow patterns and semen quality [3][4]. In human medicine color Doppler ultrasound is used to assess blood flow in prostatic and testicular arteries, helping in diagnosing prostate and testicular pathologies, and in predicting the level of spermatogenesis [5]. Doppler evaluation of dog reproductive organs has recently been performed, providing useful information about blood flow and velocity, and their relation to semen quality [3][6].
In dogs, one of the most common prostate diseases is benign prostate hyperplasia (BPH). It is a testosterone dependent, non-cancerous prostate enlargement. Androgenic stimulation causes the prostatic cells to proliferate (hyperplasia) and increase in size (hypertrophy). The condition may remain unnoticed for long periods of time before the marked enlargement of the gland leads to the symptomatic stage. The severity of clinical signs are individually dependent, and dogs are usually presented with sero- to sanguineous preputial discharge independent of urination, hematuria, ribbon-like stools, and constipation [7][8]. In dogs with BPH, pharmacological therapy should be considered, especially in valuable studs, where preserving fertility is crucial. Besides human medications such as 5-alfa-reductase inhibitors (finasteride), androgen receptor blockers (flutamide), progestogens, estrogens or antiestrogens, the only medication registered for BPH treatment in dogs is osaterone acetate (OA, YpozaneTM, Virbac) [9]. It contains a steroidal androgen which treats BPH by reducing the uptake of androgens in the prostatic tissue and inhibiting the action of 5a-reductase [10]. However, another drug has recently been proposed to alleviate BPH symptoms in dogs; the GnRH agonist, deslorelin acetate (DA, SuprelorinTM, Virbac). It is a GnRH superagonist, which after the initial flare-up leads to desensitization of the pituitary receptors responsible for gonadothropin release, and a significant decline in LH and FSH, which in turn reduces androgens production [11]. The clinical outcome is very similar to the effect seen with surgical castration. DA markedly reduces the prostate size, but it also affects libido and sperm production. Both medications effectively alleviate clinical symptoms related to prostate enlargement, however the available literature provides only limited data concerning the ultrasonographic changes in the prostate and testes of dogs with BPH and receiving both drugs [12][13][14][15].
Although OA and DA have been used in dogs for some time now, there has been no publications on how these drugs affect the echogenicity and blood flow during long-term use. Both medications have a completely different mode of action, OA being antiandrogen and not interfering with fertility, whereas DA contributes to the quiescence of the hypothalamic–pituitary–gonadal axis. Ultrasonographic monitoring would provide detailed information on the onset and length of action, efficacy, and potential drawbacks of each medication.
2. Prostate B-Mode Appearance
The prostate parenchyma in healthy dogs (Group I) was moderately and uniformly normoechoic, with medium to fine texture. The urethra was imaged in the center of the prostate, as a hypo- to anechoic structure, with a narrow margin of the hyperechoic tissue (Figure 1A–B). During the whole study, the follow-up examinations revealed no changes to the prostatic appearance. The prostate gland in dogs from Group II (dogs with BPH) appeared as uniformly enlarged, and heterogenous with mostly coarse parenchymal texture, scattered hyperechoic foci, focal, less than 1 cm diameter, hypoechoic lesions (90%), or focal calcifications (10%) (Figure 1C–E). The initial appearance did not change throughout the study. Initially, a similar image of the prostate was noted in dogs from study Group III and IV (Figure 1C–E). Moreover, in all the investigated dogs the prostate gland was still symmetrical, with margins well differentiated from the surrounding tissues, and the inguinal lymph nodes were of normal size and presentation. In Group III from W8 onwards we observed some improvement in the heterogeneous appearance of the prostate parenchyma. In W16 decreased echo texture was noted in 93% of dogs, the gland became less coarse in 80% of patients, and more homogeneous in all investigated dogs (100% of patients), parenchymal cysts were not visible from W16. Whereas, in Group IV the echogenicity started to decrease as early as from D14 in 40% of the investigated dogs. Similarly, the image of parenchyma became more homogenous starting from D14, but this was noted only in 60% of the investigated dogs. The focal hypoechoic lesions disappeared in 60% of the dogs in W8 or W12 (Table 1, Figures 2 and 3).
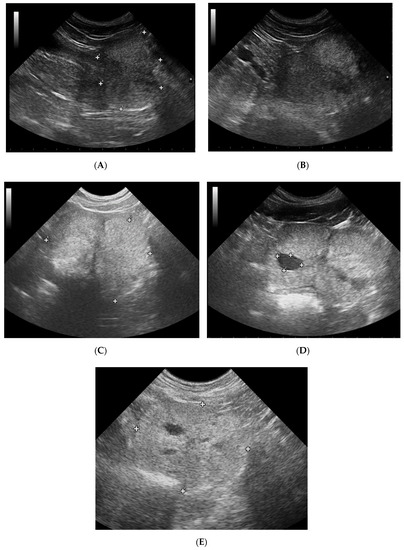
Figure 1. B-mode imaging of a normal prostate, and the most common appearance in dogs suffering from BPH. (A)—normal prostate in transverse view, the thin echogenic capsular margins are indicated (+); (B)—normal prostate in sagittal view; (C)—Benign prostatic hyperplasia, prostate gland in sagittal view, hyperechoic parenchyma and mild enlargement; (D)—BPH: large cyst; (E)—BPH: small anechoic cysts in parenchyma.
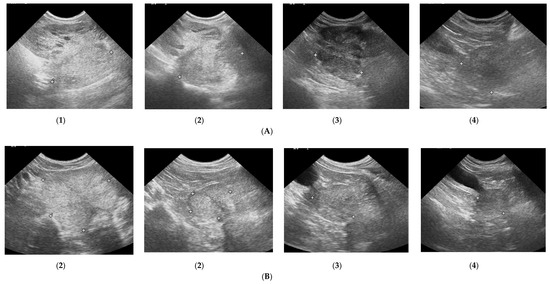
Figure 2. Changes in B-mode prostate imaging in dogs receiving deslorelin acetate, visible gradual involution of multiple cysts, and changes in echogenicity of the prostatic parenchyma. Letters (A) and (B) correspond to a single patient in the following examinations on days: (1)—day 0; (2)—week 8; (3)—week 16, and (4)—week 24. (A)—dog with large and multiple parenchymal cysts (>10 mm), sagittal view, right lobe indicated in pictures; (B)—dog with small and multiple parenchymal cysts (<10 mm), transverse view, the prostate gland indicated in pictures.
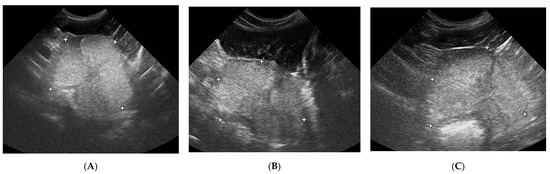
Figure 3. The B-mode prostate imaging in a dog receiving osaterone acetate, on days: (1)—day 0; (2)—week 8; (3)—week 16; transverse view, the prostate gland is indicated in pictures.
Table 1. Subjective assessment (0%—none; 100%—present in the entire image) of prostate gland parenchyma in B-mode imaging after Russo [14], in Control Groups I and II, and Study Groups III and IV during 24 weeks of observation.
N – normal, H+ – hyperechoic, H- – hypoechoic; R – regular, I – increased, C – coarse; HO – homogenous, HE – heterogenous; CY – cysts, M – mineralized opacities, fHY – focal hypoechoic lesions
|
|
Experimental Group III – deslorelin acetate |
Experimental Group IV – osaterone acetate |
||||||||||||||||||||
|
|
Background echotexture |
Parenchymal stippling |
General apperance |
Focal changes |
Background echotexture |
Parenchymal stippling |
General apperance |
Focal changes |
||||||||||||||
|
|
N |
HI |
HY |
R |
C |
I |
HO |
HE |
CY |
M |
fHY |
N |
HI |
HY |
R |
C |
I |
HO |
HE |
CY |
M |
fHY |
|
D0 |
0 |
100% |
0 |
7% |
93% |
0 |
0 |
100% |
100% |
0 |
0 |
0 |
100% |
0 |
0 |
100% |
0 |
0 |
100% |
100% |
0 |
0 |
|
D7 |
0 |
100% |
0 |
20% |
80% |
0 |
0 |
100% |
100% |
0 |
0 |
0 |
100% |
0 |
0 |
100% |
0 |
0 |
100% |
100% |
0 |
0 |
|
D14 |
0 |
100% |
0 |
20% |
80% |
0 |
0 |
100% |
100% |
0 |
0 |
20% |
80% |
0 |
10% |
90% |
0 |
20% |
80% |
80% |
0 |
0 |
|
D21 |
0 |
100% |
0 |
27% |
73% |
0 |
0 |
100% |
100% |
0 |
0 |
40% |
60% |
0 |
50% |
50% |
0 |
50% |
50% |
50% |
0 |
0 |
|
W+8 |
40% |
33% |
27% |
87% |
6,5% |
6,5% |
77% |
33% |
33% |
0 |
0 |
40% |
60% |
0 |
50% |
50% |
0 |
60% |
40% |
40% |
0 |
0 |
|
W+12 |
40% |
0 |
60% |
87% |
0 |
13% |
93% |
7% |
7% |
0 |
0 |
40% |
60% |
0 |
50% |
50% |
0 |
60% |
40% |
40% |
0 |
0 |
|
W+16 |
7% |
0 |
93% |
20% |
0 |
80% |
100% |
0 |
0 |
0 |
0 |
30% |
70% |
0 |
30% |
70% |
0 |
50% |
50% |
50% |
0 |
0 |
|
W+20 |
7% |
0 |
93% |
20% |
0 |
80% |
100% |
0 |
0 |
0 |
0 |
20% |
80% |
0 |
30% |
70% |
0 |
50% |
50% |
50% |
0 |
0 |
|
W+24 |
7% |
0 |
93% |
20% |
0 |
80% |
100% |
0 |
0 |
0 |
0 |
30% |
70% |
0 |
30% |
70% |
0 |
30% |
70% |
0 |
0 |
0 |
|
|
Control Group I – healthy dogs |
Control Group II – dogs with BPH |
||||||||||||||||||||
|
|
Background echotexture |
Parenchymal stippling |
General apperance |
Focal changes |
Background echotexture |
Parenchymal stippling |
General apperance |
Focal changes |
||||||||||||||
|
|
N |
HI |
HY |
R |
C |
I |
HO |
HE |
CY |
M |
fHY |
N |
HI |
HY |
R |
C |
I |
HO |
HE |
CY |
M |
fHY |
|
D0 |
100% |
0 |
0 |
100% |
0 |
0 |
100% |
0 |
0 |
0 |
0 |
0 |
100% |
0 |
30% |
70% |
0 |
0 |
100% |
90% |
10% |
0 |
|
D7 |
100% |
0 |
0 |
100% |
0 |
0 |
100% |
0 |
0 |
0 |
0 |
0 |
100% |
0 |
30% |
70% |
0 |
0 |
100% |
90% |
10% |
0 |
|
D14 |
100% |
0 |
0 |
100% |
0 |
0 |
100% |
0 |
0 |
0 |
0 |
0 |
100% |
0 |
30% |
70% |
0 |
0 |
100% |
90% |
10% |
0 |
|
D21 |
100% |
0 |
0 |
100% |
0 |
0 |
100% |
0 |
0 |
0 |
0 |
0 |
100% |
0 |
30% |
70% |
0 |
0 |
100% |
90% |
10% |
0 |
|
W+8 |
100% |
0 |
0 |
100% |
0 |
0 |
100% |
0 |
0 |
0 |
0 |
0 |
100% |
0 |
30% |
70% |
0 |
0 |
100% |
90% |
10% |
0 |
|
W+12 |
100% |
0 |
0 |
100% |
0 |
0 |
100% |
0 |
0 |
0 |
0 |
0 |
100% |
0 |
30% |
70% |
0 |
0 |
100% |
90% |
10% |
0 |
|
W+16 |
100% |
0 |
0 |
100% |
0 |
0 |
100% |
0 |
0 |
0 |
0 |
0 |
100% |
0 |
30% |
70% |
0 |
0 |
100% |
90% |
10% |
0 |
|
W+20 |
100% |
0 |
0 |
100% |
0 |
0 |
100% |
0 |
0 |
0 |
0 |
0 |
100% |
0 |
30% |
70% |
0 |
0 |
100% |
90% |
10% |
0 |
|
W+24 |
100% |
0 |
0 |
100% |
0 |
0 |
100% |
0 |
0 |
0 |
0 |
0 |
100% |
0 |
30% |
70% |
0 |
0 |
100% |
90% |
10% |
0 |
Prostate volume remained unchanged in Groups I and II throughout the study. Both OA and DA reduced the prostate volume. OA had a quicker effect (from D14) on prostate volume reduction compared to DA, but its effect lasted a shorter time (on average up to week 20), while DA reduced the prostate volume more slowly (W + 8), but the reduction level was higher, and persisted longer (>W + 24) (Table 2).
To reliably monitor the prostate volume in the study groups despite breed and size differences, the absolute values (cm3) were converted into percentages (%), assuming the D0 value as 100%. The changes noted during the study were analyzed in relation to this initial value, estimated as 100%. In Group III, the deslorelin acetate group, the period of most intensive reduction was observed later than in Group IV, but the prostate reached much smaller sizes (34% of the initial volume) at the end of the trial (W + 24). The significant reduction compared to Control Group II was first noted on D14 (p = 0.03) (Table 3), while compared to D0, in W + 8 prostate volume reached 47% of the initial size (p < 0.001) (Table 2). The prostate volume was the smallest in W + 24, at 34% of the initial volume. The rate of reduction was the highest between weeks 3 and 8 of the therapy (33% reduction), and 8 and 12 (7%), thereafter the prostate volume continued to decrease, but not significantly (Table 4). Whereas in Group IV the prostate volume decrease was noted sooner, starting from D7, compared to Control Group II (p = 0.01) (Table 3). A significant decrease compared to D0 was first noted on D14 (65% of the initial volume, p = 0.01) and remained at around 60% until W + 24, unfortunately then it started to increase and reached 84% of the D0 volume in W + 24 (Table 2). The most intense reduction occurred between the 1st and 2nd weeks of the study (Table 4).
Table 2. Prostate volume (v, cm3) in control I and II, and treated III and IV groups in the following examinations during the study period. Statistical analysis in relation to day 0 (D0–D21, W + 8–W + 24, mean, SD, range).
|
Group |
D0 |
D7 |
D14 |
D21 |
W + 8 |
W + 12 |
W + 16 |
W + 20 |
W + 24 |
|
I |
|||||||||
|
Mean |
15.58 |
16.06 |
14.82 |
14.84 |
16.12 |
15.77 |
16.26 |
16.87 |
17.5 |
|
SD |
3.48 |
3.53 |
2.97 |
2.65 |
2.46 |
2.8 |
3.62 |
3.42 |
3.63 |
|
Range |
11.55–20.8 |
12.46–21.61 |
11.35–20.34 |
11.49–19.35 |
12.61–19.09 |
12.55–19.21 |
12.03–22.11 |
12.41–23.88 |
13.53–24.6 |
|
II |
|||||||||
|
Mean |
18.26 |
19.04 |
19.1 |
19.24 |
19.05 |
20.67 |
21.47 |
21.93 |
20.44 |
|
SD |
4.1 |
4.72 |
4.23 |
4.7 |
4 |
5.83 |
6.63 |
7.01 |
6.5 |
|
Range |
12.82–23.32 |
12.4–26.7 |
12.64–23.84 |
11.88–26.91 |
13.47–24.63 |
13.93–29.84 |
11.97–36.55 |
12.24–34.5 |
11.75–31.52 |
|
III |
|||||||||
|
Mean |
39.39 |
39.11 |
32.05 |
28.35 |
14.65 * |
11.62 * |
10.7* |
9.6 * |
9.26 * |
|
SD |
31.26 |
26.15 |
19.16 |
20.62 |
7.9 |
5.4 |
3.41 |
1.72 |
1.47 |
|
Range |
11.13–115.91 |
16.01–106.49 |
12.88–80.79 |
11.76–92.57 |
8.44–40.94 |
8.5–30.58 |
7.82–21.83 |
7.88–14.52 |
7.7–12.61 |
|
IV |
|||||||||
|
Mean |
24.07 |
20.74 |
14.7 & |
13.21 * |
13.68 * |
13.65 * |
13.79* |
14.7 & |
18.57 |
|
SD |
9.82 |
6.96 |
4.1 |
2.8 |
4.09 |
3.72 |
4.12 |
5.3 |
9.55 |
|
Range |
10.29–38.48 |
10.91–32.7 |
8.42–22.5 |
8.3–16.78 |
8.48–19.83 |
8.73–21.53 |
8–19.5 |
8.5–25.11 |
7.61–38.3 |
&p < 0.05 in relation to D0; *p,0.01 in relation to D0; in italics—compared using Mann–Whitney test, normal fonts—T-student test.
Table 3. Comparison of prostate volume changes between control and treated groups. To reliably monitor the prostate volume in the study groups despite breed and sizes differences, the absolute values (cm3) were converted into percentages (%). Prostate volume presented as percentage (%), where the initial (D0) volume was considered 100%.
|
Groups Compared |
D7 |
D14 |
D21 |
W + 8 |
W + 12 |
W + 16 |
W + 20 |
W + 24 |
|
I C–II C |
0.92020 |
0.04165 & |
0.18131 |
0.62421 |
0.01137 & |
0.08641 |
0.14046 |
0.95508 |
|
II C–III T |
0.91166 |
0.03259 & |
0.00279 * |
<0.00001 * |
0.00003 * |
0.00003 * |
<0.00001 * |
<0.00001 * |
|
II C–IV T |
0.01195 & |
<0.00001 * |
<0.00001 * |
<0.00001 * |
0.00016 * |
0.00016 * |
0.00016 * |
0.06155 |
|
III T–IV T |
0.02650 & |
0.00116 * |
0.01486 & |
0.07162 |
0.00616 * |
0.00141 * |
0.00072 * |
0.00024 * |
Significance level between groups: probability (p). Abbreviations: Control Group I (I C), Control Group II (II C), Study Group III (III T), Study Group IV (IV T). &p < 0.05; *p,0.01; in italics—compared using Mann–Whitney test, normal fonts—T-student test.
Table 4. The prostate volume changes (V, cm3) in both Study Groups III and IV. Significance level in relation to D0: probability (p).
|
Groups |
D7 |
D14 |
D21 |
W + 8 |
W + 12 |
W + 16 |
W + 20 |
W + 24 |
|
III |
0.85193 |
0.41862 |
0.37251 |
0.00264 * |
0.04882 * |
0.46792 |
0.41862 |
0.46792 |
|
IV |
0.39270 |
0.02959 * |
0.35476 |
0.76735 |
0.98397 |
0.93458 |
0.67268 |
0.27672 |
*p < 0.05; in italics—compared using Mann-Whitney test, normal fonts—T-student test.
3. Doppler Ultrasonography of the Prostatic Artery
We were only able to image the prostatic artery in short segments, due to its tortuosity [4]. Initially, the SPV and Vmean were higher in all dogs diagnosed with BPH, compared to Control Group I. The indices did not change in both Control Groups I and II, whereas in study Groups III and IV they decreased throughout the study. In Group III on D14 the SPV and Vmean were significantly lower than noted on D0 (SPV p = 0.007, Vmean p = 0.008) or in Control Group II (SPV p = 0.003; Vmean p = 0.006). On D21 the mean values were similar to Group I, and from the 8th week of the therapy decreased significantly compared to the healthy dogs in Group I. Whereas, in Group IV the SPV and Vmean were significantly lower, as early as on D7, compared to the D0 values (SPV p = 0.007; Vmean p = 0.008) or Control Group II (SPV p < 0.001, Vmean p = 0.05). The SPV and Vmean indices were similar in heathy dogs from Group I on D7, and remained similar throughout the study period. The highest reduction level of mean velocity was noted in Group III between D21 and W8. While in Group IV the lowest mean velocity was recorded on D21, and thereafter the mean SPV and Vmean increased, but not significantly (Figure 4). Only individual differences were recorded among groups regarding the RI value (Figure 5). The velocity of blood flow correlated positively with prostate volume in both study Groups III and IV (SPV: r > 0.52 p < 0.001, Vmean: r > 0.53 p < 0.001, and SPV: r > 0.45 p < 0.001, Vmean: r > 0.45 p < 0.001, respectively). There was no such correlation for RI indices in the study groups, while in Control Groups I and II no correlations between prostate volume and blood velocity were noted during the observation period (Figure 5, Table 5).
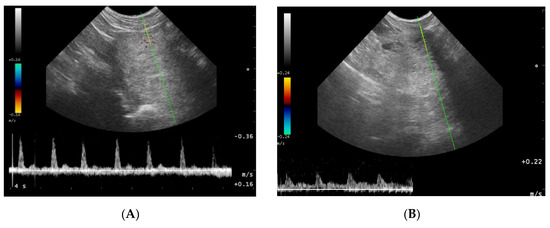
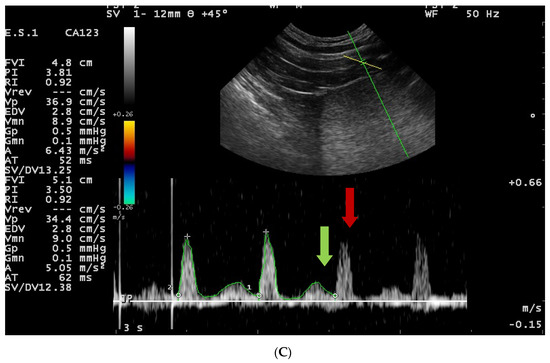
Figure 4. Blood flow patterns, using the duplex technique, of the prostatic artery. (A)—normal pattern in lateral approach; (B)—normal pattern in subcapsular approach; (A)—blood flow pattern in BPH, the flow towards probe, waveform manually traced; red arrow—systolic peak velocity, parabolic flow profile, no spectral window visible and the diastolic peak without flow reversal, a wave with a higher flow velocity visible in diastole—green arrow.
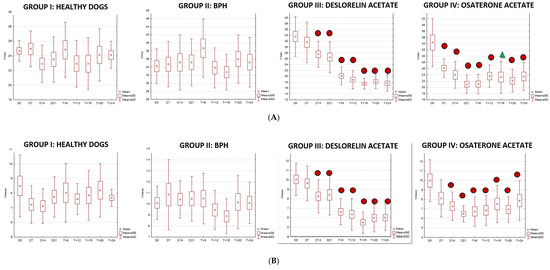
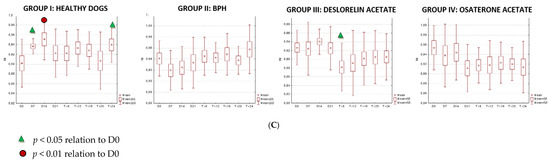
Figure 5. Changes of blood flow velocity ((A)—systolic peak velocity, SPV, cm/s; (B)—mean velocity, Vmean, cm/s; (C)—resistive index, RI) in the prostatic arteries compared to Day 0 (D0) values in the investigated groups of dogs during the 24 weeks of observation (mean, SD, SE).
Table 5. Blood flow indices (systolic peak velocity—SPV, cm/s; mean velocity—Vmean, cm/s) in the prostatic arteries compared between control (Group I and II) and study (III and IV) groups during the 24 weeks of observation (mean, SD, SE).
values in columns with different letters differ (p < 0.05)
|
Group |
D0 |
D7 |
D14 |
D21 |
W+8 |
W+12 |
W+16 |
W+20 |
W+24 |
|||||||||
|
|
SPV |
Vmean |
SPV |
Vmean |
SPV |
Vmean |
SPV |
Vmean |
SPV |
Vmean |
SPV |
Vmean |
SPV |
Vmean |
SPV |
Vmean |
SPV |
Vmean |
|
I |
|
|
|
|
|
|
|
|
|
|
|
|
|
|
|
|
|
|
|
Mean |
24.68a |
8.5 |
24.95a |
7.23a |
22.91a |
7.12a |
23.51a |
7.75a |
24.82a |
8.04a |
22.93a |
7.60a |
22.94a |
7.86a |
24.13a |
8.21a |
24.82a |
8.04a |
|
SD |
1.4 |
2.12 |
2.44 |
1.29 |
2.56 |
1.19 |
3.11 |
1.39 |
3.743 |
2.01 |
3.19 |
1.055 |
3.53 |
1.69 |
3.58 |
1.84 |
3.74 |
2.01 |
|
SE |
23.1-27.28 |
6.34-13.6 |
21.3-29.53 |
6.02-10.53 |
18.65-27.5 |
5.78-9.24 |
16.18-26.43 |
5.44-10.6 |
30.53-18.03 |
3.7-11.03 |
17.95-25.34 |
6.05-9.74 |
15.9-27.95 |
5.37-11.53 |
19.48-32.27 |
5.48-11.47 |
20.98-26.02 |
6.7-8.48 |
|
II |
|
|
|
|
|
|
|
|
|
|
|
|
|
|
|
|
|
|
|
Mean |
34.22b |
10.11 |
34.71b |
10.84b |
35.16b |
10.43b |
35.17b |
10.48b |
38.69b |
10.49b |
33.82b |
9.46b |
32.74b |
8.88a |
36.00b |
10.16b |
35.21b |
10.10b |
|
SD |
4.34 |
1.51 |
5.60 |
3.18 |
6.85 |
1.7 |
5.81 |
2.014 |
7.29 |
2.3 |
4.97 |
1.756 |
4.41 |
1.57 |
5.920 |
2.41 |
6.14 |
1.87 |
|
SE |
24.88-38.88 |
7.13-11.76 |
25.78-44.38 |
5.58-15.23 |
25.54-45.62 |
7.9-12.94 |
27.9-39.6 |
7.1-13.73 |
31.48-52.72 |
7.84-15.84 |
27.9-46.23 |
8.18-13.9 |
29-44.7 |
6.13-11.26 |
25.88-47.47 |
5.85-12.37 |
26.98-45.7 |
7.7-14.35 |
|
III |
|
|
|
|
|
|
|
|
|
|
|
|
|
|
|
|
|
|
|
Mean |
33.65cb |
10.06 |
31.66cb |
9.64cb |
27.57c |
8.27a |
26.56ac |
8.42a |
20.13c |
6.63a |
18.85c |
6.35c |
17.52c |
5.50b |
18.24c |
5.97c |
17.7c |
6.02c |
|
SD |
6.83 |
1.70 |
6.87 |
1.85 |
4.47 |
1.75 |
5.23 |
2.14 |
3.05 |
1.38 |
3.15 |
1.66 |
1.85 |
1.14 |
2.39 |
1.454 |
2.91 |
1.36 |
|
SE |
21.22-45.37 |
7-13.37 |
19.98-45.37 |
6.4-12.73 |
20.9-34.03 |
5.78-11.73 |
18.55-33.87 |
5.84-13.76 |
16.3-27.8 |
5.08-9.36 |
14.7-25.83 |
4.52-11.28 |
15.24-19.05 |
3.22-8.22 |
14.62-21.93 |
3.84-9.35 |
14.36-25.08 |
3.73-7.64 |
|
IV |
|
|
|
|
|
|
|
|
|
|
|
|
|
|
|
|
|
|
|
Mean |
34.36dbc |
9.98 |
26.16a |
8.12a |
23.98ac |
7.28a |
20.99ad |
6.5c |
21.05dc |
6.74a |
23.59a |
6.85ac |
23.25a |
7.52a |
22.14a |
6.95ac |
23.48a |
7.87a |
|
SD |
7.66 |
2.21 |
2.91 |
1.98 |
4.32 |
1.5 |
2.91 |
0.86 |
3.13 |
1.57 |
3.55 |
1.58 |
5.13 |
1.94 |
3.61 |
1.34 |
4.43 |
2.09 |
|
SE |
17.8-42.87 |
7.5-12.23 |
22.7-31.29 |
6.3-11.57 |
17.27-31.96 |
6.13-10.25 |
16.36-26.8 |
5.36-8.26 |
14.87-25.3 |
3.83-8.92 |
18.96-25.96 |
5.28-9.98 |
17.92-31.13 |
5.34-10.88 |
17.46-29.4 |
5.7-10.27 |
16-29.92 |
3.7-11.22 |
4. Testicles B-Mode Appearance
In all the investigated dogs the testes were echogenic, with homogenous medium echo texture and mediastinum imaged as a echogenic central linear structure. In Group II 20% of the dogs had a mild widening of the mediastinum, two dogs had isolated small cysts located in the testicular cranial plane, and four dogs had focal fibrosis in the testicular parenchyma. In this group (II) no changes were noted during the whole study period. In dogs from Group III, from W8 of the treatment, testicular parenchyma started to be less echoic, in W12 in 87% and in W20 in all of investigated dogs testicular parenchyma was described as hypoechoic, whereas the mediastinum first widened (W + 12), but then almost disappeared (W + 24). Moreover, the small fluid-filled cyst (<10 mm) found in one dog and the focal fibrosis imaged near the mediastinum in seven dogs on D0 were not visible form W16 onwards. In Group IV the focal changes and focal fibrosis noted on D0 in some dogs did not change in the following US examinations throughout the whole observation period. Similarly, the imaging of the testicular parenchyma remained unchanged in the following observations.
Testicular volume decreased significantly only in study Group III (deslorelin acetate group). The volume reduction compared to Control Group II was observed starting from W + 8 (p = 0.002), and compared to initial volume (D0) from W + 12, reaching up to 45% (p = 0.002). The testes were the smallest in W16 (35% of the initial D0 volume), and did not change till the end of the observation period. The most intense testicular volume reduction was noted between D21 and W12 after placing the SuprelorinTM implant (Table 6, Figure 6).
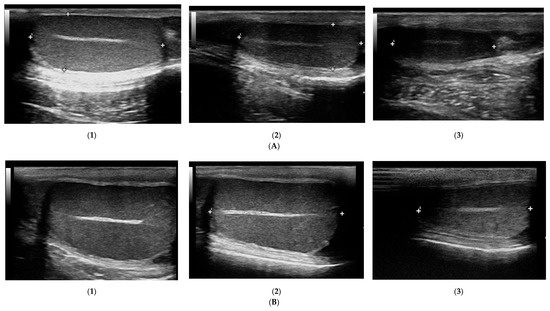
Figure 6. Changes in B-mode testicular imaging in dogs receiving deslorelin acetate. Visible progressive disappearance of mediastinum and gradual lowering of tissue echogenicity. (A) and (B)—patients form Study Group III, examined on (1)—day 0; (2)—week 8; (3)—week 24.
Table 6. Testicular volume (v, cm3) in control I and II, and study III and IV groups in the following examinations during the study. Statistical analysis in relation to day 0 (D0–D21, W + 8–W + 24, mean, SD, range).
|
Group |
D0 |
D7 |
D14 |
D21 |
W + 8 |
W + 12 |
W + 16 |
W + 20 |
W + 24 |
|
I |
|||||||||
|
Mean |
8.43 |
10.51 |
8.01 |
7.86 |
8.62 |
8.24 |
8.24 |
8.25 |
8.45 |
|
SD |
3.49 |
7.59 |
3.02 |
3.03 |
3.23 |
2.49 |
3.43 |
3.2 |
3.34 |
|
Range |
5.06–15.07 |
5.33–29.3 |
5.0–13.62 |
5.1–13.68 |
5.85–14.61 |
5.68–13.1 |
4.98–14.12 |
4.92–13.14 |
5.28–13.65 |
|
II |
|||||||||
|
Mean |
4.47 |
4.71 |
4.7 |
4.66 |
4.98 |
4.87 |
4.99 |
4.9 |
5.27 |
|
SD |
2.2 |
2.81 |
2.69 |
2.89 |
3.38 |
2.8 |
3.04 |
2.7 |
3.15 |
|
Range |
1.56–8.24 |
1.65–10.29 |
1.25–9.51 |
0.85–10.42 |
0.85–12.1 |
1.05–10.41 |
1.4–11.45 |
0.98–9.82 |
1.4–12.01 |
|
III |
|||||||||
|
Mean |
10.22 |
10.75 |
10.12 |
9.23 |
6.97 |
4.92* |
3.69* |
3.85* |
3.68* |
|
SD |
4.93 |
5.67 |
4.72 |
4.18 |
4.3 |
3.85 |
2.18 |
2.5 |
2.26 |
|
Range |
3.58–22.8 |
3.6–24.85 |
3.6–20.12 |
3.18–17.79 |
1.41–15.38 |
1.2–17.07 |
0.84–8.9 |
0.88–9.28 |
0.79–8.4 |
|
IV |
|||||||||
|
Mean |
11.61 |
10.43 |
10.53 |
10.68 |
10.47 |
11.25 |
10.6 |
10.23 |
11.28 |
|
SD |
7.03 |
5.95 |
6.53 |
6.37 |
6.44 |
6.94 |
6.58 |
6.05 |
7.78 |
|
Range |
2.02–24.22 |
2.43–20.42 |
2.4–23.8 |
2.83–21.15 |
2.1–20.23 |
2.7–17.63 |
2.02–23.07 |
2.0–21.04 |
1.93–21.42 |
*p,0.01 in relation to D0; in italics—compared using Mann–Whitney test, normal fonts—T-student test.
5. Doppler Ultrasonography of the Testicular Artery
Generally, all the investigated dogs with BPH had lower values of mean SPV and Vmean than healthy dogs (Control Group I). Significantly lower flow velocities were noted on D0, D7, D14, W20, and W24 compared to Control Group I. Only in study Group III had the SPV and Vmean decreased from W8 of treatment compared to D0 and Control Group II values (SPV p < 0.001 and Vmean p < 0.001; SPV p < 0.001 and Vmean p < 0.001, respectively), and they continued to be lower till the end of the observation period. The highest flow velocity decrease was noted between D21 and W8. Moreover, in the last four examinations (W12, W16, W20, and W24) it was difficult to visualize the testicular vessels and correctly record the blood velocity, due to the progressive reduction in the blood flow and the narrowing of the testicular artery. In Group IV no differences were noted in SPV and Vmean throughout the study. Only individual variances were noted in the RI indices; lower values were noted in Control Group II than in Group I on D14 (p = 0.02) and in W + 20 (p = 0.01), and in Group IV in W8 of the study (p = 0.02), whereas in Group III, RI remained similar throughout the study (Figures 7 and 8).
The velocity of blood flow in the testicular artery only correlated positively with testicular volume in study Group III (SPV: r > 0.55; p < 0.001; Vmean: r > 0.5; p < 0.001). In the remaining control (I, II) and treated (IV) groups no changes to blood flow and testicular volume were noted, hence no correlations were calculated. Furthermore, no correlation was found between RI and volume in any of the investigated or study groups (r > 0.18; p = 0.04).
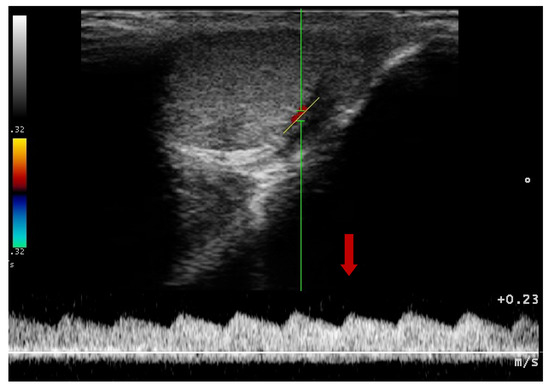
Figure 7. Blood flow pattern using a duplex technique in the testicular artery. Flow towards probe, red arrow—systolic peak velocity, wide parabolic flow profile, no spectral window visible, gradual decrease of velocity in diastole.
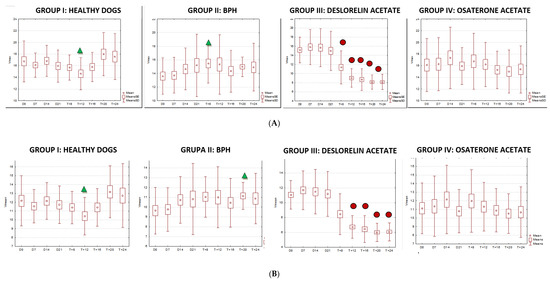
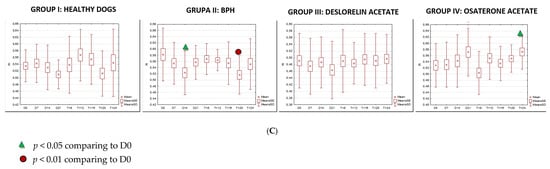
Figure 8. The changes of the blood flow velocity ((A)—systolic peak velocity, SPV, cm/s; (B)—mean velocity, Vmean, cm/s; (C)—resistive index, RI) in the testicular arteries compared to day 0 (D0) values, in the investigated groups of dogs, during the 24 weeks of the study (mean, SD, SE).
This entry is adapted from the peer-reviewed paper 10.3390/ani10122379
References
- Mattoon, S.; Nyland, T.G. Small Animal Diagnostic Ultrasound. Ch. 17: Prostate and Testes, 3rd ed.; Saunders: Philadephia, PA, USA, 2015; pp. 608–633.
- Memon, A. Common Causes of Male Dog Infertility. Theriogenology 2007, 68, 322–328.
- Moxon, ; Bright, L.; Pritchard, B.; Bowen, I.M.; de Souza, M.B.; Da Silva, L.D.; England, G.C. Digital Image Analysis of Testicular and Prostatic Ultrasonographic Echogencity and Heterogeneity in Dogs and the Relation to Semen Quality. Anim. Reprod. Sci. 2015, 160, 112–119.
- Souza, B.; Barbosa, C.C.; England, G.C.; Mota Filho, A.C.; Sousa, C.V.; de Carvalho, G.G.; Silva, H.V.R.; Pinto J.N.; Linhares C.S.J.; Silva, L.D. Regional Differences of Testicular Artery Blood Flow in Post Pubertal and Pre-Pubertal Dogs. BMC Vet. Res. 2015, 11, 47–52.
- Carrillo, D.; Soler, M.; Lucas, X.; Agut, A. Colour and Pulsed Doppler Ultrasonographic Study of the Canine Testis. Reprod. Domest. Anim. 2012, 47, 655–659.
- Freitas, A.; Pinto, J.N.; Silva, H.V.R.; Uchoa, D.C.; Mota Filho, A.C.; Da Silva, L.D.M. Prostatic and Testicular Doppler and Echobiometry in Boxer Dogs. Acta Sci. Vet. 2013, 41, 1121–1129.
- Johnston D.; Root-Kustritz M.V.; Olson P.N. Disorders of the canine prostate. In Canine and Feline Theriogenology; Johnston, S.D., Root-Kustritz, M.V., Olson, P.N., Eds.; Saunders Co: Philadephia, PA, USA, 2001; pp. 337–355.
- Lopate The Problem Stud Dog. Vet. Clin. North Am. Small Anim. Pract. 2012, 42, 469–488.
- Lévy, ; Niżański, W.; von Heimendahl, A.; Mimouni, P. Diagnosis of Common Prostatic Conditions in Dogs: An Update. Reprod. Domest. Anim. 2014, 49, 50–57, doi:10.1111/rda.12296.
- Albouy, ; Sanquer, A.; Maynard, L.; Eun, H.N.: Efficacies of Osaterone and Delmadinone in Treatment of Benign Prostatic Hyperplasia in Dogs. Vet. Rec. 2008, 163, 179–183.
- Fontaine, ; Fontbonne, A. Clinical Use of GnRH Agonists in Canine and Feline Species. Reprod. Domest. Anim. 2011, 46, 344–353.
- Günzel-Apel, A.R.; Mohrke, C.; Polusen Nautrup, C. Colour-Coded and Pulsed Doppler Sonography of the Canine Testis, Epididymis and Prostate Gland: Physiological and Pathological Reprod. Domest. Anim. 2001, 36, 236–240.
- Gumbsch, P.; Gabler, C.; Holzmann, A. Colour-Coded Duplex Sonography of the Testes of Vet. Rec. 2002, 151, 140–144.
- Russo, M.; Vignoli, M.; England, G.C.W. B-Mode and Contrast-Enhanced Ultrasonographic Findings in Canine Prostatic Reprod. Domest. Anim. 2012, 47, 238–242.
- Polisca ; Orlandi R.; Troisi A.; Brecchia, G.; Zerani, M.; Boiti, C.; Zelli, R. Clinical Efficacy of the GnRH Agonist (Deslorelin) in Dogs Affected by Benin Prostatic Hyperplasia and Evaluation of Prostatic Blood Flow by Doppler Ultrasound. Reprod. Domest. Anim. 2013, 48, 673–680.