Clinical reports suggest a potential link between excess retinoids and development of depression. Although it has been shown that all-trans retinoic acid (ATRA) administration induces behavioral changes, further insight into how ATRA is involved is lacking. The hippocampus seems to be a major target of retinoids, and abnormal synaptic plasticity of the hippocampus is involved in depression. We examined two genes associated with synaptic function, discs large homolog 2 (DLG2), and synapse differentiation-inducing gene protein 1 (SynDIG1) in terms of hippocampal expression and correlation with behavior. Three different doses of ATRA were injected into young mice and 10 mg/kg ATRA was found to induce depression-like behavior. In the hippocampus, DLG2 mRNA was significantly decreased by ATRA. mRNA levels were positively correlated with central area duration and distance in the open-field test. Increased SynDIG1 mRNA levels were observed. There was a negative correlation between SynDIG1 mRNA levels and mobility time in the forced swimming test. Retinoic acid receptor γ mRNA was significantly positively correlated with DLG2 and negatively correlated with SynDIG1. To summarize, ATRA administration induced anxiety- and depression-like behavior accompanied by a decreased expression of DLG2 and an increased expression of SynDIG1. Moreover, DLG2 was correlated with anxiety-like behavior and SynDIG1 was correlated with depression-like behavior. These results might constitute a novel target underlying ATRA-induced anxiety- and depression-like behavior.
- all-trans retinoic acid
- discs large homolog 2
- synapse differentiation-inducing gene protein 1
- hippocampus
- anxiety-like behavior
- depression-like behavior
Introduction
Retinoic signaling is reportedly linked with the development of the central nervous system (CNS) and the pathogenesis of depression in adults [1][2][3][4]. Excessive consumption of vitamin A (hypervitaminosis A) has long been known to cause adverse psychiatric events [5]. A synthetic retinoid used to treat acne, 13-cis-retinoic acid (13-cis-RA; isotretinoin), has been linked to depression and suicide, since its approval in 1982 [6]. All-trans retinoic acid (ATRA), the endogenous active derivative of vitamin A, plays a role in cell growth, neural differentiation, and synaptic plasticity during development and operates exclusively by regulating gene transcription [7][8][9]. Recently, our group found that chronic ATRA administration could induce depression-like behavioral changes in adult rats [10][11][12].
The hippocampus is involved in mood disorders, such as anxiety and depression. Brain imaging and post-mortem studies provide evidence of changes in the cellular architecture and/or morphology within this brain region, including a reduction in hippocampal volume, and atrophy of hippocampal pyramidal neurons [13][14][15][16]. Recent studies have indicated that abnormal synaptic plasticity in specific areas of the CNS, particularly the hippocampus, may be a core factor in the pathophysiology of depression [17]. Studies in rodents have provided evidence in support of a reduced synapse number and decreased levels of synaptic signaling proteins in the hippocampus in a depression model [18][19]. Furthermore, antidepressants, such as the highly prescribed selective serotonin reuptake inhibitors, could enhance synaptic plasticity in the hippocampus, as demonstrated in electrophysiological studies [20][21]. All of the above studies confirm a link between altered synaptic plasticity in the hippocampus and major depression. Moreover, the hippocampus seems to be a main target of retinoids [20]. Our group found that ATRA-induced impairments in hippocampal neurogenesis correlate with depression-like behavior [11]. It has been reported that ATRA treatment enhances excitatory synaptic transmission in the hippocampus [21][22] and ATRA is mediated in synaptic plasticity via a synaptic protein synthesis-dependent mechanism [23]. These reports demonstrate the potential role of ATRA in synaptic plasticity of the hippocampus. To better understand the molecular mechanism of synaptic plasticity as influenced by ATRA, we used a whole-genome complementary DNA microarray to investigate changes of gene expression in the human neuroblastoma cell line BE2(c) cells after ATRA administration. Several genes are altered by ATRA (Table S1). We only chose these two synaptic-associated genes, discs large homolog 2 (DLG2) and synapse differentiation-inducing gene protein 1 (SynDIG1), among the genes altered by ATRA. DLG2 is thought to have vital roles in synaptic plasticity [24]. It has been reported that a reduction of DLG2 expression is found in the hippocampus in depression disorders [25], and DLG2 might be involved in depression disorders, according to results of a genome-wide association study [26]. SynDIG1 has been identified as an α-amino-3-hydroxy-5-methylisoxazole-4-propionic acid subtype glutamate receptor (AMPAR)-interacting transmembrane protein that could regulate excitatory synapse development via AMPAR content [27]. Moreover, SynDIG1 has been found to be involved in depressive symptoms in a genome-wide association study [28].
In this study, we aimed to investigate the effect of ATRA on the expression of two synaptic- associated genes, DLG2 and SynDIG1, in the hippocampus and their relationship with anxiety- or depression-like behavior in young mice.
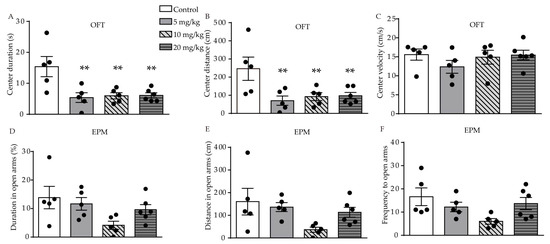
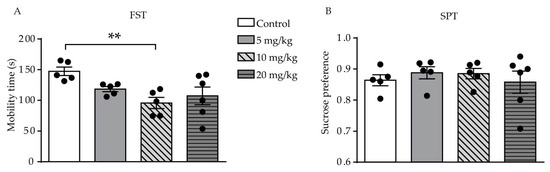
ATRA-Induced Anxiety- and Depression-Like Behavior in Young Mice
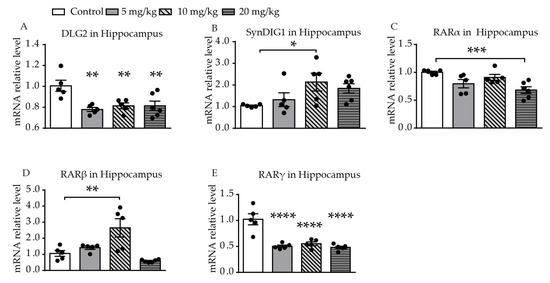
ATRA-Induced Changes in mRNA Expression of DLG2, SynDIG1, and Retinoic Acid Receptors in the Hippocampus
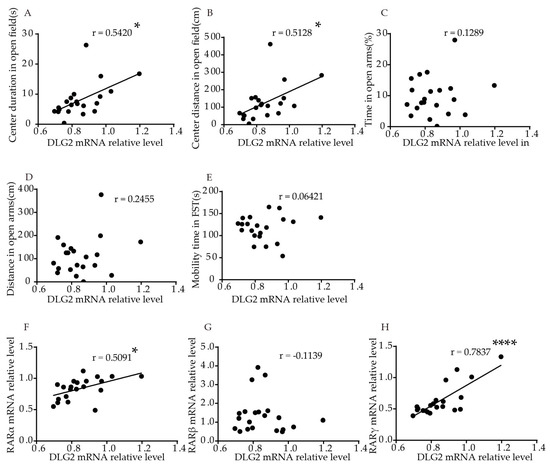
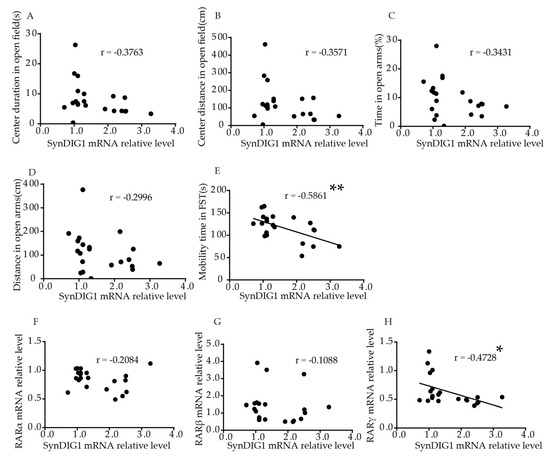
Association of DLG2 and SynDIG1 mRNA Levels with Anxiety- and Depression-Like Behavior and RARs in the Hippocampus
Discussion
This entry is adapted from the peer-reviewed paper 10.3390/ijms21082677
References
- S Cocco; G Diaz; Roberto Stancampiano; A Diana; Manolo Carta; R Curreli; L Sarais; F Fadda; Vitamin A deficiency produces spatial learning and memory impairment in rats. Neuroscience 2002, 115, 475-482, 10.1016/s0306-4522(02)00423-2.
- Douglas Bremner; Kirsty D. Shearer; Peter J. McCaffery; Retinoic acid and affective disorders: the evidence for an association.. The Journal of Clinical Psychiatry 2011, 73, 37-50, 10.4088/JCP.10r05993.
- Douglas Bremner; Peter McCaffery; The neurobiology of retinoic acid in affective disorders. Progress in Neuro-Psychopharmacology and Biological Psychiatry 2007, 32, 315-31, 10.1016/j.pnpbp.2007.07.001.
- Mehdi Tafti; Norbert Ghyselinck; Functional Implication of the Vitamin A Signaling Pathway in the Brain. Archives of Neurology 2007, 64, 1706, 10.1001/archneur.64.12.1706.
- James O???donnell; Polar Hysteria: An Expression of Hypervitaminosis A. American Journal of Therapeutics 2004, 11, 507-516, 10.1097/01.mjt.0000123408.73790.d1.
- Peter Hsu; George I. Litman; Robert T. Brodell; Overview of the Treatment of Acne Vulgaris with Topical Retinoids. Postgraduate Medicine 2011, 123, 153-161, 10.3810/pgm.2011.05.2294.
- Sharoni Jacobs; Dieter Chichung Lie; Kathleen DeCicco-Skinner; Yanhong Shi; Luigi M. DeLuca; Fred H. Gage; Ronald M. Evans; Retinoic acid is required early during adult neurogenesis in the dentate gyrus. Proceedings of the National Academy of Sciences 2006, 103, 3902-3907, 10.1073/pnas.0511294103.
- Elizabeth A. Werner; Hector F. DeLuca; Retinoic acid is detected at relatively high levels in the CNS of adult rats. American Journal of Physiology-Endocrinology and Metabolism 2002, 282, E672-E678, 10.1152/ajpendo.00280.2001.
- Malcolm Maden; Role and distribution of retinoic acid during CNS development. Advances in Applied Microbiology 2001, 209, 1-77, 10.1016/s0074-7696(01)09010-6.
- Li Cai; Xue-Bo Yan; Xiao-Ning Chen; Qing-Yuan Meng; Jiang-Ning Zhou; Chronic all-trans retinoic acid administration induced hyperactivity of HPA axis and behavioral changes in young rats. European Neuropsychopharmacology 2010, 20, 839-847, 10.1016/j.euroneuro.2010.06.019.
- Pu Hu; Yu Wang; Ji Liu; Fan-Tao Meng; Xin-Rui Qi; Lin Chen; Anne-Marie Van Dam; Marian Joëls; Paul J. Lucassen; Jiang-Ning Zhou; et al. Chronic retinoic acid treatment suppresses adult hippocampal neurogenesis, in close correlation with depressive-like behavior. Hippocampus 2016, 26, 911-923, 10.1002/hipo.22574.
- Xiao-Ning Chen; Qing-Yuan Meng; Ai-Min Bao; Dick F. Swaab; Guang-Hui Wang; Jiang-Ning Zhou; The Involvement of Retinoic Acid Receptor-α in Corticotropin-Releasing Hormone Gene Expression and Affective Disorders. Biological Psychiatry 2009, 66, 832-839, 10.1016/j.biopsych.2009.05.031.
- Glenda M. MacQueen; Stephanie Campbell; Bruce S. McEwen; Kathryn Macdonald; Shigeko Amano; R. T. Joffe; Claude Nahmias; L. Trevor Young; Course of Illness, Hippocampal Function, and Hippocampal Volume in Major Depression. FOCUS 2005, 3, 146-155, 10.1176/foc.3.1.146.
- Thomas Frodl; Eva M Meisenzahl; Thomas Zetzsche; Christine Born; Constanze Groll; Markus Jäger; Gerda Leinsinger; Ronald Bottlender; Klaus Hahn; Hans-Jürgen Möller; et al. Hippocampal Changes in Patients With a First Episode of Major Depression. American Journal of Psychiatry 2002, 159, 1112-1118, 10.1176/appi.ajp.159.7.1112.
- Alexander Neumeister; Suzanne Wood; Omer Bonne; Allison Nugent; David A. Luckenbaugh; Theresa Young; Earle E. Bain; Dennis S. Charney; Wayne C. Drevets; Reduced hippocampal volume in unmedicated, remitted patients with major depression versus control subjects. Biological Psychiatry 2005, 57, 935-937, 10.1016/j.biopsych.2005.01.016.
- Craig A. Stockmeier; Gouri J. Mahajan; Lisa C. Konick; James C. Overholser; George J. Jurjus; Herbert Y. Meltzer; Harry B.M. Uylings; Lee Friedman; Grazyna Rajkowska; Cellular changes in the postmortem hippocampus in major depression.. Biological Psychiatry 2004, 56, 640-50, 10.1016/j.biopsych.2004.08.022.
- Gabriele Masi; Paola Brovedani; The Hippocampus, Neurotrophic Factors and Depression. CNS Drugs 2011, 25, 913-931, 10.2165/11595900-000000000-00000.
- Tibor Hajszan; Antonia Dow; Jennifer L. Warner-Schmidt; Klara Szigeti-Buck; Nermin L. Sallam; Arpad Parducz; Csaba Leranth; Ronald S. Duman; Remodeling of Hippocampal Spine Synapses in the Rat Learned Helplessness Model of Depression. Biological Psychiatry 2008, 65, 392-400, 10.1016/j.biopsych.2008.09.031.
- Tibor Hajszan; Klara Szigeti-Buck; Nermin L. Sallam; Jeremy Bober; Arpad Parducz; Neil J. MacLusky; Csaba Leranth; Ronald S. Duman; Effects of Estradiol on Learned Helplessness and Associated Remodeling of Hippocampal Spine Synapses in Female Rats. Biological Psychiatry 2010, 67, 168-74, 10.1016/j.biopsych.2009.08.017.
- Marcos Roberto De Oliveira; R Silvestrin; T Melloesouza; J Moreira; Oxidative stress in the hippocampus, anxiety-like behavior and decreased locomotory and exploratory activity of adult rats: Effects of sub acute vitamin A supplementation at therapeutic doses. NeuroToxicology 2007, 28, 1191-1199, 10.1016/j.neuro.2007.07.008.
- Jason Aoto; Christine I. Nam; Michael M. Poon; Pamela Ting; Lu Chen; Synaptic Signaling by All-Trans Retinoic Acid in Homeostatic Synaptic Plasticity. Neuron 2008, 60, 308-20, 10.1016/j.neuron.2008.08.012.
- Federica Sarti; Zhenjie Zhang; Jessica Schroeder; L. Chen; Rapid suppression of inhibitory synaptic transmission by retinoic acid.. The Journal of Neuroscience 2013, 33, 11440-50, 10.1523/JNEUROSCI.1710-13.2013.
- Bita Maghsoodi; Michael M. Poon; Christine I. Nam; Jason Aoto; Pamela Ting; L. Chen; Retinoic acid regulates RARα-mediated control of translation in dendritic RNA granules during homeostatic synaptic plasticity. Proceedings of the National Academy of Sciences 2008, 105, 16015-16020, 10.1073/pnas.0804801105.
- Holly J. Carlisle; Ann E. Fink; Seth G. N. Grant; Thomas J O'dell; Opposing effects of PSD-93 and PSD-95 on long-term potentiation and spike timing-dependent plasticity. The Journal of Physiology 2008, 586, 5885-5900, 10.1113/jphysiol.2008.163469.
- Vanja Duric; Mounira Banasr; Craig A. Stockmeier; Arthur A. Simen; Samuel S. Newton; James C. Overholser; George J. Jurjus; Lesa Dieter; Ronald S. Duman; Altered expression of synapse and glutamate related genes in post-mortem hippocampus of depressed subjects. International Journal of Neuropsychopharmacology 2013, 16, 69-82, 10.1017/s1461145712000016.
- Michael J. McCarthy; Sherri Liang; Andrea D. Spadoni; John R. Kelsoe; Alan N. Simmons; Whole Brain Expression of Bipolar Disorder Associated Genes: Structural and Genetic Analyses. PLOS ONE 2014, 9, e100204, 10.1371/journal.pone.0100204.
- Evgenia Kalashnikova; Ramon Lorca; Inderpreet Kaur; Gustavo A. Barisone; Bonnie Li; Tatsuto Ishimaru; James S. Trimmer; Durga P. Mohapatra; Elva Dίaz; SynDIG1: An Activity-Regulated, AMPA- Receptor-Interacting Transmembrane Protein that Regulates Excitatory Synapse Development. Neuron 2010, 65, 80-93, 10.1016/j.neuron.2009.12.021.
- Erin C. Dunn; Tamar Sofer; Min-Jung Wang; Thomas W. Soare; Linda C. Gallo; Stephanie Gogarten; Kathleen F. Kerr; Chia-Yen Chen; Murray B. Stein; Robert J. Ursano; et al. Genome-wide association study of depressive symptoms in the Hispanic Community Health Study/Study of Latinos. Journal of Psychiatric Research 2018, 99, 167-176, 10.1016/j.jpsychires.2017.12.010.
- Hans-Georg Kuhn; H Dickinson-Anson; Fh Gage; Neurogenesis in the dentate gyrus of the adult rat: age-related decrease of neuronal progenitor proliferation. The Journal of Neuroscience 1996, 16, 2027-2033, 10.1523/JNEUROSCI.16-06-02027.1996.
- Linda Patia Spear; The adolescent brain and age-related behavioral manifestations. Neuroscience & Biobehavioral Reviews 2000, 24, 417-463, 10.1016/s0149-7634(00)00014-2.
- Kally C O'reilly; Jason Shumake; Francisco Gonzalez-Lima; Michelle A. Lane; Sarah Bailey; Chronic Administration of 13-Cis-Retinoic Acid Increases Depression-Related Behavior in Mice. Neuropsychopharmacology 2006, 31, 1919-1927, 10.1038/sj.npp.1300998.
- Diego A Pizzagalli; Depression, stress, and anhedonia: toward a synthesis and integrated model.. Annual Review of Clinical Psychology 2014, 10, 393-423, 10.1146/annurev-clinpsy-050212-185606.
- Sarah A Stuart; Paul Butler; Marcus R. Munafò; David Nutt; Emma S. J. Robinson; A Translational Rodent Assay of Affective Biases in Depression and Antidepressant Therapy. Neuropsychopharmacology 2013, 38, 1625-35, 10.1038/npp.2013.69.
- S A Stuart; Christian Wood; Emma S. J. Robinson; Using the affective bias test to predict drug-induced negative affect: implications for drug safety.. Journal of Cerebral Blood Flow & Metabolism 2017, 174, 3200-3210, 10.1111/bph.13972.
- Sherry A. Ferguson; F. Javier Cisneros; B. Gough; Joseph P. Hanig; Kimberly J. Berry; Chronic Oral Treatment with 13-cis-Retinoic Acid (Isotretinoin) or all-trans-Retinoic Acid Does Not Alter Depression-Like Behaviors in Rats. Toxicological Sciences 2005, 87, 451-459, 10.1093/toxsci/kfi262.
- James Crandall; Yasuo Sakai; Jinghua Zhang; Omanand Koul; Yann Mineur; Wim Crusio; P. McCaffery; 13-cis-retinoic acid suppresses hippocampal cell division and hippocampal-dependent learning in mice. Proceedings of the National Academy of Sciences 2004, 101, 5111-5116, 10.1073/pnas.0306336101.
- Li Cai; Rong Li; Jiang-Ning Zhou; Chronic all-trans retinoic acid administration induces CRF over-expression accompanied by AVP up-regulation and multiple CRF-controlling receptors disturbance in the hypothalamus of rats. Brain Research 2015, 1601, 1-7, 10.1016/j.brainres.2014.12.054.
- P Hu; J Liu; J Zhao; X-R Qi; C-C Qi; P J Lucassen; Jiang-Ning Zhou; All-trans retinoic acid-induced hypothalamus-pituitary-adrenal hyperactivity involves glucocorticoid receptor dysregulation.. Translational Psychiatry 2013, 3, e336-e336, 10.1038/tp.2013.98.
- Sherry A. Ferguson; F. Javier Cisneros; Joseph P. Hanig; Kimberly J. Berry; Oral treatment with ACCUTANE® does not increase measures of anhedonia or depression in rats. Neurotoxicology and Teratology 2007, 29, 642-651, 10.1016/j.ntt.2007.09.003.
- Simon Trent; Cheney J.G. Drew; Paul J. Mitchell; Sarah Bailey; Chronic treatment with 13-cis-retinoic acid changes aggressive behaviours in the resident–intruder paradigm in rats. European Neuropsychopharmacology 2009, 19, 876-886, 10.1016/j.euroneuro.2009.07.003.
- James E. Balmer; Rune Blomhoff; Gene expression regulation by retinoic acid. Journal of Lipid Research 2002, 43, 1773-1808, 10.1194/jlr.r100015-jlr200.
- Scott M. Thompson; Angy J. Kallarackal; Mark Kvarta; Adam M. Van Dyke; Tara A. LeGates; Xiang Cai; An excitatory synapse hypothesis of depression.. Trends in Neurosciences 2015, 38, 279-94, 10.1016/j.tins.2015.03.003.
- Kathryn L. Lovero; Sabine M. Blankenship; Yun Shi; R A Nicoll; SynDIG1 Promotes Excitatory Synaptogenesis Independent of AMPA Receptor Trafficking and Biophysical Regulation. PLOS ONE 2013, 8, e66171, 10.1371/journal.pone.0066171.
- Marta Gomez-Galan; D De Bundel; Ann Van Eeckhaut; I Smolders; Maria Lindskog; Dysfunctional astrocytic regulation of glutamate transmission in a rat model of depression. Molecular Psychiatry 2012, 18, 582-594, 10.1038/mp.2012.10.
- Dianne Robert Soprano; Pu Qin; Kenneth J. Soprano; RETINOIC ACID RECEPTORS AND CANCERS. Annual Review of Nutrition 2004, 24, 201-221, 10.1146/annurev.nutr.24.012003.132407.
- Damien Bonhomme; Véronique Pallet; Gaelle Dominguez; Laure Servant; Nadia Henkous; Pauline Lafenetre; Paul Higueret; Daniel Béracochéa; K. Touyarot; Retinoic acid modulates intrahippocampal levels of corticosterone in middle-aged mice: consequences on hippocampal plasticity and contextual memory. Frontiers in Aging Neuroscience 2014, 6, 6, 10.3389/fnagi.2014.00006.