The disposition index, abbreviated DI, is a biomarker for the function of the insulin-glucose feedback control system. It can be determined using various methods and provides an estimate of the loop gain of the homeostatic system. Generally, it is calculated as the product of pancreatic beta-cell function times insulin sensitivity.
- Disposition index
- hidradenitis suppurativa
- acne inversa
- prediabetes
- SPINA-GBeta
- SPINA-GR
- SPINA-DI
- Glucose clamp
- fsIGT
- fsOGT
Background
Under physiological conditions, insulin sensitivity and beta cell function adapt to each other over a prolonged period[1]. This means that in cases of ‘healthy’ obesity, i.e. without diabetes mellitus, beta cell mass increases as insulin sensitivity decreases (i.e. insulin resistance increases). Conversely, beta cell function decreases in conditions of high insulin sensitivity (e.g., in prolonged starvation). This long-term adaptation of glandular mass to demand is a general principle in endocrinology, which is referred to as dynamic compensation.
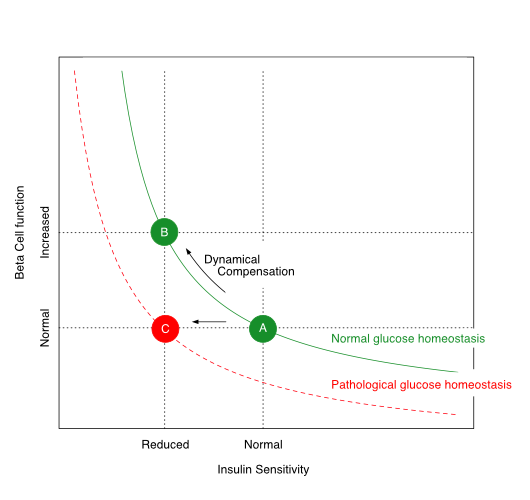
The relationship between insulin sensitivity and beta-cell function is hyperbolic in a ‘metabolically healthy’ organism. Via dynamic compensation, beta-cell mass increases with progressive insulin resistance, whereas the disposition index, which is the product of insulin sensitivity and beta-cell function (green line), remains constant (transition from A to B). If this does not happen or is insufficient (transition from A to C), the result is prediabetes or type 2 diabetes mellitus.
The disposition index, which is the product of insulin sensitivity and beta-cell function, remains constant in healthy organisms despite variations in body composition and insulin resistance. If, however, the pancreatic beta cells are no longer able to compensate for increasing insulin resistance by increased cell mass, the disposition index decreases and glucose homeostasis is impaired. This is the case in advanced metabolic syndrome. Depending on the extent of the reduction in the disposition index, prediabetes or type 2 diabetes mellitus may develop.
How to Determine the Disposition Index
For determining the disposition index, data on insulin sensitivity and beta-cell function have to be obtained. This can be done in various ways:
- via a glucose clamp investigation
- via a frequently-sampled intravenous glucose tolerance test (fsIGT)
- an oral glucose tolerance test with a narrow temporal grid of measurement (‘frequently-sampled oral glucose tolerance test’, fsOGT) or
- based on fasting concentrations for glucose and insulin (SPINA Carb).
Calculation
Glucose Clamp
If based on a glucose clamp investigation, the disposition index is calculated as the product of the insulin response curve (AUCΔInsulin) and the insulin sensitivity index (ISIClamp) with
 [2]
[2]
ISIClamp is the ratio of the mean glucose infusion rate and the mean insulin concentration during the clamp:

Intravenous Glucose Tolerance Test
Using the fsIGT, the time series of insulin and glucose concentration are to be fitted to the minimal model. Then the disposition index can be calculated with

from the first phase of the insulin response (φ1) and the insulin sensitivity index (S1)[3].
Oral Glucose Tolerance Test
If the fsOGT is used, it is to be coupled with the approach of Matsuda and DeFronzo. Then, the disposition index can be calculated with

from the insulinogenic index (IGI) and the insulin sensitivity index (ISIcomposite)[4].
SPINA Carb
This method delivers a static disposition index that requires fasting concentrations of insulin and glucose only. It is calculated with

as the product of the secretory capacits of pancreatic beta cells (SPINA-GBeta) and the reconstructed insulin receptor gain (SPINA-GR)[5][6].
Interpretation
The approaches presented provide similar but slightly different information. Even though the results of the four methods correlate significantly with each other, several biological factors may cause certain deviations. These are rooted, for example, in the different mechanisms that determine static and dynamic insulin secretion patterns. In a comparative study, the discriminatory power of the static disposition index for the diagnosis of diabetes mellitus was higher than that of the oGTT-based disposition index according to Matsuda and DeFronzo.
Prognostic aspects
A reduced disposition index predicts the evolution of type 2 diabetes[7]. It is also reduced in certain chronic and inflammatory conditions, including cystic fibrosis[8], reduced PCSK9 expression[9] and hidradenitis suppurativa (aka acne inversa)[10].
In a prospective evaluation of the NHANES study, a reduced static disposition index (SPINA-DI) predicted all-cause mortality over 10 years[11].
References
- Bergman RN, Ader M, Huecking K, Van Citters G.; Accurate assessment of beta-cell function: the hyperbolic correction. Diabetes 2002, 51 Suppl 1, S212-20, .
- Shah SS, Ramirez CE, Powers AC, Yu C, Shibao CA, Luther JM; Hyperglycemic clamp-derived disposition index is negatively associated with metabolic syndrome severity in obese subjects. Metabolism 2016, 65(6), 835-42, .
- Bergman RN; Origins and History of the Minimal Model of Glucose Regulation. Front Endocrinol (Lausanne) 2021, 11, 583016, .
- Matsuda M, DeFronzo RA; Insulin sensitivity indices obtained from oral glucose tolerance testing: comparison with the euglycemic insulin clamp. Diabetes Care 1999, 22, 1462-70, .
- Dietrich JW, Dasgupta R, Anoop S, Jebasingh F, Kurian ME, Inbakumari M, Boehm BO, Thomas N.; SPINA Carb: a simple mathematical model supporting fast in-vivo estimation of insulin sensitivity and beta cell function. Sci Rep 2022, 12, 17659, .
- Dietrich JW, Abood A, Dasgupta R, Anoop S, Jebasingh FK, Spurgeon R, Thomas N, Boehm BO; A novel simple disposition index (SPINA-DI) from fasting insulin and glucose concentration as a robust measure of carbohydrate homeostasis. J Diabetes 2024, 16, e13525, .
- Lorenzo C, Wagenknecht LE, Rewers MJ, Karter AJ, Bergman RN, Hanley AJ, Haffner SM; Disposition index, glucose effectiveness, and conversion to type 2 diabetes: the Insulin Resistance Atherosclerosis Study (IRAS). Diabetes Care 2010, 33, 2098-103, .
- Nielsen BU, Mathiesen IHM, Krogh-Madsen R, Katzenstein TL, Pressler T, Shaw JAM, Rickels MR, Almdal TP, Faurholt-Jepsen D, Stefanovski D; Insulin sensitivity, disposition index and insulin clearance in cystic fibrosis: a cross-sectional study.. Diabetologia 2024, 67, 2188-2198, .
- Cyr Y, Lamantia V, Bissonnette S, Burnette M, Besse-Patin A, Demers A, Wabitsch M, Chrétien M, Mayer G, Estall JL, Saleh M, Faraj M; Lower plasma PCSK9 in normocholesterolemic subjects is associated with upregulated adipose tissue surface-expression of LDLR and CD36 and NLRP3 inflammasome. Physiol Rep 2021, 9, e14721, .
- Abu Rached N, Dietrich JW, Ocker L, Stockfleth E, Haven Y, Myszkowski D, Bechara FG; Endotyping Insulin-Glucose Homeostasis in Hidradenitis Suppurativa: The Impact of Diabetes Mellitus and Inflammation. J Clin Med 2025, 14, 2145, .
- Dietrich JW; P4-Endokrinologie – Kybernetische Perspektiven eines neuen Ansatzes. Leibniz Online 2024, 54, 20, .