Coffee is one of the most widely consumed beverages globally, and its intake has been linked to various health benefits. This study investigates the epigenetic effects of habitual coffee consumption by examining genome-wide DNA methylation profiles in salivary DNA from 3,822 individuals—1,474 heavy coffee drinkers (≥5 cups/day for ≥3 years) and 2,348 long-term abstainers. Using the Illumina 850K array, 22 autosomal CpG sites showed significant differential methylation (p ≤ 7.89×10⁻¹⁰) between the groups. Notably, three hypomethylated sites were identified within the TLE1 gene, a transcriptional corepressor involved in inflammatory, metabolic, and developmental pathways. The consistent hypomethylation across these sites suggests TLE1 as a potential epigenetic target of coffee intake, possibly mediating its anti-inflammatory and metabolic effects. These findings highlight a robust salivary DNA methylation signature associated with coffee consumption and suggest TLE1 methylation as a potential biomarker for long-term exposure. Further studies are warranted to validate functional outcomes and tissue-specific relevance.
- coffee
- epigenetics
- dna methylation
- health
- inflammation
- wellness
- genetics
1. Introduction
Coffee is one of the world’s most consumed beverages, and epidemiological studies have linked habitual coffee consumption with various health outcomes [1]. Benefits of moderate coffee intake have been reported for metabolic diseases (such as type 2 diabetes and non-alcoholic fatty liver disease), cardiovascular conditions, neurodegenerative disorders, and certain cancers. These protective associations are often attributed to coffee’s rich phytochemical content (including caffeine and polyphenols) and their antioxidant and anti-inflammatory effects. However, the biological mechanisms connecting coffee to improved health are not fully understood. Epigenetic modifications, particularly DNA methylation, have emerged as a plausible mediator between long-term dietary exposures and gene regulation. DNA methylation changes in blood cells have been observed for various lifestyle factors (smoking, diet, etc.), and recent evidence suggests coffee intake may also leave an epigenetic signature [1].
Several large EWAS in blood DNA have identified specific CpG sites associated with coffee consumption. Notably, a meta-analysis in peripheral blood (European and African American cohorts, n ≈ 15,800) reported 11 CpGs at genome-wide significance [1]. Many of these genes are involved in xenobiotic metabolism or metabolic regulation. For instance, AHRR (Aryl-Hydrocarbon Receptor Repressor) and F2RL3 (coagulation factor PAR-4 gene) are canonical loci hypomethylated by tobacco smoking, suggesting overlapping pathways between coffee consumption and tobacco exposure. Another top locus, PHGDH (Phosphoglycerate Dehydrogenase), is a key enzyme in serine metabolism; methylation at a PHGDH CpG (cg14476101) has been linked to gene expression and fatty liver risk [2]. These findings hint that coffee’s influence on health may operate partly via epigenetic alterations in genes related to detoxification, inflammation, and hepatic lipid metabolism.
To date, most coffee EWAS have been conducted in blood DNA. Saliva is an attractive alternative tissue for epigenetic studies, being easily obtainable and reflecting both oral epithelial and immune cell methylation. However, saliva has a different cellular composition from blood, and prior analyses in smaller samples did not detect significant coffee-associated CpGs in saliva [3], highlighting the need for larger studies. Here, we leverage a large cohort of >3800 individuals to examine salivary DNA methylation differences between habitual coffee drinkers and non-drinkers. We focus on heavy coffee use (≥5 cups/day) vs. long-term abstinence to maximise contrast, while excluding smokers to avoid the strong confounding effects of tobacco on methylation.
2. Materials and Methods
Study Population: The analysis included two cohorts drawn from the Muhdo Health data repository. Cohort 1 (Focus group) consisted of 1,474 habitual coffee drinkers (≥5 cups of caffeinated coffee per day for at least 3 years). Cohort 2 (Complement group) comprised 2,348 individuals who consume no coffee (0 cups for ≥3 years). All participants were adults (mean ages: 42.0 in coffee drinkers, 40.1 in non-drinkers) and were free of active smoking. Current smokers were strictly excluded from both groups to eliminate the acute effects of smoking on DNA methylation; former smokers were not explicitly excluded but were evenly distributed as far as known. Basic demographic information (age, sex) was collected for covariate adjustment. The sex distribution differed between groups (36.4% female in coffee drinkers vs. 48.3% in non-drinkers), we removed the X and Y chromosome data from final analysis.
Sample Collection and DNA Extraction: Participants provided saliva samples using standardised saliva collection kits. Saliva DNA was chosen for its non-invasive collection and because it contains genomic DNA from both buccal epithelial cells and immune cells. Data is available via the Muhdo Health data repository.
DNA Methylation Assay: The Illumina Infinium MethylationEPIC BeadChip (850K array) was utilised following the manufacturer’s protocol via analysis at Eurofins Denmark. This array interrogates >850,000 CpG sites across the genome, including promoter regions, gene bodies, enhancers, and intergenic CpGs. Raw intensity data were processed with standard bioinformatics pipelines. The resulting methylation levels are reported as β values (fraction of DNA methylated at a given CpG, ranging 0 to 1).
Statistical Analysis: We analysed the association between coffee group (high coffee vs. non-drinker) and DNA methylation at each CpG using linear regression on β values. Cell proportion estimates were inferred by a reference-based method for saliva DNA methylation. The effect size was expressed as the difference in mean methylation (β) between coffee drinkers and non-drinkers. We identified differentially methylated positions (DMPs) using a genome-wide significance threshold of p ≤ 7.89×10^−10., all reported sites are far below the 5% FDR. An initial set of 482 CpGs met p ≤ 7.89×10^−10. Many of these were on the X or Y chromosome, likely reflecting the sex imbalance between groups; we therefore removed all CpGs on chrX/chrY from further consideration to avoid sex-driven methylation differences. After this filter, 22 autosomal CpG sites remained significantly associated with coffee consumption. These 22 CpGs form the basis of our final results.
Annotation and Pathway Analysis: We annotated the significant CpG sites to genes and genomic features using the Illumina EPIC manifest and the UCSC Genome Browser database. Each CpG was mapped to the nearest gene(s) and classified by location (e.g., TSS200 promoter region, gene body, 5′UTR, intergenic). We also noted if the CpG lies within a CpG island or shore. To explore biological pathways, we conducted gene ontology enrichment analysis on the annotated genes.
3. Results
Differential Methylation Associated with Coffee Consumption: Our EWAS identified 22 autosomal CpG sites with genome-wide significant methylation differences between heavy coffee drinkers and non-drinkers after sex specific chromosome removal (p ≤ 7.89×10^−10). Table 1 summarises these CpGs, including their chromosomal location, nearest gene annotation, the methylation difference (β) between groups, and significance. The β values represent the mean methylation in the coffee group minus the mean in non-drinkers, expressed as a percentage. Notably, the differences are small in absolute magnitude, despite their small size, these changes were highly statistically significant given the large sample size.
Table 1. The 22 cg sites after filtering.
|
CpG ID |
Chromosome |
Genomic Location |
Gene(s) |
Mean Methylation (Coffee) |
Mean Methylation (Non-Coffee) |
Difference (Coffee - Non) |
p-value |
|
cg12691488 |
1 |
243053673 |
0.259 |
0.231 |
0.0286 |
6.42E-15 |
|
|
cg15817705 |
1 |
209406063 |
0.776 |
0.758 |
0.018 |
1.66E-11 |
|
|
cg19765154 |
2 |
191524409 |
NAB1 |
0.803 |
0.785 |
0.0186 |
1.91E-12 |
|
cg07628841 |
2 |
27851430 |
GPN1 |
0.457 |
0.469 |
-0.0128 |
6.44E-11 |
|
cg20262915 |
2 |
191524489 |
NAB1 |
0.526 |
0.509 |
0.0171 |
9.91E-11 |
|
cg25711786 |
5 |
137854503 |
ETF1 |
0.511 |
0.488 |
0.0231 |
1.69E-11 |
|
cg12019814 |
8 |
117861247 |
RAD21 |
0.585 |
0.568 |
0.0167 |
1.56E-10 |
|
cg15563854 |
9 |
84304278 |
TLE1 |
0.121 |
0.149 |
-0.0284 |
3.85E-11 |
|
cg20926353 |
9 |
84303358 |
TLE1 |
0.285 |
0.324 |
-0.0388 |
2.26E-10 |
|
cg05542541 |
9 |
84302347 |
TLE1 |
0.197 |
0.217 |
-0.0203 |
6.29E-10 |
|
cg25294185 |
11 |
65487814 |
RNASEH2C |
0.0918 |
0.0779 |
0.0139 |
6.79E-12 |
|
cg17232883 |
11 |
59318136 |
0.13 |
0.139 |
-0.0087 |
2.21E-11 |
|
|
cg04858776 |
11 |
59318494 |
0.0861 |
0.0971 |
-0.011 |
4.14E-11 |
|
|
cg09516963 |
12 |
68042445 |
DYRK2 |
0.336 |
0.386 |
-0.0504 |
1.27E-13 |
|
cg06710937 |
13 |
23489940 |
0.0473 |
0.0536 |
-0.0063 |
3.23E-11 |
|
|
cg02325951 |
14 |
89878619 |
FOXN3 |
0.624 |
0.605 |
0.0192 |
1.53E-12 |
|
cg13150977 |
15 |
85114131 |
UBE2QP1 |
0.174 |
0.16 |
0.0141 |
5.52E-12 |
|
cg04946709 |
16 |
59789030 |
LOC644649 |
0.797 |
0.777 |
0.0207 |
6.31E-13 |
|
cg06152526 |
16 |
57290525 |
PLLP |
0.795 |
0.781 |
0.014 |
3.51E-10 |
|
cg05100634 |
18 |
45457604 |
SMAD2 |
0.0374 |
0.04 |
-0.0026 |
4.45E-12 |
|
cg25304146 |
18 |
30092971 |
WBP11P1 |
0.673 |
0.658 |
0.015 |
2.04E-10 |
|
cg13199411 |
20 |
34313011 |
RBM39 |
0.869 |
0.857 |
0.0127 |
1.61E-10 |
cg09516963 (DYRK2) showed the greatest hypomethylation (-0.0504) and cg12691488 on chromosome 1 showed the highest hypermethylation (0.0286). Three sites across chromosome 9 within the gene TLE1 showed hypomethylation (see figure 1). TLE1 (Transducin-Like Enhancer of Split 1) is a transcriptional co-repressor that functions downstream of several critical developmental and signalling pathways.
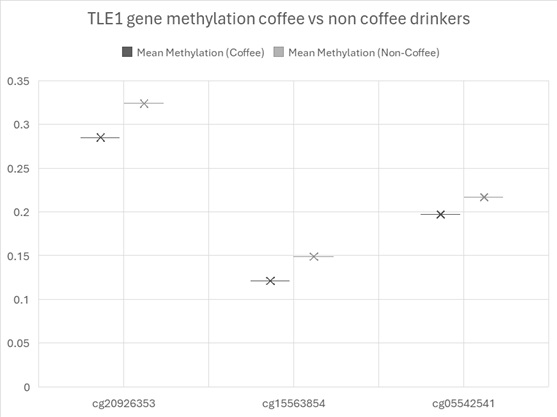
Figure 1. Mean methylation across the sites on TLE1.
4. Discussion
Among the 22 CpG sites that reached genome-wide significance in this study, three mapped to the TLE1 (Transducin-Like Enhancer of Split 1) locus on chromosome 9—cg15563854, cg20926353, and cg05542541—and all exhibited consistent hypomethylation in heavy coffee consumers compared to non-drinkers. This regionally coordinated epigenetic alteration suggests TLE1 may be a relevant molecular target influenced by long-term high coffee intake.
TLE1 is a member of the Groucho/transducin-like enhancer family of transcriptional corepressors and is known to regulate various signalling cascades including Wnt/β-catenin, Notch, and NF-κB pathways [4]. These pathways are critical to cell fate decisions, immune modulation, metabolism, and inflammation—processes that are also affected by coffee consumption as shown in prior epidemiological and mechanistic studies [4].
DNA methylation typically represses gene transcription when occurring in promoter regions or regulatory elements. While the precise regulatory context of the three TLE1 CpG sites in this study remains to be mapped in full, the consistent hypomethylation (β ranging from –0.020 to –0.039) across a ~2 kb span supports the hypothesis of increased transcriptional potential for TLE1 in coffee consumers.
TLE1 and Inflammation: TLE1 represses NF-κB target genes by interfering with RelA-p65 transactivation, effectively reducing the transcription of pro-inflammatory cytokines such as TNF-α and IL-1β [5]. Chronic low-grade inflammation is a hallmark of ageing and metabolic disorders; therefore, the epigenetic upregulation of TLE1 may provide a molecular explanation for the anti-inflammatory effects of habitual coffee consumption observed in population studies.
TLE1 and Metabolic Regulation: TLE1 has also been implicated in adipocyte differentiation and metabolic homeostasis through Wnt pathway repression [4]. The observed hypomethylation at TLE1 may therefore reflect or contribute to reduced adipogenic capacity, consistent with the epidemiological association between coffee intake and lower adiposity and body weight gain [6].
Potential Role in Cellular Resilience: TLE1 is expressed in hematopoietic and mesenchymal tissues and has been shown to mediate cellular differentiation and lineage allocation [7]. Its modulation could alter immune cell subtype distributions or reactivity. While speculative in the context of saliva, TLE1 methylation shifts might mirror systemic immune recalibration in coffee drinkers, potentially supporting improved stress resilience or recovery profiles observed in athletes and habitual exercisers who consume caffeine [8].
5. Epigenetic Coordination and Relevance
The observation of three closely positioned CpGs within TLE1 all hypomethylated in coffee drinkers suggests a regional epigenetic signature—a phenomenon often seen in environmentally responsive genes such as those affected by smoking or diet. This kind of clustering enhances biological confidence, especially given the modest individual β values, and supports the utility of TLE1 methylation as a potential biomarker for long-term coffee exposure.
6. Limitations and Future Directions
This study used saliva DNA, which provides a practical and accessible tissue but includes mixed cell populations. Further research in purified immune subsets or metabolically active tissues (e.g., liver or adipose) would clarify the downstream expression and function of TLE1 in coffee-associated phenotypes. Additionally, transcriptomic or protein-level validation is needed to confirm whether TLE1 hypomethylation leads to functional upregulation, and whether this correlates with anti-inflammatory or metabolic outcomes.
References
- Qi Ding; Yan-Ming Xu; Andy T. Y. Lau; The Epigenetic Effects of Coffee. Mol. 2023, 28, 1770, .
- Irma Karabegović; Eliana Portilla-Fernandez; Yang Li; Jiantao Ma; Silvana C. E. Maas; Daokun Sun; Emily A. Hu; Brigitte Kühnel; Yan Zhang; Srikant Ambatipudi; et al. Epigenome-wide association meta-analysis of DNA methylation with coffee and tea consumption. Nat. Commun. 2021, 12, 1-13, .
- Yu-Hsuan Chuang; Austin Quach; Devin Absher; Themistocles Assimes; Steve Horvath; Beate Ritz; Coffee consumption is associated with DNA methylation levels of human blood. Eur. J. Hum. Genet. 2017, 25, 608-616, .
- Francisco Giner; Emilio Medina-Ceballos; Raquel López-Reig; Isidro Machado; José Antonio López-Guerrero; Samuel Navarro; Luis Alberto Rubio-Martínez; Mónica Espino; Empar Mayordomo-Aranda; Antonio Llombart-Bosch; et al. The Combined Immunohistochemical Expression of GLI1 and BCOR in Synovial Sarcomas for the Identification of Three Risk Groups and Their Prognostic Outcomes: A Study of 52 Patients. Int. J. Mol. Sci. 2024, 25, 7615, .
- Da Yuan; Xue Yang; Zhenpeng Yuan; Yanqing Zhao; Junchao Guo; TLE1 function and therapeutic potential in cancer. Oncotarget 2016, 8, 15971-15976, .
- Isabela Monique Fortunato; Quélita Cristina Pereira; Fabricio de Sousa Oliveira; Marisa Claudia Alvarez; Tanila Wood dos Santos; Marcelo Lima Ribeiro; Metabolic Insights into Caffeine’s Anti-Adipogenic Effects: An Exploration through Intestinal Microbiota Modulation in Obesity. Int. J. Mol. Sci. 2024, 25, 1803, .
- Selvi Ramasamy; Borja Saez; Subhankar Mukhopadhyay; Daching Ding; Alwiya M. Ahmed; Xi Chen; Ferdinando Pucci; Rae’e Yamin; Jianfeng Wang; Mikael J. Pittet; et al. Tle1 tumor suppressor negatively regulates inflammation in vivo and modulates NF-κB inflammatory pathway. Proc. Natl. Acad. Sci. 2016, 113, 1871-1876, .
- Muhammad Liaquat Raza; Motahareh Haghipanah; Nasrollah Moradikor. Coffee and stress management: How does coffee affect the stress response?; Elsevier: Amsterdam, NX, Netherlands, 2024; pp. 59-80.