A newly proposed Regulatory Compliance Scale is being suggested for consideration in regulatory science and human services regulatory administration and the licensing and review of programs and facilities. The article presents the parameters of the new scale along with research that has been done to date in using the proposed scale.
- regulatory science
- regulatory compliance
- licensing measurement
- human services regulatory administration
1. Introduction
The purpose of this paper is to provide an alternate paradigm for regulatory compliance measurement in moving from a nominal to an ordinal scale measurement strategy and to introduce a new licensing/regulatory compliance metric: the Regulatory Compliance Scale. Regulatory compliance measurement is dominated by a nominal scale measurement system in which rules are either in compliance or out of compliance. There are no gradients for measurement within the present licensing measurement paradigm. It is very absolute. Either a rule is in full compliance to the letter of the law or the essence of the regulation or it is not. An alternate paradigm borrowing from accreditation and other program quality systems is to establish an ordinal scale measurement system which takes various gradients of compliance into account. With this alternate paradigm, it offers an opportunity to begin to introduce a quality element into the measurement schema. It also allows us to take into consideration both risk and prevalence data which are important in rank ordering specific rules.
So how would this look from a licensing decision making vantage point. Presently, in licensing measurement, licensing decisions are made at the rule level in which each rule is either in or out of compliance in the prevailing paradigm. Licensing summaries with corrective actions are generated from the regulatory compliance review. It is a nominal measurement system based upon Yes/No responses. The alternate measurement paradigm I am suggesting in this paper is one that is more ordinal in nature where we expand the Yes/No response to include gradients of the particular rule. In the next paragraph, I provide an example of a rule that could be measured in moving from a nominal to ordinal scale measurement schema.
Rather than only measuring a rule in an all or none fashion, this alternate paradigm provides a more relative mode of measurement at an ordinal level. For example, with a professional development or training rule in a particular state which requires, let’s say, 6 hours of training for each staff person. Rather than having this only be 6 hours in compliance and anything less than this is out of compliance, let’s have this rule be on a relative gradient in which any amount of hours above the 6 hours falls into a program quality level and anything less than the 6 hours falls out of compliance but at a more severe level depending on how far below the 6 hours and how many staff do not meet the requirement (prevalence). Also throw in a specific weight which adds in a risk factor, and we have a paradigm that is more relative rather than absolute in nature.
From a math modeling perspective, the 1 or 0 format for a Yes or No response becomes -2, -1, 0, +1, +2 format. This is more similar to what is used in accreditation systems where 0 equals Compliance and -1 and -2 equals various levels of Non-Compliance in terms of severity and/or prevalence. The +1 and +2 levels equal value added to the Compliance level by introducing a Quality Indicator. This new formatting builds upon the compliance vs non-compliance dichotomy (C/NC) but now adds a quality indicator (QI) element. By adding this quality element, we may be able to eliminate or at least lessen the non-linear relationship between regulatory compliance with rules and program quality scores as measured by the Environmental Rating Scales (ERS) and CLASS which is the essence of the Theory of Regulatory Compliance (TRC). It could potentially make this a more linear relationship by not having the data as skewed as it has been in the past.
By employing this alternate paradigm, it is a first demonstration of the use of the Key Indicator Methodology in both licensing and quality domains. The Key Indicator Methodology has been utilized a great deal in licensing but in few instances in the program quality domain. For example, over the past five years, I have worked with approximately 10 states in designing Licensing Key Indicators but only one state with Quality Key Indicators from their QRIS – Quality Rating and Improvement System. This new paradigm would combine the use in both. It also takes advantage of the full ECPQI2M – Early Childhood Program Quality Improvement and Indicator Model by blending regulatory compliance with program quality standards.
A major implication in moving from a nominal to an ordinal regulatory compliance measurement system is that it presents the possibility of combining licensing and quality rating and improvement systems into one system via the Key Indicator Methodology. By having licensing indicators and now quality indicators that could both be measured by licensing inspectors, there would be no need to have two separate systems but rather one that applies to everyone and becomes mandated rather than voluntary. It could help to balance both effectiveness and efficiency by only including those standards and rules that statistically predict regulatory compliance and quality and balancing risk assessment by adding high risk rules.
I will continue to develop this scale measurement paradigm shift in future papers but wanted to get this idea out to the regulatory administration field for consideration and debate. This will be a very controversial proposal since state regulatory agencies have spent a great deal of resources on developing free standing QRIS which build upon licensing systems. This alternate paradigm builds off the Theory of Regulatory Compliance’s key element of relative vs absolute measurement and linear vs non-linear relationships (Fiene, 2022).
2. Introduction to the Regulatory Compliance Scale
The theory of regulatory compliance has been proven in multiple studies over the past four decades and has been utilized extensively in the creation of differential monitoring and its spin off methodologies of risk assessment and key indicators (Fiene, 2025). In fact, differential monitoring would not have been possible without the theory of regulatory compliance because the paradigm which it replaced, one of one-size-fits-all monitoring or uniform monitoring would have predominated. However, with the theory of regulatory compliance which introduced the importance of substantial regulatory compliance and the search for the right rules/regulations that made a difference in client’s lives, rather than emphasizing more or less regulations or rules.
The theory of regulatory compliance has another application when it comes to regulatory compliance measurement in helping to move the licensing field from a nominal based measurement strategy to one of ordinal based measurement. The new measurement strategy is the Regulatory Compliance Scale (RCS) and it is depicted in the following table.
|
RCS |
Compliance |
Risk |
Model |
Model |
|---|---|---|---|---|
|
Scale |
Level |
Level |
Violations |
Weights |
|
7 = A |
Full |
None |
0 |
0 |
|
5 = B |
Substantial |
Low |
1-3 |
1-3 |
|
3 = C |
Medium |
Medium |
4-9 |
4-6 |
|
1 = D |
Low |
High |
10+ |
7+ |
The above table needs some explanation. The first column is the proposed ordinal scale similar to other scales utilized in the program quality measurement research literature on a 1 – 7 Likert Scale where 7 = Full Regulatory Compliance, 5 = Substantial Regulatory Compliance, 3 = Medium Regulatory Compliance, and 1 = Low Regulatory Compliance. It could also be thought of as an Alpha Scale of A – D as well. The next column has the compliance levels that run from full 100% regulatory compliance to low regulatory compliance. The third column depicts the risk level from none to high which corresponds with the compliance levels. The next two columns depict two models, one unweighted and one in which the rules are weighted with corresponding weights. These models are based upon the two prevailing approaches to rank ordering rules or regulations in the research literature.
The following figures will depict how the scale was conceived based upon empirical evidence in the various studies supporting the theory of regulatory compliance.
The first figure shows the actual individual violation data of the programs compared to their corresponding ECERS scores. There is not a significant relationship between the two as depicted in the graphic.
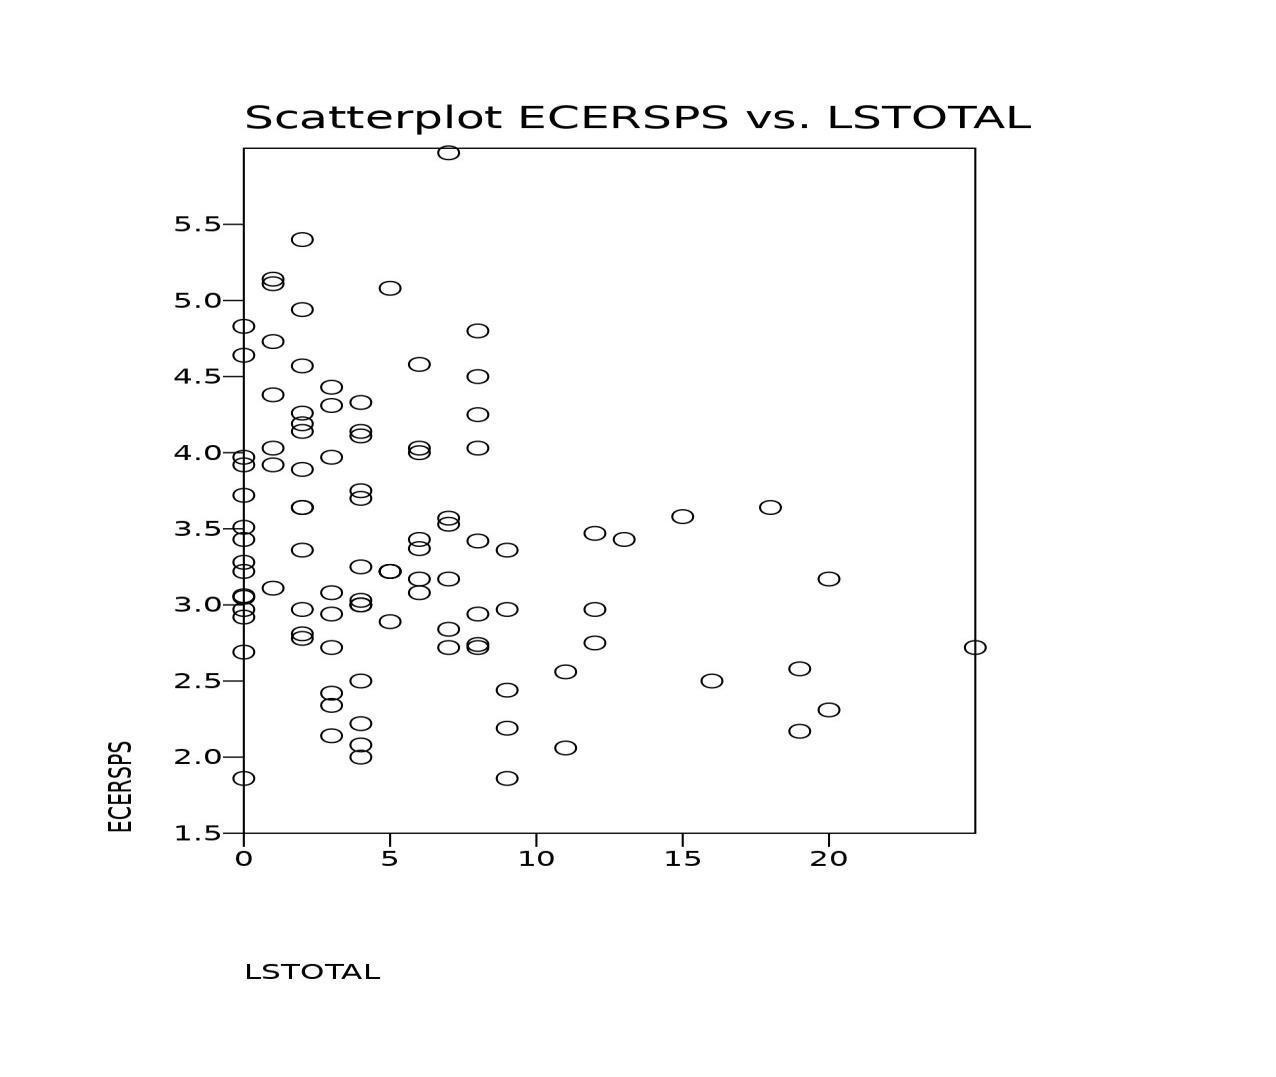
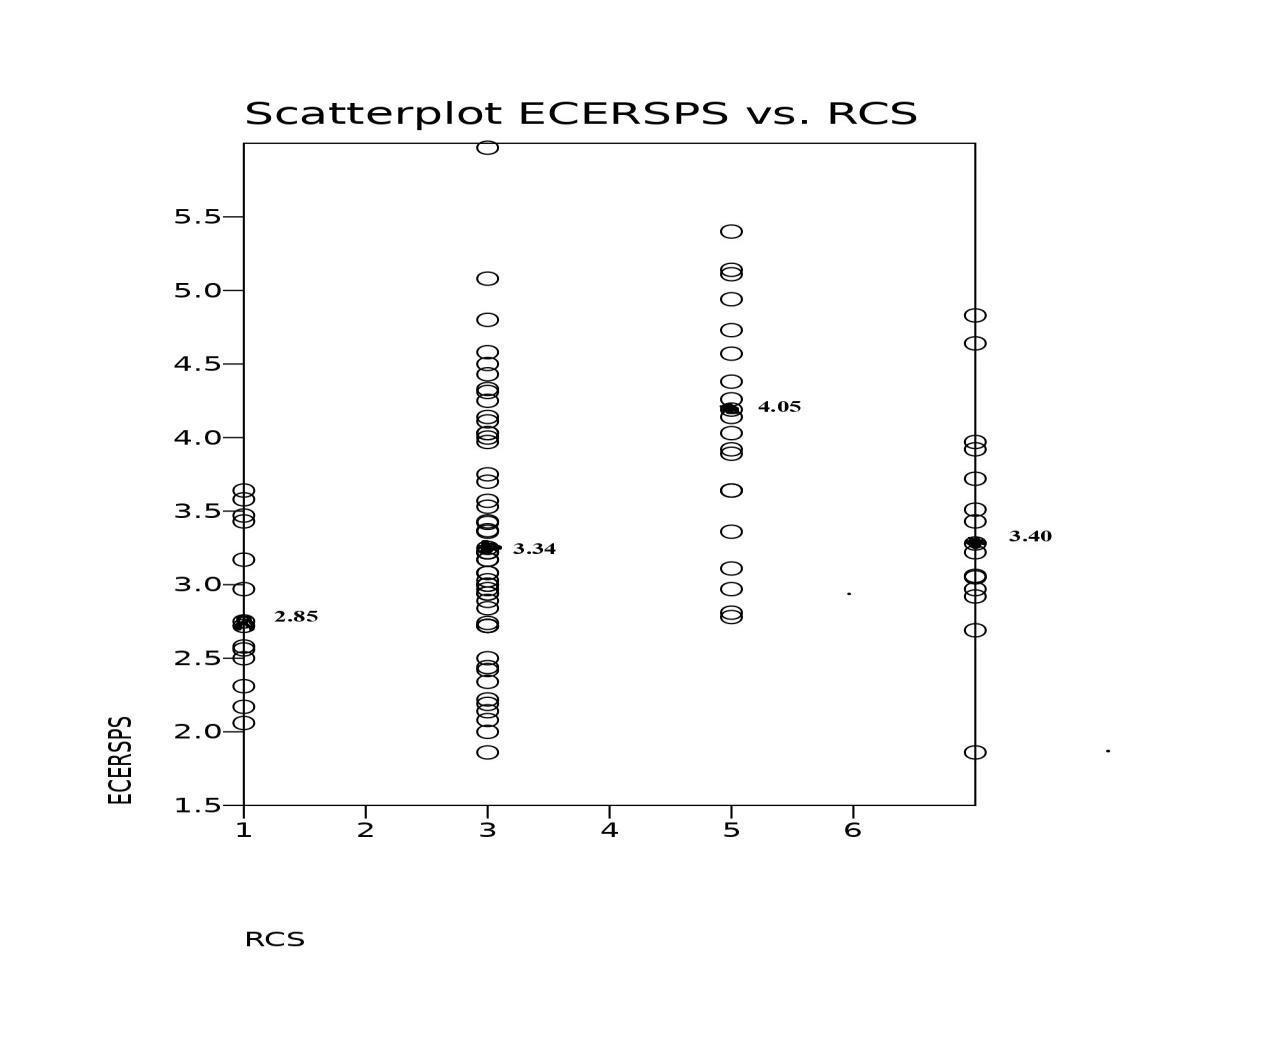
The following figure below depicts what occurs when the individual violation data are grouped according to the theory of regulatory compliance in which a substantial compliance category is introduced, and the data are moved from a nominally based metric to an ordinally based metric of full, substantial, medium, and low regulatory compliance categories. This grouping more clearly reflects the theory of regulatory compliance. It also clearly demonstrates the ceiling effect which is an outcome of the theory of regulatory compliance in which substantial and full regulatory compliance levels are basically equivalent when quality is taken into account. Or at the extreme level which is depicted here where full regulatory compliance quality scores are actually lower than the substantial regulatory compliance quality scores. A footnote about the figures and the scaling: the scales for the first figure are on a lower to higher progression but the higher LSTOTAL represents higher non-compliance where the second figure is also based upon lower to higher but the higher scores represent increased quality and increased regulatory compliance.
So, in reading the change from left to right, these two figures are reversed images of each other. This is just a quirk of the scaling and not a mistake in the plotting of data.
The RCS has been pilot tested in both the unweighted and weighted models and based upon these studies it appears to be more effective in distinguishing quality amongst the various categories rather than utilizing violation count data. This would be a significant improvement when it comes to licensing measurement. Of course, additional replication studies need to be completed before it would be recommended as a new Scale to be used for making licensing decisions.
The above figure is dramatically different than the prevailing paradigm which predicts a linear relationship between regulatory compliance and quality which is the paradigm of a uniform monitoring approach. The above results clearly indicate a reconsideration with the introduction of substantial regulatory compliance as an important contributor to overall quality if not the most important contributor to quality. As stated above, these findings have been replicated in several studies conducted over the past several decades.
This would be a major paradigm shift in moving from individual violation data counts to an ordinal scale metric but it does warrant additional research. The problem with individual violation data is that it doesn’t take into account the relative risk of the individual rule which could place clients at increased risk of morbidity or mortality. Risk assessment has worked really well when coupled with key indicators in the differential monitoring approach and it appears to be an asset in the development of a Regulatory Compliance Scale (RCS).
3. Regulatory Compliance Scale Studies
The Regulatory Compliance Scale (RCS) was introduced several years ago and has been used in a couple of validation studies for differential monitoring and regulatory compliance’s ceiling effect phenomenon. RCS buckets or thresholds were statistically generated based upon these studies, but it is time to validate those buckets and thresholds to determine if they are really the best model in creating a regulatory compliance scale. Since proposing the RCS, there has been a great deal of interest from jurisdictions in particular from Asian and African nations. Additional statistically based trials were conducted, and this brief report is the compilation of those trials over the past year.
The data used are from several jurisdictions that are part of the international database maintained at the Research Institute for Key Indicators Data Laboratory at Penn State University focusing on program quality scores and rule violation frequency data. These data from the respective databases were recoded into various thresholds to determine the best model. The jurisdictions were all licensing agencies in the US and Canada geographically dispersed where both regulatory compliance and program quality data was obtained from a sample of early care and education programs.
Methodology
The following methodology was used starting with the original RCS buckets/thresholds of Full, Substantial, Medium, and Low regulatory compliance:
4. RCS Models Used for Analyses
|
RCS |
|
|
|
Models |
|
|
|
|---|---|---|---|---|---|---|---|
|
|
|
Original |
1 |
2 |
3 |
4 |
5 |
|
|
Full |
100 |
100 |
100 |
100 |
100 |
100 |
|
Scaling |
Substantial |
99-98 |
99-97 |
99-97 |
99-98 |
99-98 |
99-97 |
|
|
Medium |
97-90 |
96-90 |
96-93 |
97-95 |
97-85 |
96-85 |
|
|
Low |
89> |
89> |
92> |
94> |
84> |
84> |
Five alternate models were used to compare the results to the original RCS. The numbers indicate the number of violations subtract from a perfect score of 100. Full regulatory compliance indicates no violations and a score of 100 on the scale. The next bucket of 99-98 indicates that there were 1 or 2 regulatory compliance violations which resulted in a 99-98 score on the scale. This logic continues with each of the models.
The scale score was determined in the following manner: Full Regulatory Compliance = 7; Substantial Regulatory Compliance = 5; Medium Regulatory Compliance = 3; and Low Regulatory Compliance =1. This rubric is how the original RCS scaling was done on a Likert type scale similar to other ECE program quality scales, such as the Environmental Rating Scales.
Results
The following results are correlations amongst the respective RCS Models from Table above compared to the respective jurisdictions program quality tool (Quality1-3): ERS or CLASS Tools.
5. RCS Model Results Compared to Quality Scales
|
RCS results |
Models |
Quality1 |
Quality2 |
Quality3 |
|---|---|---|---|---|
|
Jurisdiction1 |
RCS0 |
.26* |
.39* |
.39* |
|
|
RCS3 |
.21 |
.32* |
.33* |
|
|
RCS5 |
.20 |
.36* |
.33* |
|
Jurisdiction2 |
RCS0 |
.76** |
.46** |
--- |
|
|
RCS3 |
.12 |
-.07 |
--- |
|
|
RCS5 |
.18 |
-.02 |
--- |
|
|
RCSF1 |
.55** |
.29* |
--- |
|
|
RCSF2 |
.63** |
.34 |
--- |
|
Jurisdiction3 |
RCS0 |
.19 |
.18 |
.16 |
|
|
RCS3 |
.21 |
.21 |
.15 |
|
|
RCS5 |
.18 |
.16 |
.07 |
|
|
RCSF1 |
.17 |
.17 |
.10 |
|
|
RCSF2 |
.18 |
.18 |
.19 |
|
Jurisdiction4 |
RCS0 |
.24* |
--- |
--- |
|
|
RCS3 |
.28* |
--- |
--- |
|
|
RCS5 |
.30* |
--- |
--- |
|
|
RCSF1 |
.21 |
--- |
--- |
|
|
RCSF2 |
.29* |
--- |
--- |
|
Jurisdiction5 |
RCS0 |
.06 |
-.02 |
.07 |
|
|
RCS3 |
.06 |
-.01 |
.05 |
|
|
RCS5 |
.08 |
.00 |
.09 |
|
|
RCSF1 |
.00 |
-.03 |
.05 |
|
|
RCSF2 |
.05 |
-.03 |
.05 |
*Statistically significant .05 level;
**Statistically significant .01 level.
In the above table starting under Jurisdiction2, two new models were introduced based upon the
Fibonacci Sequence (Fibonacci1 = RCSF1; Fibonacci2 = RCSF2) and their model structure is in the following Table. The reason for doing this is that the Fibonacci Sequence introduces additional variation into the scaling process.
6. RCS Fibonacci Models
|
RCS Fibonacci |
|
|
Models |
|
|---|---|---|---|---|
|
|
|
Original |
Fibonacci1 |
Fibonacci2 |
|
|
Full |
100 |
100 |
100 |
|
Scaling |
Substantial |
99-98 |
40 |
90 |
|
|
Medium |
97-90 |
20 |
20 |
|
|
Low |
89> |
13 |
13 |
A second series of analyses were completed in comparing the RCS models with program quality (Quality1) by running ANOVAs with the RCS models as the independent variable and program quality as the dependent variable. The reason for doing this was the nature of the data distribution in which there was a ceiling effect phenomenon identified which would have had an impact on the correlations in table above. All results are significant at p < .05 level with the exception of Jurisdiction2.
7. ANOVAs Comparing the RCS Models with Program Quality
|
Jurisdictions |
Model |
Level 1 |
Level 3 |
Level 5 |
Level 7 |
|---|---|---|---|---|---|
|
Jurisdiction1 |
RCS0 |
2.85 |
3.34 |
4.05 |
3.40 |
|
|
RCS3 |
3.24 |
3.23 |
4.05 |
3.40 |
|
|
RCS5 |
2.73 |
3.32 |
3.77 |
3.40 |
|
Jurisdiction2 |
RCS0 |
4.81 |
4.31 |
4.80 |
4.10 |
|
|
RCS3 |
4.59 |
4.25 |
4.80 |
4.10 |
|
|
RCS5 |
--- |
4.26 |
4.64 |
4.10 |
|
Jurisdiction3 |
RCS0 |
4.59 |
4.68 |
4.86 |
4.87 |
|
|
RCS3 |
4.38 |
4.67 |
4.83 |
4.87 |
|
|
RCS5 |
4.38 |
4.83 |
4.83 |
4.87 |
|
Jurisdiction4 |
RCS0 |
37.81 |
37.01 |
44.28 |
41.96 |
|
|
RCS3 |
36.57 |
38.60 |
44.28 |
41.96 |
|
|
RCS5 |
33.46 |
36.53 |
43.10 |
41.96 |
|
Jurisdiction5 |
RCS0 |
3.93 |
4.17 |
4.28 |
4.07 |
|
|
RCS3 |
4.02 |
4.24 |
4.28 |
4.07 |
|
|
RCS5 |
3.75 |
4.13 |
4.26 |
4.07 |
Insights
Based upon the above results, it appears that the original RCS model proposed in 2021 is still the best model to be used, although the Fibonacci Sequence model is a close second in some of the jurisdictions. This model will need further exploration in determining its efficacy as a replacement or enhancement to the original RCS Model.
The bottom line is that the original RCS Model is as good as any and no other model is consistently better than all the rest. The RCS Model does have a slight edge over Regulatory Compliance Violation RCV frequency counts in some jurisdictions but not in others. It is much easier to interpret the relationship between quality and the RCS models than it is to interpret the results from the quality scores and the RCV data distribution. So, the recommendation would be for licensing agencies to think about using this new scaling technique in one of its model formats to determine its efficacy. Pairing up RCS and RCV data side by side by licensing agencies would be important studies to determine which approach is the better approach.
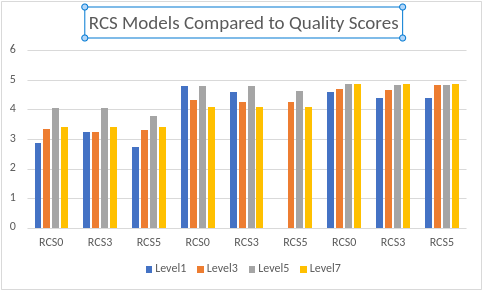
The below graphic depicts the relationship between the RCS Models (0, 3, 5) when compared to the quality scores (1-6) clearly showing the ceiling effect and diminishing returns effect phenomenon so typical of regulatory compliance data when compared to program quality. These graphs are from the first three jurisdictions (1, 2, 3) from the above tables.
8. Additional Analyses Comparing the 11 Studies
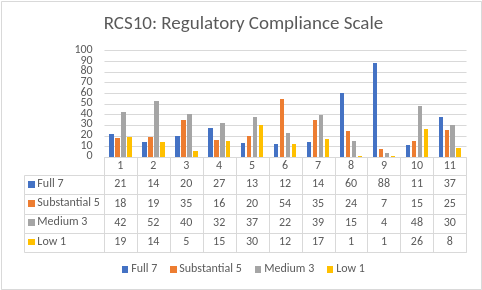
This section provides the results from 11 studies from 10 states and Canadian Provinces in which the proposed new Regulatory Compliance Scale (RCS) was utilized as a byproduct of a differential monitoring implementation or validation study. These studies were undertaken over a decade long period (2013-2023).
The RCS was based upon the following rubric: Full Regulatory Compliance (100%) or no violations = 7; Substantial Regulatory Compliance (99-98) or 1-2 violations = 5; Medium Regulatory Compliance (97-90) or 3-10 violations =3; and Low Regulatory Compliance (89 or less) or 11 or more violations = 1.
These are the results from these 10 jurisdictions which are presented in the following Table (all results are presented as percentages of programs that fell into the scaling 1-7). Under the Studies, the number of the specific study is provided, followed by the sample size, followed by if it is in the USA (US) or Canada (CA).
|
RCS Scale |
|
|
RCS Scaling |
|
|
|---|---|---|---|---|---|
|
Studies |
7=Full |
5=Substantial |
3=Medium |
1=Low |
Comments |
|
1-403-US |
21% |
18% |
42% |
19% |
High Med NC |
|
2-104-US |
14% |
19% |
52% |
14% |
High Med NC |
|
3-422-US |
20% |
35% |
40% |
5% |
OK |
|
4-219-CA |
27% |
16% |
32% |
15% |
OK |
|
5-60-CA |
13% |
20% |
37% |
30% |
High NC/Low C |
|
6-585-US |
12% |
54% |
22% |
12% |
OK |
|
7-255-US |
14% |
35% |
39% |
17% |
OK |
|
8-1399-US |
60% |
24% |
15% |
1% |
Low NC/High C |
|
9-2116-US |
88% |
7% |
4% |
1% |
Low NC/High C |
|
10-482-US |
11% |
15% |
48% |
26% |
High NC/Low C |
|
11-3070-US |
37% |
25% |
30% |
8% |
OK |
In looking at the results, it is preferable to have most of the programs at either a full or substantial regulatory compliance level (7 or 5) and to have fewer programs at the medium or low regulatory compliance level (3 or 1). But in those jurisdictions where there are higher percentages of programs at the medium or low levels of regulatory compliance, it could be that their enforcement of rules and regulations is more stringent. This potential result needs further investigation to get to the root cause of these differences because there is a good deal of variation across the jurisdictions as is evident from the above table.
Based upon the above studies and results, the regulatory compliance scale (Fiene, 2022) which appears from recent studies to be a better metric in measuring regulatory compliance than just counting the number of violations that a program has related to their respective rules, regulations, or standards. So how does the regulatory compliance scale work? It essentially puts violations into buckets of regulatory compliance as follows: full compliance (100%) or no violations; substantial compliance (99-98%) or 1-2 violations; mediocre compliance (97-90%) or 3-9 violations; and lastly low/non-optimal compliance (89% or lower) or 10+ violations. Why buckets, because logically it works, it is the way we think about regulatory compliance. It is a discrete rather than continuous metric and logically fits into these four categories. This is based upon 50 years of research into regulatory compliance data distributions and when the data are moved from frequency counts of violation data into these buckets/categories, the math works very well in identifying the better performing programs.
9. Regulatory Compliance Scale Extensions
Depicted below is a regulatory compliance grid model showing the relationship between regulatory compliance (RC) and program quality (PQ).
An explanation of the below chart will demonstrate how regulatory compliance and program quality in human service facilities interact. The horizontal blue axis depicts the various levels of regulatory compliance while the vertical green axis depicts the various levels of program quality of facilities. It ranges from 1-5 or low to high for each axis. The red “X’s” represents the relationship that has been identified in the research literature based upon the theory of regulatory compliance in which there is either a plateau effect or a downturn in quality as regulatory compliance increases. The one italicized “X” is an outlier that has also been identified in the research literature in which some (it does not happen often) low compliant programs really are at a high-quality level.
It is proposed in order to mitigate the plateau effect with regulatory compliance and program quality standards because regulatory compliance data distributions are severely skewed which means that many programs that have questionable quality are being included in the full (100%) compliance domain. When regulatory compliance standards are increased in their quality components this will lead to a higher level of overall quality as depicted in the “XX” cell all the way on the lower right. It also helps to mi gate the severe skewness in the regulatory compliance data distribution. The data distribution does not approximate a normally distributed curve which is the case with the program quality data distribution.
10. Regulatory Compliance x Program Quality Grid Model
|
PQ/RC -> |
1 Low |
2 Med |
3 Substantial |
4 Full 100% |
5QualityAdditions |
|---|---|---|---|---|---|
|
1 Low |
XXX |
||||
|
2 |
XX |
||||
|
3 Med |
XX |
XXX |
|||
|
4 |
XX |
X |
|||
|
5 High |
X |
XX |
By utilizing this model, it helps to deal more directly in taking a non-linear relationship and making it linear again when comparing regulatory compliance with program quality. This model provides a theoretical approach supporting what many state licensing administrators are thinking from a policy standpoint: add more quality to health and safety rules/regulations. This grid/matrix also depicts the three regulatory compliance models: Linear, Non-linear, and Stepped.
Here is another potential extension of the Regulatory Compliance Scale using the ECPQIM DB – Early Childhood Program Quality Improvement and Indicator Model Database, it is possible to propose developing and using a Regulatory Compliance Scoring System and Scale (RC3S). This new proposed RC3S could be used by state human service agencies to grade facilities as is done in the restaurant arena. Presently, in the human service field, licenses are issued with a Certificate of Compliance but generally it does not indicate what the regulatory compliance level is at. This new proposal would alleviate this problem by providing a scale for depicting the level of regulatory compliance.
The ECPQIM DB is an international database consisting of a myriad group of data sets drawn from around the USA and Canada. It has been in the making over 40 years as of this writing, so its stability and generalizability have been demonstrated. What follows is the chart depicting the RC3S.
11. Regulatory Compliance Scoring System and Scale (RC3S)
|
Color |
Non-Compliance Level |
Regulatory Compliance Level |
|---|---|---|
|
Blue |
0 |
Full Compliance |
|
Green |
1-2 |
Substantial Compliance |
|
Yellow |
3-6 |
Mid-Range Compliance |
|
Orange |
7-9 |
Low Compliance |
|
Red |
10-15+ |
Very Low Compliance |
It is evident from the above chart that the color go from blue to red which indicates an increasing risk of non-compliance and a lower level of overall regulatory compliance, which is not a good thing in the licensing field. Non-compliance levels indicate the number of rules or regulations or standards that are not complied with. And lastly, the regulatory compliance level indicates the movement from full (100% regulatory compliance with all rules) to very low compliance with rules. These ranges for the scaling are based on 40 years of research in understanding and plotting the data distributions around the world related to regulatory compliance in the human services. These results have consistently appeared over this 4-decade time period and show no signs of changing at this point.
12. Regulatory Compliance Scaling for Decision Making
There is a lack of empirical demonstrations of regulatory compliance decision making. In the past, I have used the methodologies of key indicators, risk assessment and the resultant differential monitoring techniques of how often and what should be reviewed for decision making. What has not been addressed is decision making based upon comprehensive reviews when all regulations are assessed. This section addresses how empirical evidence taken from the past 40+ years of establishing and researching a national database for regulatory compliance can help lead us to a new scaling of regulatory compliance decision making.
In analyzing regulatory compliance data, it becomes perfectly clear that the data have very little variance and are terribly skewed in which the majority of programs are in either full or substantial compliance with all the respective regulations. Only a small handful of programs fall into the category of being in low compliance with all the regulations.
The proposed scaling has three major decision points attached to regulatory compliance scores. Either programs are in full or substantial compliance, in low compliance or somewhere in the middle. Full or substantial regulatory compliance is 100% or 99-98% in regulatory compliance. Low regulatory compliance is less than 90% and mid-regulatory compliance is between 97%-90%. These ranges may seem exceptionally large but based upon the national database on regulatory compliance that I maintain at the Research Institute for Key Indicators (RIKILLC) these are the ranges that have formed over the past 40 years. These data ranges should not come as a surprise because we are talking about regulatory compliance with health and safety standards. These are not quality standards; these are basic protections for clients. The data are not normally distributed, not even close as is found in quality tools and standards.
What would a Regulatory Compliance Decision-Making Scale look like:
Data Level Decision_________
100-98% Full/Substantial License
97-90% Mid-Range Provisional
89% or less Low No-License
States/Provinces/Jurisdictions may want to adjust these levels, and the scaling based upon their actual data distribution. For example, I have found certain jurisdictions to have very unusually skewed data distributions which means that these ranges need to be ghten even more. If the data distribution is not as skewed as the above scale, then these ranges may need to be more forgiving.
This regulatory compliance decision making scale does not take into account if abbreviated methodologies are used, such as risk assessment or key indicator models that are used in a differential monitoring approach. The above scale is to be used if a jurisdiction decides not to use a differential monitoring approach and wants to measure regulatory compliance with all regulations and complete comprehensive reviews.
13. Conclusion
The Theory of Regulatory Compliance (Fiene, 2019) and bringing substantial compliance to the forefront of regulatory science has been written about a great deal. This paper builds upon these previous assertions and expands them into some practical applications that can be utilized within regulatory science as it relates to licensing measurement, regulatory compliance scaling, and monitoring systems paradigms. This paper has introduced the Regulatory Compliance Scale which is a departure in how best to measure regulatory compliance. This new scale along with the proposed Uncertainty-Certainty Matrix (Fiene, 2025b) provides a robust licensing measurement and program monitoring strategy. This paper provides the last piece of a differential monitoring approach that includes instrument-based program monitoring, key indicators, risk assessment, and the uncertainty-certainty matrix.
Regulatory Compliance has been always approached as an all or none phenomenon, whether a rule is in compliance, or it is not. There is no in-between or shades of gray or partial compliance. This worked when the prevailing paradigm was that full regulatory compliance and program quality were a linear relationship. This was the assumption but not empirically verified until the later 1970’s-1980’s. When this assumption was put to an empirical test, it did not hold up but rather a curvilinear relationship between regulatory compliance and program quality was discovered. This upset the prevailing paradigm and suggested we needed a new approach to addressing the relationship between regulatory compliance and program quality.
It became clear after these findings in the 1970’s-80’s and then in the 2010’s when replication studies were completed that substantial regulatory compliance could not be ignored based upon this new theory of regulatory compliance in which substantial compliance acted as a “sweet spot” of best outcomes or results when comparing regulatory compliance and program quality scores. The nominal metric needed to be revised and more of an ordinal metric was to be its replacement. Because now it wasn’t just being in or out of compliance, but it mattered which rules were in or out of compliance and how they were distributed. This revised application involved aggregate rules and does not apply to individual rule scoring. The studies completed between 1970 and 2010 involved aggregate rules and not individual rules. To determine if the nominal to ordinal metric needs to be revised still needs empirical data to back this change.
The introduction of substantial compliance into the regulatory compliance measurement strategy moved the field from an instrument-based program monitoring into a more differential monitoring approach. With differential monitoring this approach considered which rules and how often reviews should be done. Also, a new Regulatory Compliance Scale was proposed to take into account the importance of substantial compliance based upon the regulatory compliance theory of diminishing returns. As this Regulatory Compliance Scale has evolved within the licensing health and safety field it needs further revision in which program quality can be infused into the decision making related to individual rules. Remember that the original studies were concerned about rules in the aggregate and not individual rules. It has now become apparent that in dealing with the infusion of quality into rule formulation, a return to the individual rule approach makes the most sense.
The next iteration of the Regulatory Compliance Scale will contain the following categories: Exceeding full compliance, Full compliance, Substantial compliance, and Mediocre compliance to adjust for the infusion of the quality element. This differs slightly from the original aggregate rule Regulatory Compliance Scale where the categories were Full compliance, Substantial compliance, Mediocre compliance and Low compliance where only licensing health and safety elements were considered (see the Table below which depicts the regulatory compliance scales and program monitoring systems side by side).
Without the Theory of Regulatory Compliance, differential and integrative monitoring would not be needed because regulatory compliance would have had a linear relationship with program quality and full compliance would have been the ultimate goal. There would have been no need for targeted rule enforcement or reviews because all rules would have had an equal weight when it came to protecting clients and any individual rule would have predicted overall compliance. But it “just ain’t so” as it is said. The need to make adjustments is brought about by the theory and it has not been the same ever since.
14. Regulatory Compliance Scales and Program Monitoring Systems
|
Scoring Level |
Individual Rule |
|
Aggregate Rules |
Individual Rule |
|---|---|---|---|---|
|
Scale |
Instrument based |
Scale |
Differential |
Integrated |
|
7 |
Full Compliance |
7 |
Full Compliance |
Exceeds Compliance |
|
- |
--- |
5 |
Substantial |
Full Compliance |
|
- |
--- |
3 |
Mediocre |
Substantial |
|
1 |
Out of Compliance |
1 |
Low |
Mediocre/Low |
The above table attempts to summarize in tabular form the previous paragraphs in describing the relationship between program monitoring and licensing measurement scaling via a proposed regulatory compliance scale. As one can see this moves the paradigm from a nominal to an ordinal measurement rubric and depicts the differences in the measurement focus either at the individual rule or aggregate rules scoring levels. It also considers the significance of substantial compliance given the theory of regulatory compliance in which substantial compliance focus is a “sweet spot” phenomenon as identified in the regulatory science research literature. It is hoped that the regulatory science field takes these paradigm shifts into consideration in moving forward with building licensing decision making systems and how licenses are issued to facilities.
As a final footnote, keep in mind that the Theory of Regulatory Compliance applies to the relationship between regulatory compliance and program quality and does not apply to regulatory compliance in and of itself related to health and safety. When dealing with regulatory compliance, full compliance is the ultimate goal with individual rules and in determining which rules are predictive rules. It is the preferred methodology in order to eliminate false negatives and decreasing false positives in making licensing decisions related to regulatory compliance.
These above concepts all relate to the field of regulatory compliance and how to make informed decisions about licensing, particularly in the context of program monitoring. Here's how they connect:
Regulatory Compliance Scales:
These scales move away from a binary "compliant" or "non-compliant" approach to regulations. Instead, they acknowledge degrees of compliance, recognizing that minor deviations may not be as detrimental as major ones.
They provide a framework for evaluating the severity and frequency of non-compliance, allowing for more nuanced licensing decisions.
Instrument Based Program Monitoring (IBPM):
This is the traditional method of monitoring compliance, relying on standardized instruments and checklists to assess adherence to specific rules.
It's a comprehensive approach, but can be time-consuming and inflexible, potentially leading to over-regulation or missing important aspects of program quality.
Differential Monitoring (DM):
This approach takes into account the risk associated with different regulations, focusing monitoring efforts on areas with the highest potential for harm or non-compliance.
It allows for a more efficient use of resources and can be tailored to the specific needs of each program.
DM often utilizes Regulatory Compliance Scales to determine the severity of non-compliance and guide the level of monitoring needed.
Integrative Monitoring Systems (IMS):
These systems go beyond simply checking compliance and aim to assess the overall quality of a program.
They integrate data from various sources, including IBPM, DM, and other program-specific metrics, to provide a holistic picture of performance.
IMS can inform licensing decisions by considering not only compliance but also program effectiveness in achieving its goals.
Here's a simplified analogy to illustrate the relationships:
Think of regulations as traffic rules.
IBPM is like a police officer checking every car for every violation, regardless of severity.
DM is like a police officer focusing on patrolling areas with high accident rates or known reckless drivers.
Regulatory Compliance Scales are like different levels of fines based on the severity of the traffic violation.
IMS is like a traffic management system that collects data on accidents, traffic flow, and road conditions to optimize traffic flow and safety.
Relationships:
RCS forms the foundation for DM and IMS by providing a way to assess degrees of compliance.
IBPM provides data for RCS and can be incorporated (with adaptations) into DM and IMS.
DM builds on RCS and IBPM by differentiating the intensity of monitoring based on risk and compliance.
IMS is the most comprehensive approach, integrating RCS, IBPM, DM, and additional data sources for a deeper understanding of program performance.
Regulatory Compliance Scales can be used within any of the monitoring approaches to provide a more nuanced assessment of compliance.
IBPM can be a starting point for differential monitoring, providing data on rule compliance to inform risk assessments.
Differential monitoring can be integrated into an integrative monitoring system, along with other data sources, to provide a comprehensive picture of program performance.
Here are some additional points to consider:
The choice of the most appropriate approach will depend on the specific context, such as the type of program being regulated and the available resources.
Implementation of these alternative paradigms requires careful planning and training of regulators and program providers.
Ongoing research and evaluation are needed to refine these approaches and ensure their effectiveness.
These alternative paradigms offer a more flexible and effective approach to licensing decisionmaking compared to the traditional IBPM approach. They allow for a better understanding of program strengths and weaknesses, optimize resource allocation, and ultimately lead to better regulatory outcomes.
These concepts offer a shift from traditional "one-size-fits-all" compliance models to more flexible and nuanced approaches that consider risk, program quality, and degrees of compliance. This can lead to more efficient and effective regulatory systems that support program improvement while protecting public safety.
Ultimately, these concepts offer alternative paradigms for licensing decision-making, moving away from a rigid "one-size-fits-all" approach to a more nuanced and risk-based system that considers both compliance and program quality.