The wide use of telecommunications, computers and the internet, especially over the last four decades, has formed a new economic phenomenon, the “Digital Economy”. As a matter of facts, the development of digitalization has raised questions about its contribution to official economic indicators. This research examines the evolution of the information and communication industry (ICI) and its contribution to the national Gross Domestic Product (GDP) of six European entities. Time series and auto-ARIMA models are employed to process the data. Moreover, this study forecasts the development of the ICI in the future. The results demonstrate a clear stable growth in the variable under examination over time, showing an increasingly greater contribution of the ICI to the national GDP in most cases with the exception of Greece, which has a high provisional risk.
- digital economy
- European Union
- information and communication industry
- Gross Domestic Product
- time series
- ARIMA models
1. Introduction
One of the most crucial changes in recent decades is the change to a society based on the internet and digitalization[1]. Nowadays, digitalization is involved in everyday life through the use of smartphones, virtual reality and information networks[2]. The extensive use of the internet, information technology (software and applications) and telecommunications since the early 1990s has created a new economic phenomenon, the “Digital Economy”[3].
The digital economy is characterized by the integration of digital technologies into various aspects of economic life, leading to increased efficiency and the creation of new business models[4]. The application of big data, cloud computing and new algorithms has enabled the rapid exchange of data, streamlined communication, and facilitated the development of platforms that disrupt traditional industries and the structure of the economy. This rapid growth in the information and communication sector necessitates a thorough examination of its impact on economic growth[5]. The American economist and Nobel laureate Robert Solow points to the absence of the computer age in productivity data, although the daily increasing use of digitalization is widely acknowledged. This is mainly because most digital products or services have a non-measurable cost. As a result, their contribution to official economic indicators, which consider only the amount that consumers spend on good or services, is unspecified. However, given the rise in digital-centric economic activities and their growing economic importance, measuring the digital economy is essential[3]. Considering all the above, the question arises about the real contribution of the digital economy to official data and indicators. The purpose of this research is to address this gap by not only examining the development of the digital economy but also forecasting its future evolution within the European Union’s industrial sector.
More specifically, this research examines the development of the digital economy in six entities. The entities consist of five European countries: Sweden, Austria, Germany, Czechia and Greece and the average of the 27 members of the European Union. The selection of these entities was based on their performance on the DESI 2022 index. Except for Germany, the other four counties have approximately the same population. This study extends from 1995 to 2022. Moreover, this paper uses time series ARIMA models to process the data. The website of Eurostat [6] while R 4.4.1 software is employed for the statistical analysis. Finally, this research uses the forecast package to predict the evolution of the information and communication industry (ICI) from 2023 to 2027. The ICI counts the contribution of telecommunications, computer programming, consultancy, information service activities, television production, and publishing activities to the national GDP. The principal conclusions support that there is a stable growth in the ICI during the period under examination, showing a greater contribution to the national GDP in most cases.
This study makes significant contributions to the academic understanding of the digital economy’s impact on traditional economic indicators. This research critiques traditional economic indicators, particularly the GDP, finding their inability to fully capture the contributions of digitalization. This critique is grounded in the observation that digital products and services are often intangible and non-measurable by classical metrics. By focusing on the ICI index across multiple European countries, this research highlights the need to incorporate broader measures of digitalization into economic analysis. This study’s examination of the ICI across five European countries, as well as the average of the 27 E.U. members, allows for a comparative analysis that is often missing in other research, particularly those focusing on single countries like the U.S.A. and China. Unlike recent studies in the context of the European Union[5] this research introduces a methodological advancement by incorporating the forecasting of future developments, enhancing the study of economic evolution. This broader focus of the research offers a more holistic understanding of the digital economy’s role in national economic performance. Moreover, this study’s emphasis on European countries expands the scope of digital economy research, providing a basis for comparative studies across different regions.
2. Literature Review
2.1. The Digital Economy
The digital economy is a dynamic variable which evolves constantly over time due to technological progress. Consequently, since 1996, there have been several definitions that try to describe this new form of economy. The initial definitions identify the digital economy with the broad concept of the internet. Through the years, more and more definitions have been presented. This study employs one of the most recent definitions, which is the “internet and related information and communication technologies (ICT)” and focuses on the industry of digitalization. According to the Organization for Economic Co-operation and Development (OECD), the ICT sector is “a combination of industries and services that receive, transmit and display information and data electronically”. The rapid growth in the digital economy has had a huge impact on business operations and consumer interactions, between companies and customers, aiming to meet their needs.
In recent years, the digital economy has played a leading role in terms of scientific and technological progress[7]. Digitalization triggers technological innovation, market development and industrial integration. The digital sector presents a foundation of digital economies[3] and innovative products and services contribute significantly to the development of the real economy. Technological progress, the outcome of the development of the digital economy, creates various economic and scientific models based on the solution of human problems related to budget deficits, crises, corruption, and social security[7]. These models use nanotechnology, artificial intelligence, robotization and automation to solve economic problems and achieve social equity.
2.2. Measuring the Digital Economy
The various definitions that exist alongside the problems in data quality and the identification of the digital economy in many financial activities make the quantification of the digital economy a demanding process. Another critical issue is the difficulty in measuring the value of digital goods and services at zero cost. A commonly accepted way of measuring the digital economy is ICT. The ICT sector includes activities related to computer manufacture, electronic and optical products, software edition, telecommunications, computer programming and information services.
Regarding the Eurozone, the European Commission has established the Digital Economy and Society Index (DESI) to record the digital performance of the European Union countries compared with other members of the E.U. According to the official website of the European Commission, this index considers four different dimensions: human capital, connectivity, digital integration and digital public services [8].
2.3. Digitalization and National Economies
More and more countries are including the digital economy as one of their main development strategies. Essentially, every country has a duty to apply new technologies and digitalization in the production process and in administration[9]. In 2020, products sold globally through the internet alone were worth USD 14.4 trillion[9]. Moreover, in 2021, the mobile sector accounted for 5% of the global GDP, which is equivalent to USD 4.4 trillion[10]. Finally, 3% of transnational employment and 5% of the international GDP is composed by the digital economy[3].
Regarding the U.S.A. from 2006 to 2016, the digital economy grew by an average of 5.6% per year while the annual growth rate of the whole economy was just 1.5%. In 2016 alone, digitalization contributed to the development of the U.S. GDP by 6.5%, which is equivalent to USD 1209.2 billion; increased the production of goods and services by 6.2%; created 3.9% of new job openings; and raised employee salaries by 6.7%. The volume of the Russian digital economy is estimated to reach to 9.6 billion rubles in 2025, which is approximately 3-fold the amount of 3.2 billion rubles in 2015. Regarding the emerging market of Indonesia, the digital economy has a primary role in the development of the national economy as it contributes to 4% of global e-commerce[11]. Regarding China, the digital economy is a new strategy to trigger technological progress and high-quality development in a country’s economy[12].
Most papers examine the effects of the digital economy in the U.S.A. and China considering only one aspect of digitalization such as the mobile sector, Google or Facebook. The unique nature of this paper is that it considers European countries and employs time series regressions to study the evolution of a non-widely used ICI index which accounts for the contribution of important aspects of economy, like telecommunications, programming and digital activities, to the GDP over the last thirty years. Finally, this research predicts the development of the ICI in the future.
3. Data and Methodology
This research considers the average of the 27 members of the European Union and 5 E.U. countries: Sweden, Austria, Germany, Czechia, and Greece. The selection of these countries was based on the DESI 2022 ranking of the countries, where three of them (Sweden, Austria, Germany) are above the E.U. average while the other two (Czechia, Greece)
are below the mean of the European Union. Moreover, except for Germany, the other four counties have approximately the same population. The time period of the research extends from 1995 to 2022. The employed variable is the “National accounts aggregates by industry (up to NACE)” regarding the ICI. NACE stands for the general nomenclature of the economic activities in the European Communities while the ICI counts the contribution of telecommunications, computer programming, consultancy, information service activities, television production, and publishing activities to the national GDP. Chain-linked volumes are used as the unit of measure and 2015 is the base year. This means that the value of the information and communication variable in 2015 is 100 for all the entities. The website of Eurostat provides the required data[6]. The data were processed appropriately for further
elaboration. R, software for statistical computing and graphics was used for data processing.
4. Results
This section demonstrates the results of this paper. More precisely, the first part of this section refers to the descriptive statistics while the second part shows the predictive models employed.
4.1. Descriptive Statistics
In this subsection, the descriptive statistics of the time series are presented, beginning from the time series plots for each entity (Figure 1).
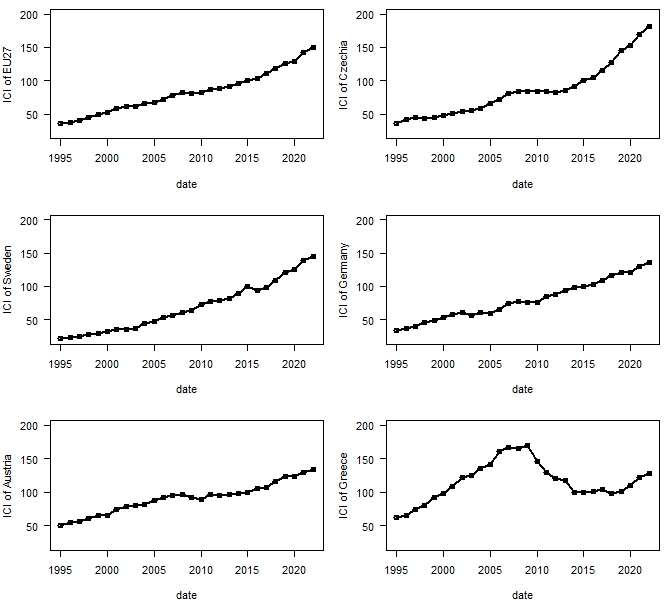
Figure 1. Time series plots of the information and communication industry (ICI) index for the 27 members of the E.U., Czechia, Sweden, Germany, Austria and Greece.
The visualization of the time series reveals similar behavior among all the entities except Greece. Although the 27 members of the E.U., Czechia, Sweden, Germany and Austria have, in some cases, significantly different ICI values (e.g., the ICI of Czechia in 2022 is 180.73 and the ICI of Germany in the same year is 136.54), the overall development of the ICI of these five entities is constantly increasing in time. Czechia seems to show the steepest increasing rate and the highest ICI in 2022 (180.73) compared with Sweden, Germany, Austria and Greece. On the contrary, only Greece shows its highest ICI values in the period 2005–2011 but has a long time period of a significant decrease in the ICI after 2011 and until 2019. Although Greece has very high ICI values overall, as shown in Figure 2, and the highest ICI for a long time period (2005–2011), the current position of the country regarding the digital economy is lower than that of the other five entities included in this study (the ICI of Greece in 2022 is 127.37) due to the significant decrease Figure 1. Time series plots of the information and communication industry (ICI) index for the 27 members of the E.U., Czechia, Sweden, Germany, Austria and Greece. The visualization of the time series reveals similar behavior among all the entities Although the 27 members of the E.U., Czechia, Sweden, Germany and Austria have, in some cases, significantly different ICI values (e.g., the ICI of Czechia in 2022 is 180.73 and the ICI of Germany in the same year is 136.54), the overall development of the ICI of these five entities is constantly increasing in time. Czechia seems to show the steepest increasing rate and the highest ICI in 2022 (180.73) compared with Sweden, Germany, Austria and Greece. On the contrary, only Greece shows its highest ICI values in the period 2005–2011 but has a long time period of a significant decrease in the ICI after 2011 and until 2019. Although Greece has very high ICI values overall, as shown in Figure 2, and the highest ICI for a long time period (2005–2011), the current position of the country regarding the digital economy is lower than that of the other five entities included in this study (the ICI of Greece in 2022 is 127.37) due to the significant decrease in the ICI in 2012–2019.
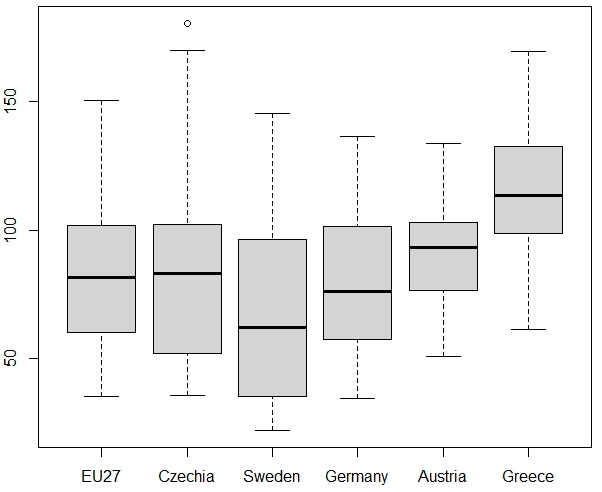
Figure 2. Box plots of the information and communication industry (ICI) index for the 27 members of the E.U., Czechia, Sweden, Germany, Austria and Greece.
4.2. Predictive Models
In this subsection, Autoregressive Integrated Moving Average (ARIMA) models will be employed in order to model the ICI time series and forecast the future behavior of the index. A non-seasonal ARIMA (p, d, q) process is given by the following equation:
ϕ(B)(1 − B)dyt = c + θ(B)εt
where yt is the time series, εt is a white noise process with a mean zero and constant variance, B is the backshift operator, ϕ(B) = 1 − ϕ1B −· · · ϕpBp and θ(B) = 1 + θ1B +· · · + θqBq are polynomials of order p and q, respectively, and d is the order of differencing.
Model selection requires the identification of the parameters p, d, and q and minimizing of information criteria such as Akaike's Information Criterion (AIC). The visualization of the development of the ICI in Figure 1 shows a trend for the ICI time series of 27 members of the E.U, Czechia, Sweden, Germany and Austria, whereas there is no such evidence for the ICI time series of Greece. Moreover, the plot indicates a lack of stationarity, especially for the first five, as the time series does not show a constant mean over time. Additionally, the autocorrelation function (ACF) of the time series of all entities, depicted in Figure 3, shows a very slowly decaying of the ACF of the 27 members of the E.U., Czechia, Sweden, Germany and Austria, indicating non-stationarity, whereas the correlogram of Greece implies an AR component in the model that will be selected.
Furthermore, the Dickey–Fuller test was employed to check if the data for each entity was stationary or non-stationary. The p-values of all the entities were greater than 5% (Table 1), which indicates that all the time series have non-stationary characteristics, but Austria and Greece show the smallest discrepancy from stationarity.
Figure 4 reflects the evolution of the ICI over the examined period for all the entities. The unit of measure is chain-linked volumes and 2015 is considered the base year as its value is 100 in every case. The gray lines show the raw data while the red circles indicate the fitted data. Furthermore, the outlined gray areas in each figure reflect the forecasts of the variable under examination from 2023 to 2027. The forecast R package was employed to fit the predictive ARIMA models and forecast the ICI values of the entities for the next five years with a 95% confidence level.
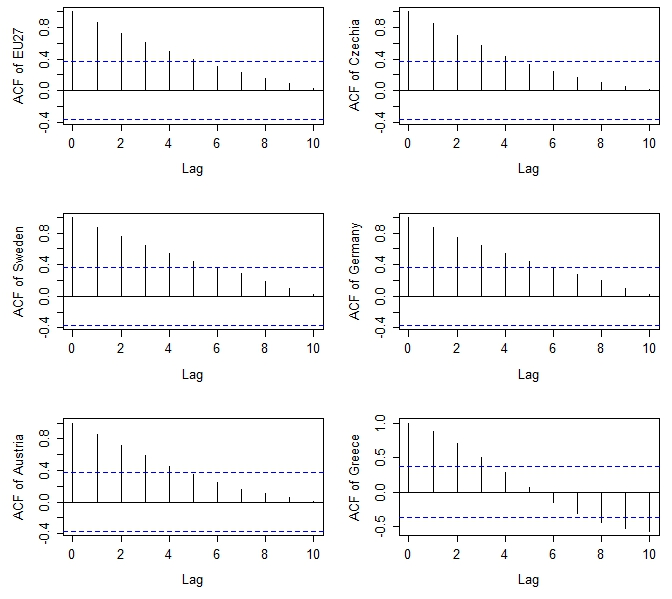
Figure 3. Correlograms of the information and communication industry (ICI) index for the 27 members of the E.U., Czechia, Sweden, Germany, Austria and Greece.
Table 1. Augmented Dickey–Fuller test (lag order = 3).

The general upward trend in five out of six cases is indicated in the figures above except for Greece. More specifically, regarding the cases of Sweden and the average of the 27 members of the European Union, there is a clear increase in the ICI value over time. Furthermore, the average predictions of these two entities for 2023 are above 150 while the average predictions for 2027 exceed the values of 180 and 190, respectively. Austria and Germany show a stable increase during the period under examination which is lower than the average of the E.U. Czechia’s ICI shows the steepest trend among the entities. Finally, the evolution of the variable under examination fluctuates and shows great volatility in the case of Greece. It should be noted that Greece is the 25th out of the 27 member countries in the DESI 2022 index. Moreover, the country faced a serious financial crisis from 2010 to 2017, which explains the sharp decrease in the ICI during this period. Finally, a significant increase is indicated from 2020 onwards, although the value of the variable precrisis is still difficult to reach.
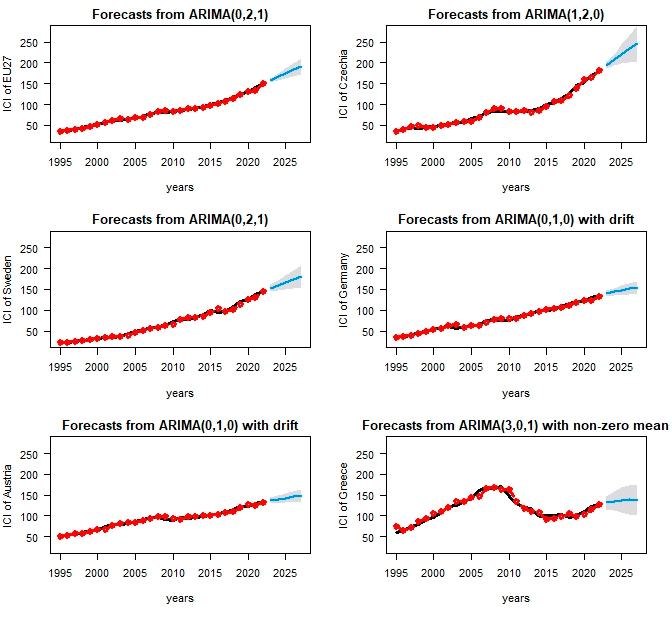
Figure 4. ARIMA fitted models and forecast of the ICI index for the 27 members of the E.U. (θ1 = −0.6279), Czechia (φ1 = −0.5167), Sweden (θ1 = −0.8226), Germany (c = 3.7811), Austria (c = 3.0755) and Greece (φ1 = 1.8759, φ2 = −0.9508, φ3 = −0.0038, θ1 = 0.7607 and c = 9.4255).
At this point, it should be mentioned that chain-linked volumes are used as a unit of measure control for inflation as they show the ICI deflating and use 2015 as the base year. The quality of the fitted models will be verified by residual analysis. The employed forecasting models indicate a proper fit to data as there is no autocorrelation of the residuals according to the Ljung–Box test. The p-values for all the entities are above 5%, with a lag of five time periods. This means that the deviation from the null hypothesis that the residuals are independently distributed is not statistically significant. Consequently, the null hypothesis is not rejected. More precisely, the p-values of the average of the 27 members of the E.U., Czechia, Sweden, Germany, Austria and Greece are 0.922, 0.8691, 0.1206, 0.8189, 0.7772, and 0.9886, respectively.
Additionally, the time series plot of the residuals, their ACF correlogram and the histogram of the residuals for the average of 27 members of the E.U. (with an MA compenent), Czechia (with an AR component), and Greece (with AR and MA compenents) are presented in Figures 5-7, respectively. In all cases, there is no evidence of autocorrelation.
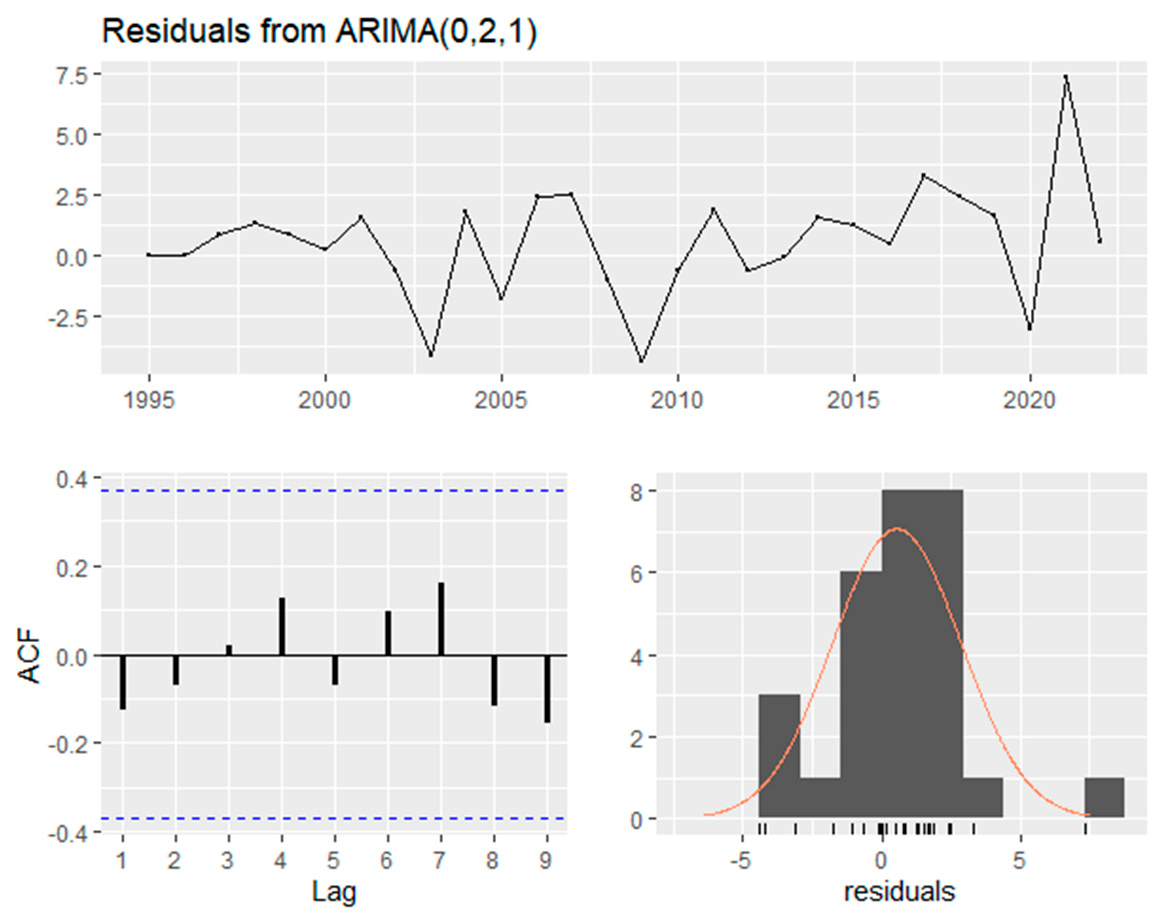
Figure 5. Time series plot, correlogram and the histogram of the residuals of the fitted model for the 27 members of the E.U.
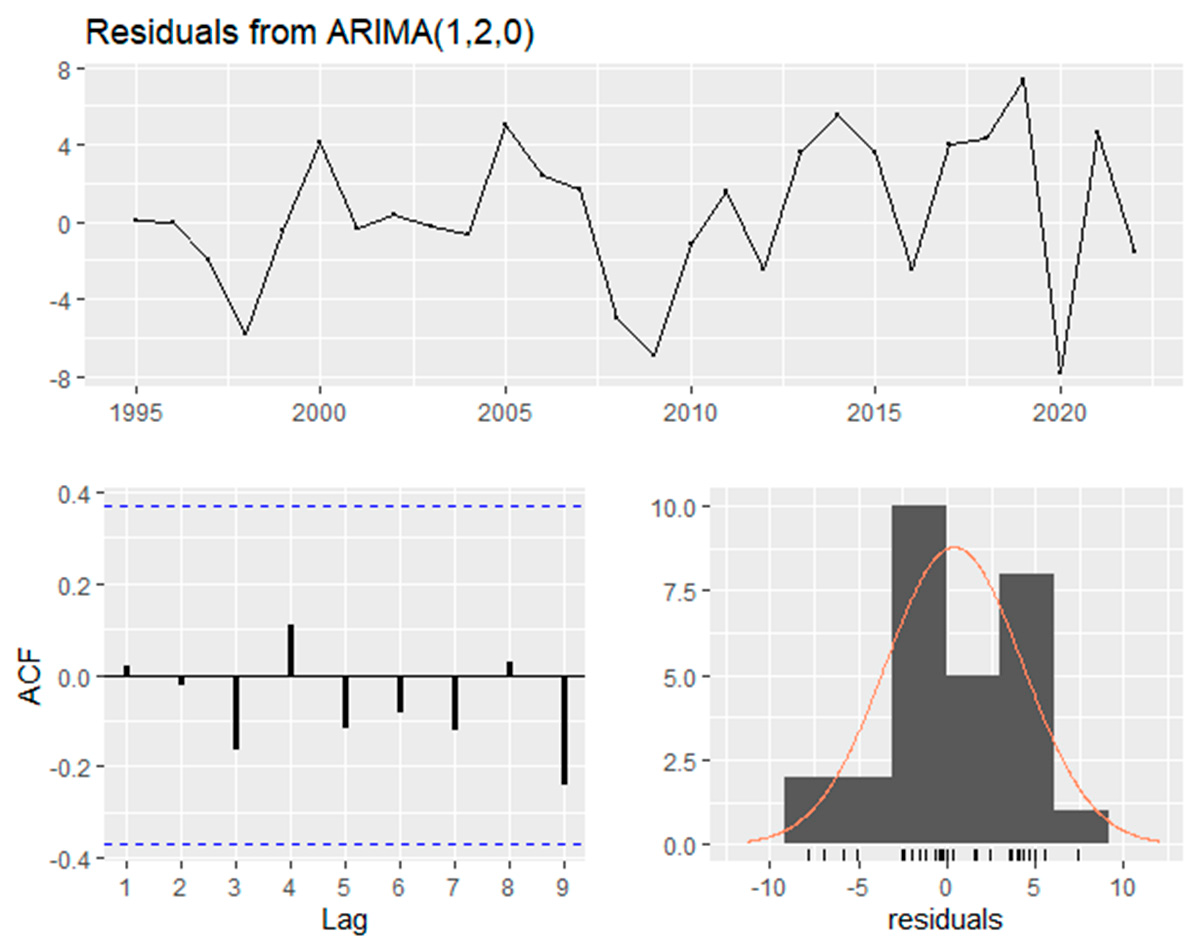
Figure 6. Time series plot, correlogram and histogram of the residuals of the fitted model for Czechia.
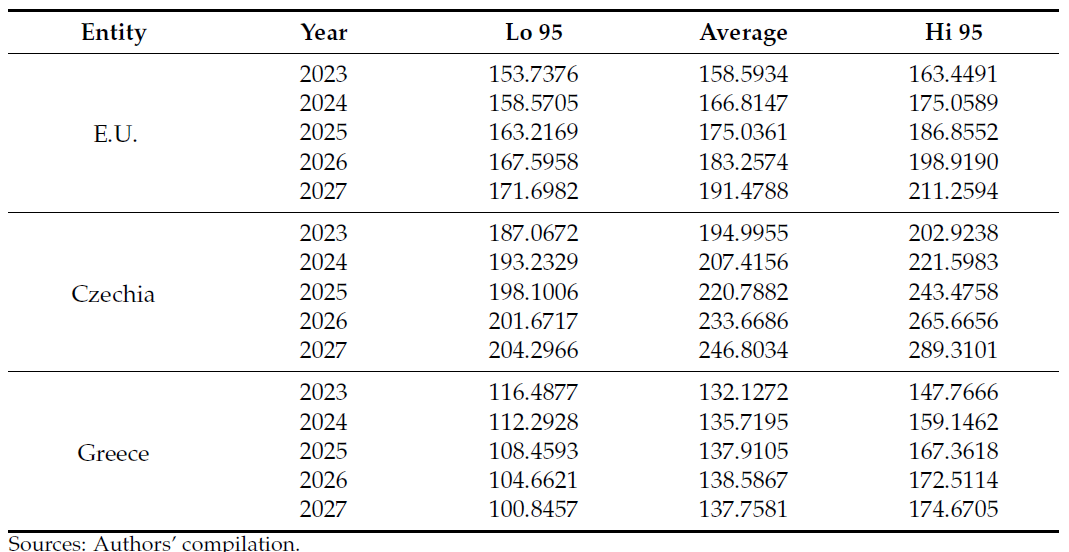
Once again, there seems to be a clear stable increase in the forecasts of the ICI over the years for most of the entities. Regarding Germany and Austria, the averages of the forecasts fluctuate from approximately 140 in 2023 to 150 in 2027. Moreover, there are cases like Sweden and the average of the 27 members of the E.U., in which the forecasts from 2023 to 2027 exceed the value of 150, which suggests that the contribution of the ICI to the GDP is more than 50% greater than its value in the base year of 2015 in both entities. There are even cases like the average of the E.U. members in 2027 and Czechia from 2024 to 2027 in which the forecasts approach or even exceed the value of 200. This suggests that the contribution of the variable under examination to the GDP is approximately 2-fold higher than that of the base year 2015. It should be noted that, especially in the case of Czechia, the forecasts of the ICI show the greatest increase among the entities as their value reach approximately 247 on average in 2027. Regarding Greece, the fluctuations and the great volatility of the ICI during the period under examination due to the financial crisis alongside the country’s low score in the DESI 2022 index have affected the forecasts of the entity. The averages of the predictions of this entity fluctuate from 132 in 2023 to 137 in 2027. Consequently, the increase in the ICI in Greece is much smoother than that of the other entities and, during the last three years of the forecasts, there seems to be stability in the value of the variable. Moreover, great volatility is also confirmed by the large width of the forecasts’ gray area in Figure 7. This great volatility implies a high forecasting risk regarding the Greek digital economy, which seems to be extremely unsure and may have consequences in the growth in the whole Greek economy.
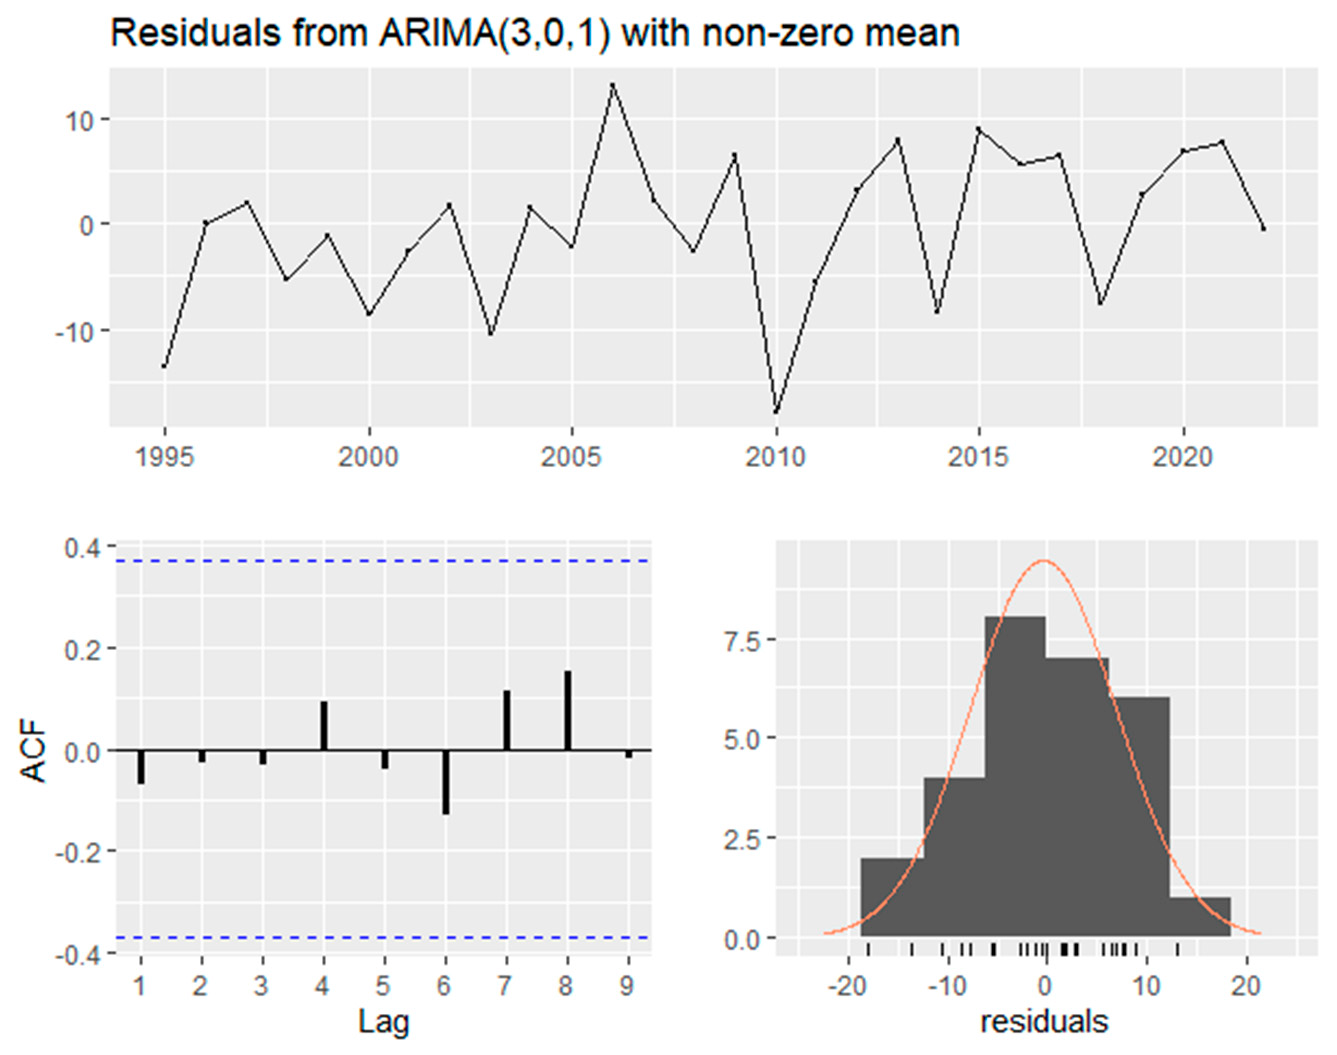
Figure 7. Time series plot, correlogram and histogram of the residuals of the fitted model for Greece.
The forecasts of the ICI of each entity resulting from the forecast package are quoted in Table 2. The lowest, average and highest predictions are estimated with a 95% confidence level.
Table 2. ICI forecasts for all entities.
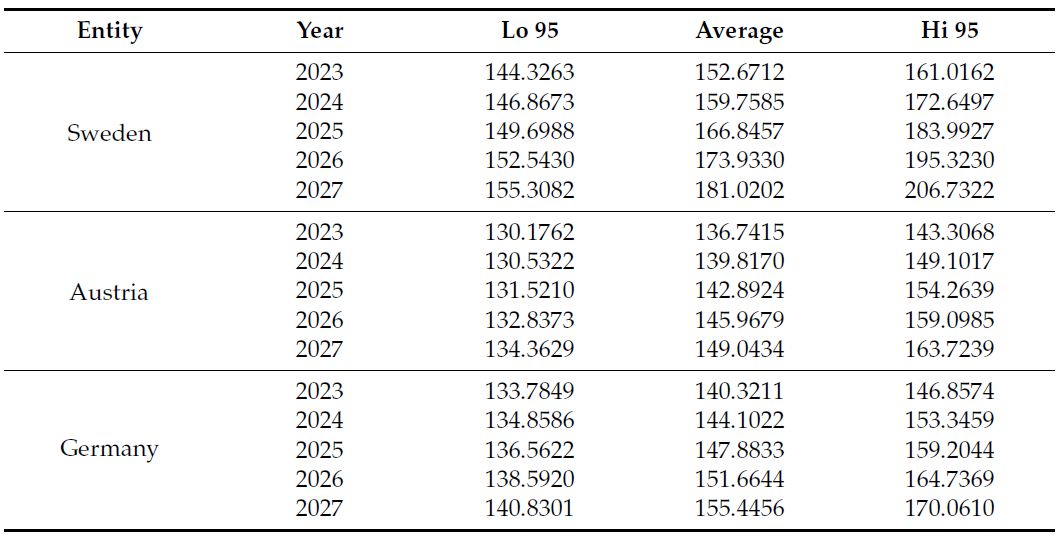
Table 2. Cont.
5. Discussion and Conclusions
Over the last four decades, the wide use of computers, the internet and telecommunications has formed a new economic phenomenon, the “Digital Economy”. Although our society is based on information technology, there is a lack of investigation regarding the contribution of digitalization to official economic indicators. The main reason for this absence is because digital products and services are non-measurable and, consequently, classical economic indicators, like the GDP, are unable to incorporate the benefits of digitalization. However, it is commonly accepted that nowadays the growth in the real economy is highly correlated with the development of the digital economy, which is based on the information industry and the internet. As a matter of facts, the purpose of this research is to examine the evolution of the ICI over time and forecast its development and contribution to the GDP in the future. More specifically, this paper examines the development of the ICI in five European countries and in the average of the 27 members of the European Union. This study makes significant contributions to the academic understanding of the digital economy’s impact on traditional economic indicators. By focusing on the information and communication industry (ICI) index across multiple European countries, this research highlights the need to incorporate broader measures of digitalization into economic analysis. The findings show the limitations of conventional metrics, such as the GDP, in capturing the full extent of digital economy contributions. This opens up new opportunities for research in economic measurement and policy development. Unlike recent studies in the context of the European Union [13], this research introduces a methodological advancement by incorporating the forecasting of future developments, enhancing the study of economic evolution. Most studies to date employ only one aspect of digitalization like Google, Facebook or the mobile sector. The use of the ICI as a key metric provides a more comprehensive view of how digital activities contribute to national economies. This broader focus of the research offers a more holistic understanding of the digital economy’s role in national economic performance. Moreover, this study emphasizes European countries. Most papers study the U.S.A. and China. Thus, this paper brings valuable insights into the development of the digital economy within the European Union. This geographical focus expands the scope of digital economy research, providing a basis for comparative studies across different regions.
The results of this study support that there is a clear increase in the ICI value in five out of six entities, especially from 2010 onwards. The only country in which the variable under examination fluctuates and shows great volatility is Greece, which faced a serious financial crisis over the examination period. This fact affected the development of the country’s ICI. Furthermore, the position that each entity possesses in the DESI 2022 index seems to affect the evolution of the ICI.
This is the same for the forecasts in this paper. The predictions show a clear stable increase from 2023 to 2027. In some cases, the values of the chain-linked volumes exceed the price of 200, which is 2-fold higher than that of the base year 2015 and even reaches approximately 247 on average in the case of Czechia in 2027, which shows the greatest trend. This fact indicates the increasingly greater contribution of the ICI to the national GDP. Moreover, these results are aligned with the previous studies that support the idea that different aspects of digitalization contribute to the development of the national economy and justify those which use the digital economy as one of their main development strategies. Once again, due to the financial crisis that the country faced alongside its low score in the DESI 2022 index, Greece’s forecasts show a smoother increase and great volatility in their predictions. Further, from 2025 to 2027, there is stability in the ICI value.
The forecasts indicate a stable and increasing contribution of the ICI to the national GDP in most examined countries. This trend suggests that further investment in digital infrastructure and services can drive economic growth. Governments should prioritize the development of the digital sectors to enhance economic resilience and growth. As a matter of fact, this paper could be used by the stakeholders of the employed methodology and the ICI as guides for forecasting the future development of the digital economy. The forecasts are generally reliable across the studied entities, with the exception of Greece, which shows a high provisional risk. Consequently, the development of the Greek digital economy is extremely uncertain, which may affect the growth in the Greek economy as a whole. Thus, targeted efforts are needed in Greece to stabilize and promote digital development and mitigate potential risks.
Extending this study to more variables that measure the digital economy and examination of the effects of digitalization to other aspects of the national economy, like employment, productivity and household disposable income, would be of great interest for future examination. Finally, the case of Greece may be examined extensively in future research.
References
- Pongsakorn Limna; Tanpat Kraiwanit; Supaprawat Siripipatthanakul; The Growing Trend of Digital Economy: A Review Article. Int. J. Comput. Sci. Res. 2023, 7, 1351-1361, .
- Adriana Grigorescu; Elena Pelinescu; Amalia Elena Ion; Monica Florica Dutcas; Human Capital in Digital Economy: An Empirical Analysis of Central and Eastern European Countries from the European Union. Sustain. 2021, 13, 2020, .
- Luyanda Dube Williams; Concepts of Digital Economy and Industry 4.0 in Intelligent and information systems. Int. J. Intell. Networks 2021, 2, 122-129, .
- Gianmarco Bressanelli; Federico Adrodegari; Marco Perona; Nicola Saccani; Exploring How Usage-Focused Business Models Enable Circular Economy through Digital Technologies. Sustain. 2018, 10, 639, .
- Anastasios I. Magoutas; Maria Chaideftou; Dimitra Skandali; Panos T. Chountalas; Digital Progression and Economic Growth: Analyzing the Impact of ICT Advancements on the GDP of European Union Countries. Econ. 2024, 12, 63, .
- Eurostat. Eurostat. Retrieved 2024-10-2
- Valentyna H. Voronkova; Vitalina A. Nikitenko; Tatyana V. Teslenko; Vlada E. Bilohur; Impact of the worldwide trends on the development of the digital economy. Rev. Amaz. Investig. 2020, 9, 81-90, .
- DESI index. DESI index. Retrieved 2024-10-2
- Mullabayev Baxtiyarjon Bulturbayevich; Mahmudov Baxriddin Jurayevich; THE IMPACT OF THE DIGITAL ECONOMY ON ECONOMIC GROWTH. Int. J. Business, Law, Educ. 2020, 1, 4-7, .
- Global System for Mobile Association. Global System for Mobile Association. Retrieved 2024-10-2
- Amrin Barata; STRENGTHENING NATIONAL ECONOMIC GROWTH AND EQUITABLE INCOME THROUGH SHARIA DIGITAL ECONOMY IN INDONESIA. J. Islam. Monetary Econ. Finance 2019, 5, 145-168, .
- Chenhui Ding; Chao Liu; Chuiyong Zheng; Feng Li; Digital Economy, Technological Innovation and High-Quality Economic Development: Based on Spatial Effect and Mediation Effect. Sustain. 2021, 14, 216, .
- Anastasios I. Magoutas; Maria Chaideftou; Dimitra Skandali; Panos T. Chountalas; Digital Progression and Economic Growth: Analyzing the Impact of ICT Advancements on the GDP of European Union Countries. Econ. 2024, 12, 63, .
