Phosphorus is a major essential element in plants, and absorption and transport of P are related to plant growth and crop productivity. Phosphate (Pi) is absorbed in the roots and then transported to the shoot. Characteristics of Pi absorption, transport, and storage in various parts of the soybeans might be related to plant growth and P-use efficiency. In this research, young nodulated soybean plants were grown in hydroponics with various Pi concentrations. When the soybean plants were grown with 0-500 µM Pi for three days, the Pi absorption rate increased consistently in conjunction with the increase in the Pi concentration; however, the Pi concentrations in the xylem sap increased only from 0 to 50 µM Pi but were constant under higher P concentrations. The absorption rates of 33Pi in the roots were almost the same under light and dark conditions, and those in the decapitated roots were near those of the intact plants. These results indicate that the Pi absorption is not affected by evapotranspiration over a short period. Conversely, the 33P transport from the roots to the shoot was significantly lower under dark conditions than in light conditions. The multiplication value of the 33P concentration in the xylem sap and transpiration rate was almost equivalent to the transport rate of 33P in the intact shoots. The Pi concentration and Pi flux in xylem sap quickly responded to the Pi concentration in the culture solution. These values may be adaptable to estimate the transport rate of P for the diagnosis.
- soybean
- phosphate
- P -deficiency
- roots
- leaves
- nodules
- diagnosis
- xylem sap
- P flux
- transpiration
- Introduction
Phosphorus (P) is an essential component of nucleic acids, lipids, proteins, sugars, energy molecules (ATP and ADP), and NADPH, implying that P has a central role in the structural component of cellular molecules in all organisms. In plants, P plays essential roles in photosynthesis, respiration, and energy transformation, and the regulatory role through the phosphorylation and dephosphorylation of enzymes is vital. P is the second most limiting macronutrient in crop production after nitrogen (N) [1][2]. P is sometimes a limiting factor in the growth and productivity of crops because the available P levels in soils are generally low, and the P mobility in soil is slow [2][3]. Soybeans require a relatively large amount of P, especially during pod set [4]. P is essential for the N2 fixation by the root nodules associated with symbiotic soil bacteria, rhizobia, and there are many reports that the P deficiency restricts nodule formation and nitrogen fixation in soybean plants [5][6][7][8][9]. The phosphorus concentration range for optimum vegetative growth is 3-5 mg based on g dry weight [1]. The main P-deficiency symptom is retarded plant growth, the reduction in leaf expansion [10], and the number of leaves. In addition, the leaf blade may curl up and turn dark green, and flowering and maturity are delayed [4]. The chlorophyll concentration in leaves tended to increase under P deficiency, which differed from N deficiency [11]. P starvation sometimes induces an anthocyanin accumulation in the stems and leaves [12]. The root growth is less restricted under P deficiency than the shoot growth, and, as a result, the shoot/root dry weight ratio decreases [10]. Soybean plants require relatively large amounts of P, especially at the pod-setting stage [4]. The symptoms of P deficiency in soybeans generally cause retarded plant growth, the presence of spindly and small leaves, and sometimes leaves with dark green color [4].
Contrarily, the excess symptoms are not generally observed in the plants grown in soils because Pi is readily fixed by the soil minerals or absorbed by soil microorganisms. However, plants show excess symptoms when grown in solution culture under a high concentration of Pi and show inferior root and shoot growth and leaf burn [13]. Therefore, it is necessary to understand the P absorption, P accumulation, and P transport processes to obtain optimum growth and high yield of soybean plants with the efficient use of P fertilizers. Many food legumes are more sensitive to high concentrations of P, such as a concentration of 3-4 mgP/gDW reported in pigeon pea leaves [1].
Plant roots absorb P from soil solution mainly in H2PO4− in natural pH conditions [3], and plants cannot directly absorb organic-P forms relatively abundant in soil [1]. Plant roots depend on high-affinity phosphate transporters (PHTs) to absorb Pi (inorganic P), and the uptake of Pi is an energy-mediated process driven by a proton-motive force [1]. There are at least 14 PTH1 family gene families in soybean plants [14][15]. Because the Pi concentration in soil is generally low and changes widely, plants have evolved various Pi acquisition mechanisms and complex Pi starvation responses involving biochemical and developmental adaptation [16][17]. Under Pi starvation, the root/shoot ratio generally increases to support root growth and Pi absorption [18]. In addition, the lateral root growth increases despite depressed the tap root growth. P-deficiency increases the length and density of root hair, and the exudation of carboxylate and phosphatase from the roots to solubilize Pi in the soil [19][20][21]. Mycorrhizal symbiosis extends the Pi absorption space and increases the soil volume available for Pi acquisition [3].
The shoots and roots of higher plants depend on each other by exchanging water, mineral nutrients, sugars, amino acids, hormones, and other signal compounds, where xylem and phloem are the two major pathways for transport between the roots and shoots [22]. Concerning the transport processes of P in plants, the absorbed Pi in the roots is transported radially from the epidermis and cortex to the stele in the roots and transported to the shoot through xylem vessels. This upward movement of water and nutrients depends on two driving forces; the first is the evapotranspiration through leaf stomata, in which a negative water potential in leaves pulls water from the roots; and the second is the root pressure, which is a positive pressure from the roots. In addition, surplus Pi absorbed in the roots is tentatively stored in the roots, especially in the vacuoles of the cells [23]. The stored Pi in the vacuole will provide Pi to the growing parts when the external Pi supply is low. Either currently absorbed Pi or stored Pi in the vacuole is transported via xylem vessels from the roots to the leaf blades through stems and petioles. The Pi transported to the leaves may be re-transported to the roots and buds via the phloem. Pi transport pathways in the nodules, two pathways are possible; one is the transport pathway from leaves through phloem vessels, and the other is directly absorption from the nodule surface. In vacuolated cells of higher plants, the vacuole acts as a storage pool of Pi, and, 85 - 95% of the total Pi was reserved in the vacuoles with adequate Pi supply [24]. Therefore, vacuolar Pi can buffer the cytoplasmic Pi level against fluctuations caused by variable external Pi supply or through metabolic activities.
So far, the characteristics of Pi absorption, transport, storage, and release of Pi in various organs of soybean plants are not well known. So, we investigated the changes in the growth and the Pi concentration in each part of soybean plants treated with 50-400 µM Pi for 14 days. Next, soybean plants were cultivated in the culture solution containing 0-500 µM Pi for 3 days, and the effect of Pi concentration on the absorption of Pi and transport of Pi was investigated. Further, the turnover of Pi in each part of the soybean was analyzed after Pi-sufficient and Pi-deficient treatments. Also, the responses in the Pi concentration in xylem sap were investigated after changing the Pi concentration. In addition, we compared the Pi absorption and transport in light/dark conditions to determine the effects of transpiration and root pressure on Pi absorption and Pi transport from roots to the shoot. At last, we propose a new diagnosis of P nutrition using xylem sap Pi concentration and transpiration rate.
- P transport in nodulated soybean plants
2.1 The effects of Pi concentrations on nodulated soybean plants' growth and P status.
Seeds of soybean (Glycine max [L.] Merr., cv. Williams) were inoculated with a suspension of Bradyrhizobium diazoefficience (strain, USDA110), and planted in a vermiculite bed. Soybean seedling on 7 DAP (days after planting) was transplanted into a glass bottle(Figure 1A)with a modified culture solution containing 50 µM K2HPO4 and 1.25 mM KHCO3 to stabilize the pH of culture solution and grown under controlled conditions [13].
(A) (B) (C)
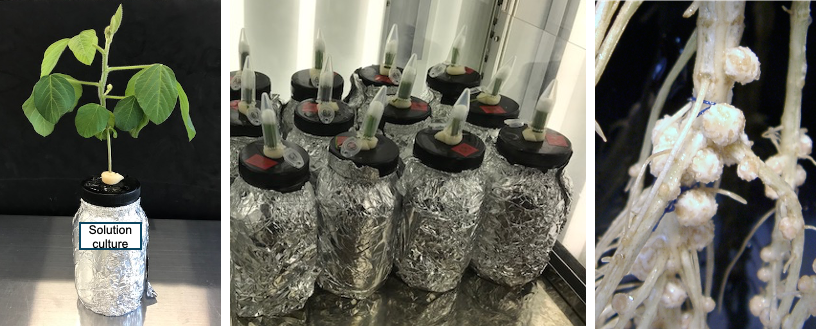
Figure 1. Cultivation of soybean plants and collection of xylem sap from root stamp.
(A) The soybean plant was grown in a 900 mL glass bottle with 800 mL of culture solution. The solution was aerated continuously by an air pump. (B) Xylem sap collection using fine quartz wool in a plastic tube. Xylem sap absorbed in the quartz wool was recovered using an automatic pipet. (C) Root nodules formed in solution culture.
From 33 DAP to 47 DAP, the plants were grown with 50, 100, 150, 200, or 400 µM Pi for 14 days. Figure 2 shows the photographs of shoots, roots, and nodules separate at 47 DAP after 14 days of the P treatments. The root size was smaller in the plants under the 200 and 400 µM Pi treatments than in those under the 50 and 100 µM Pi treatments. Further, the leaf size was smaller in the plants under the 200 and 400 µM Pi treatments than in those under the 50 and 100 µM Pi treatments. The smaller leaves at the lower position became yellow, classified as damaged leaves.
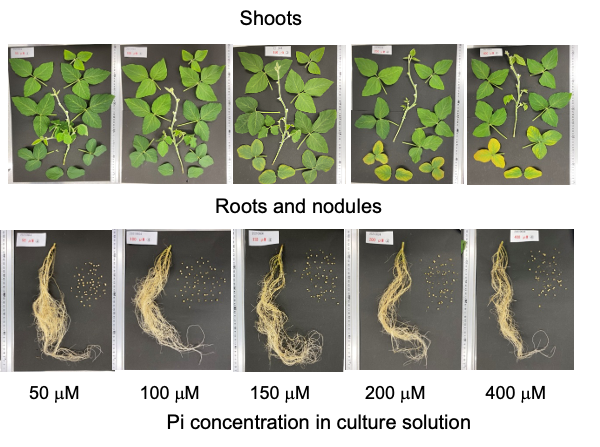
Figure 2. Photographs of the shoot (upper panel) and roots and nodules (lower panel) cultivated with various concentrations of Pi for 14 days. [13]
The total plant dry weight decreased as the concentration of Pi in the solution increased; it was significantly lower in 400 and 200 µM Pi treatments than in 50 and 100 µM Pi treatments (Figure 3). The same was true for the roots, nodules, healthy leaves, and immature leaves. Damaged leaves appeared under the 150, 200, and 400 µM Pi treatments but not under 50 and 100 µM Pi. These results suggest that 50 µM Pi and 100 µM Pi were suitable concentrations for soybean growth under the experimental conditions, the P concentrations higher than 150 µM may cause harmful effects on the growth of roots, nodules, and leaves. Moreover, the leaf colors displayed excess symptoms above 150 µM Pi.
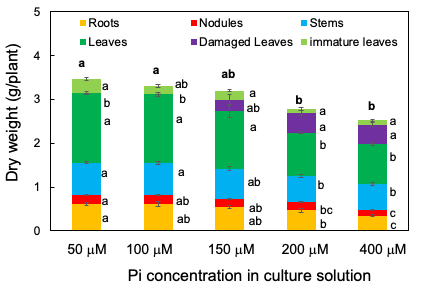
Figure 3. Dry weight of the roots, nodules, stems, leaves, damaged leaves, and immature leaves after growing with various concentrations of Pi for 14 days. [13]
Through 1% HCl extraction, most inorganic anions, namely PO4, SO4, and Cl, and the cations K, Ca, and Mg were found to be extractable. The Organic P, such as P in the form of nucleic acids, phospholipids, etc., remained in the residue. When the Pi concentration in the medium was increased, the concentration of Pi became significantly higher in all the organs (Figure 4). The Pi concentration in the roots grown under the 200 and 400 mM Pi treatments was about 10 times higher than that under the 50 µM Pi treatment. Further, the concentration of Pi in the damaged leaves was about twice that of the healthy leaves under the 200 and 400 µM Pi treatments. Further, the concentrations of organic P in the residue did not significantly differ among the various Pi treatments.
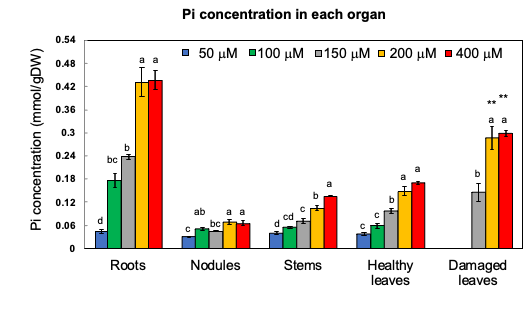
Figure 4. Pi concentration in the roots, nodules, stems, leaves, damaged leaves, and immature leaves after growing with various concentrations of Pi for 14 days. [13]
2.2. Effect of Pi Concentrations in Culture Solution on the P Absorption Rate and P Concentration in Xylem Sap and Each Part of Soybean Plants.
The plants were grown with seven concentrations of Pi, 0, 25, 50, 100, 150, 250, and 500 µM for three days from 27 to 29 DAP, and the Pi absorption rate and Pi transport rate were measured [25]. The Pi absorption rates were determined by the decrease in Pi content in the culture solution. The higher the Pi concentration in the culture solution, the Pi absorption rate increases consistently (Figure 5A). However, the xylem sap collected from soybean plants with higher concentrations of Pi in the medium at 100, 150, 250, and 500 µM were almost the same as that in 50 µM (Figure 4B). This result demonstrated that the Pi absorption and transport are differentially controlled processes in soybean plants.
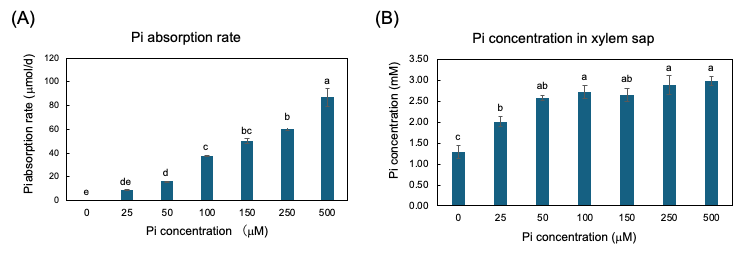
Figure 5. Pi absorption rate from culture solution and Pi concentration in xylem sap of soybean plants grown with 0, 25, 50, 100, 150, 250, and 500 μM Pi for three days. (A) Pi absorption rate; (B) Pi concentration in xylem sap. Average and standard error (n = 4). Different letters indicate the significant difference in the values among treatments using Tukey’s method. [25]
The Pi and organic P contents in each part of soybean plants after 3 days of P treatments are shown in Figure 6. In every organ examined, the Pi was the predominant P form compared with the organic P. Even in the 0 µM Pi treatment, a large amount of Pi remained after the 3-day of P deprivation. The higher the P concentration of the culture solution, the more significant the increase in the Pi content of roots and leaves, although the Pi content was constant among Pi treatments in nodules and stems. The content of the organic P was constant in stems, and nodules but significantly increased in the roots and the leaves along with increasing Pi concentrations in the culture solution. These results showed that the extra Pi absorbed mainly accumulated in the roots in the form of Pi and was supplemented in the leaves. Some extra P absorbed in the roots assimilated into organic forms, but those were not remarkable in the leaves, stems, and nodules.
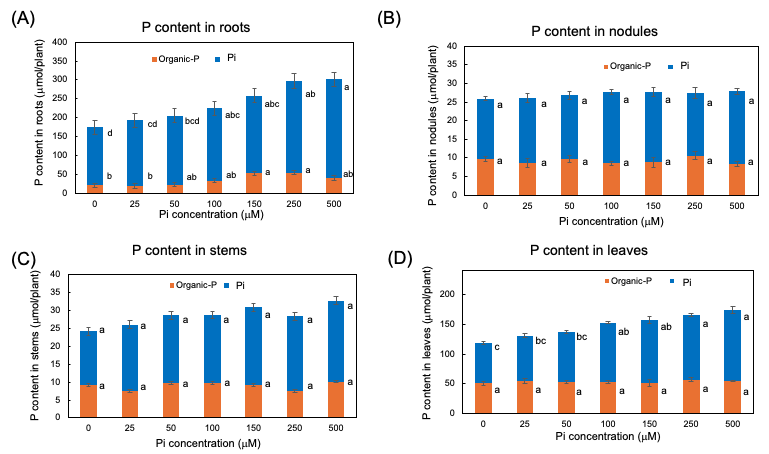
Figure 6. Pi and organic-P content in each part of plants after 3 days of P treatment with 0, 25, 50, 100, 150, 250, and 500 µM Pi in culture solution. (A) P content in roots; (B) P content in nodules; (C) P content in stems; (D) P content in leaves. Average and standard error (n = 4). Different letters indicate the significant difference in the values among treatments using Tukey’s method. [25]
2.3. Effect of period with different Pi concentrations on the P absorption rate and P concentration in Xylem Sap
After 23 DAP, plants were grown with 0 µM, 50 µM, or 250 µM Pi concentrations. The plants were harvested at 1, 3, 7, and 15 days of Pi treatment [25]. As shown in Figure 7, only after one day of 0 mM Pi treatment is the concentration of Pi in xylem sap significantly lower (2 mM) than those of the control 50 µM Pi treatment (3.7 mM) and 250 µM Pi treatment (4.2 mM), suggesting that the P deficiency rapidly reflects the concentration of Pi in xylem sap. At 15 days, the Pi concentrations in the xylem sap of 0 µM Pi treatment further decreased to 0.3 mM.
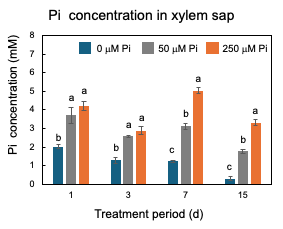
Figure 7. Changes in the Pi concentrations in the xylem sap of nodulated soybean plants cultivated with N-free culture solution. Average and standard error (n = 4). Different letters indicate the significant difference in the values among treatments using Tukey’s method. [25]
2.4. Phosphate Turnover in Various Parts of Nodulated Soybean Plants and the Relation to the Xylem Transport.
Two P treatments were conducted; one was Pi-sufficient treatment in which the plants were grown in a standard solution containing 50 µM K2HPO4 for 14 days during 23-37 days after planting (DAP); another was Pi-deficient treatment, where the plants were grown in a culture solution without Pi in which 50 µM K2HPO4 replaced by 50 µM K2SO4 for initial 7days from 23 DAP to 30 DAP. A group of soybean plants grown under Pi-deficient conditions for 7 days were re-supplied with 50 µM Pi for the successive 7 days from 30 DAP to 37 DAP. The shoot of the plants was decapitated at 1 cm below the cotyledonary node by a razor blade, and the xylem sap exudated from the decapitated stump was collected in quartz wool in a plastic tube for 1 h from 10 AM to 12 AM (Figure 1B) [26]. The transpiration rate was determined by weighing the culture solution in a glass bottle every day before and after cultivation.
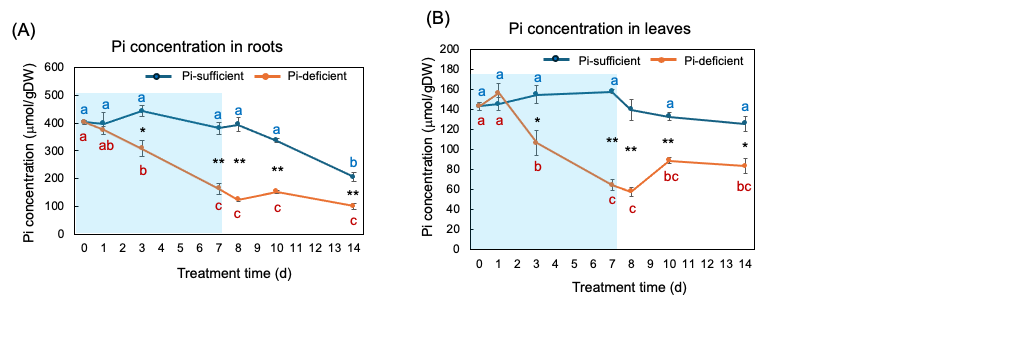
Figure 8 (A) and (B) show the changes in the Pi concentration in the roots and the leaves with Pi-sufficient and Pi-deficient treatments. The Pi concentrations in the roots with Pi-sufficient treatment were constant from day 0 to day 10 at around 400 µmol/gDW but decreased on day 14 (A). The Pi concentration in the roots decreased linearly under Pi-deficient conditions from day 0 (404 µmol/gDW) to day 7 (163 µmol/gDW) during a lack of Pi supply. The Pi concentrations were constant and did not increase after the re-supply of P from day 7 to day 14. The Pi concentrations in the leaves with Pi-sufficient treatment were constant from day 0 to day 14 at around 120-160 µmol/gDW (A). The Pi concentration in the leaves with Pi-deficient conditions decreased linearly from 143 µmol/gDW at day 0 to day 7 (64 µmol/gDW) during a lack of P supply. The Pi concentrations slightly increased after the re-supply of P from day 7 to day 10 but were not statistically significant.
Figure 8. Comparison of Pi-sufficient and Pi-deficient treatments on Pi concentration in the roots (A) and leaves (B). Average ± standard error. Different letters indicate the significant difference in the values among treatment times in Pi-sufficient (blue) and Pi-deficient (red) using Tukey’s Test. * and ** indicate the significant difference in the values at 0.01 < p < 0.05 and p < 0.01 between Pi-sufficient and Pi-deficient treatments by Student’s T-test. The blue background indicates the period of Pi-deficient conditions. n = 3. [26]
The Pi concentrations in the xylem sap in the Pi-sufficient plants tended to decrease from 3.10 mM Pi on day 0 to 2.17 mM Pi on day 14 (Figure 9 A). The xylem sap Pi concentrations in the Pi-deficient plants decreased gradually from day 0 to day 7 (1.29 mM Pi), and the Pi concentrations on day 3 and day 7 were significantly lower than those in Pi-sufficient plants. After the culture solution changed to a Pi-sufficient solution on day 7, the Pi concentrations in the xylem sap of Pi-deficient plants promptly increased from 1.29 mM Pi on day 7 to 2.83 mM Pi on day 8. The Pi concentrations of the P-deficient treatment on day 8, day 10, and day 14 were not different from the Pi-sufficient treatment.
Pi-flux was calculated by multiplying the concentration of Pi and the transpiration rate (Figure 9 B) [26]. The Pi-flux in the Pi-sufficient plants increased from day 1 (1.80 µmol/h) to day 3 (3.98 µmol/h), but it was constant after that. On the other hand, the Pi-flux in the Pi-deficiency plants was constant on day 1, day 3, and day 7 at about 2 µmol/h. However, after changing the culture solution from a Pi-deficient solution to a Pi-sufficient solution on day 7, the Pi-flux increased rapidly to 4.96 µmol/h on day 8.
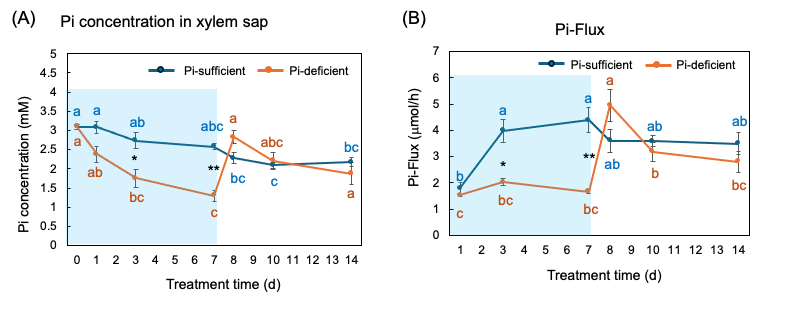
Figure 9. Comparison of Pi-sufficient and Pi-deficient treatments on Pi concentration (A) in the xylem sap and Pi flux (B). Average ± standard error. Different letters indicate the significant difference in the values among treatment times in Pi-sufficient (blue) and Pi-deficient (red) using Tukey’s Test. * and ** indicate the significant difference in the values at 0.01 < p < 0.05 and p < 0.01 between Pi-sufficient and Pi-deficient treatments using the Student’s T-test. The blue background indicates the period of Pi-deficient treatment. n = 3. [26]
2.5. Absorption and Xylem Transport of 33P-Labeled Phosphorus in Nodulated Soybean Plants.
The radioisotope 33P was supplied to the culture solution to trace the absorption and transport of P in nodulated soybean plants monitored using an imaging plate [27]. The absorption rate of 33P was almost the same under the light and dark conditions (Figure 10). In addition, the absorption rate of 33P in the decapitated roots was near that of the intact plants under light. These results indicate that P absorption is not affected by evapotranspiration over a short period. Yamawaki et al. [28] reported that the 32Pi absorption rate in Lotus japonicus roots was the same in the daytime and nighttime and that the transport of 32P in the shoot was higher in the daytime compared with nighttime. Their results in lotus were the same as ours in soybean provided here. Conversely, the 33P transport from the roots to the shoot was significantly lower under dark conditions than in light conditions, although some 33P reached the top of the shoots under both light and dark conditions. The transport of P to the shoots depends on the transpiration supplemented by the root pressure.
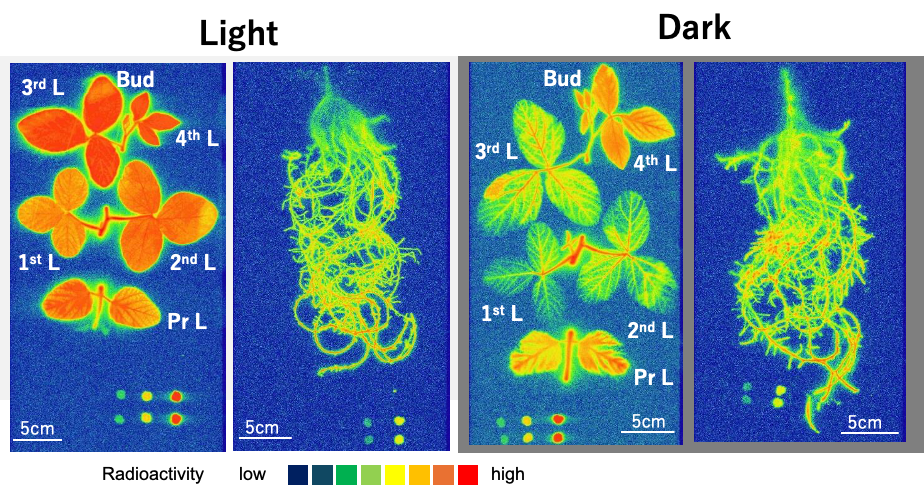
Figure 10. Distribution images of 33P in soybean plants after 4 h 33Pi supply. Color index: The radioactivity is higher in red > orange > yellow > green > blue in this sequence. Pr L, primary leaf; 1st L, first leaf; 2nd L, second leaf; 3rd L, third leaf; 4th L, fourth leaf; Bud, bud. Nodules were detached and placed near the upper right corner. The dots at the bottom show the standard 33P spots. The exposure time for the roots was 1 h, and that for the shoot was 16 h because the radioactivity was much higher in the roots than in the shoot. [27]
The 33P flux was calculated by multiplying the 33P concentration in the xylem sap and transpiration rate. This estimated 33P flux rate was almost equivalent to the transport rate of 33P in the intact shoots (Figure 11). This value may be adaptable and used to estimate the transport rate of P for the diagnosis.
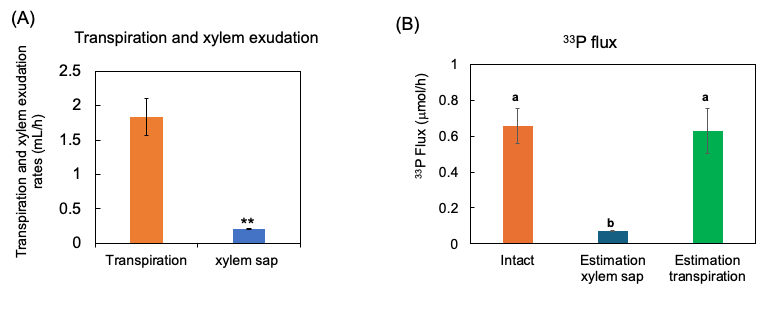
Figure 11. Estimation of 33P flux using 33P concentration of xylem sap in comparison with the 33P flux in the intact plant. (A) The transpiration rate and xylem sap exudation rate. (B) Estimation of the 33P flux based on xylem sap exudation rate and that based on transpiration rate. n = 3. ** indicates statistically significant at p < 0.01 using Student’s t-test. Different letters indicate the significant difference in the values among treatments using Tukey’s method. [27]
2.6. Diagnosis of Pi transport using xylem sap.
In the former section 2.5., the Pi transport rate was estimated based on the transpiration rate determined by the decrease in the weight of the culture solution, however, the same method is not applicable for the measurement of transpiration in the field crops. So, we measure the transpiration rate of detached shoot of the soybean plants used for xylem analysis. The soybean seeds were inoculated with B. diazoefficience USDA110 and planted in the lysimeter soil at the Tokyo University of Agriculture [[29]] on 15 June 2021. Exudating xylem sap from a cut stump was collected for 1 h as shown in Figure 12. The samplings were carried out three times at 10–12 AM and 2–4 PM on 27 July at the beginning of the bloom stage (R1 stage) [27], at 10–12 AM on 31 August at the beginning of the seed stage (R5 stage), and on 28th September at the beginning of the maturity stage (R7 stage). The basal part of the main stem below the cotyledon node was cut using pruning shears, and an aliquot of quartz wool in a plastic tube was used to hold the xylem sap exudated from the cut stump (Figure 12B). The main stem of the shoot was re-cut in water in a bucket to prevent air-block in the xylem vessels, wiped with a paper towel, and then put into the 50 mL plastic tube containing 20 mL of water (Figure 12C). After 15 min, the plant was removed from the tube, the tube was weighed, and the water loss per 1 h was calculated as the transpiration rate (mL/h).
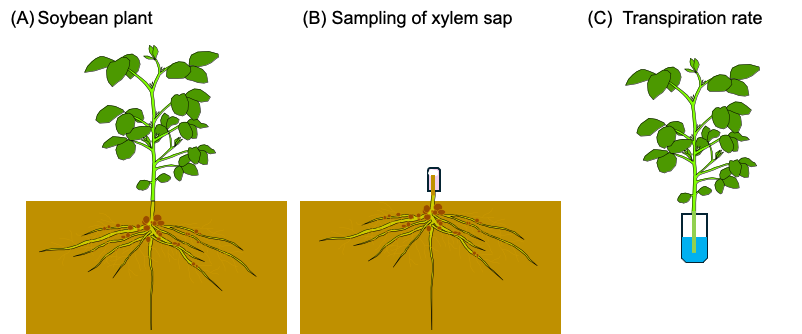
Figure 12. Field estimation of P flux using the P concentration of xylem sap and the transpiration rate measured using the detached plant shoot. (A) Soybean plant cultivated in a field. The shoot was separated from the underground part. (B) Quartz wool in a plastic tube was put on the cut root stump, and the xylem sap was collected for 1 h. (C) The basal part of the main stem of the decapitated shoot was re-cut in water and put in 20 mL of water in a plastic tube. After 15 min, the shoot was removed from the tube. The water loss in the tube was determined by weighing the tube before and after transpiration measurement. [27]
Figure 13A shows the exudation rates of the xylem sap during AM and PM on 27 July, AM on 31 August, and AM on 28 September. The xylem sap exudation rate between AM and PM on 27 July was similar, but they decreased on 31 August and on 28 September. The transpiration rates from the cut shoot during AM and PM on 27 July were the same, but they increased on 31 August and 28 September (Figure 13B). The Pi concentration in the xylem sap collected during the afternoon of 27 July tended to be lower than that collected during the morning (Figure 13C). The Pi concentration in the xylem sap significantly decreased along with the growth stages. Figure 13D shows the estimated Pi-flux at the various stages. The estimation of the P flux is based on the P concentration in the xylem sap and the xylem exudation rate plus the transpiration rate. The P flux during AM on 27 July was 34.2 μmol/h, and it was higher than that during PM on 27 July (19.6 μmol/h), on 31 August AM (15.8 μmol/h), and AM on 28 September (9.3 μmol/h).
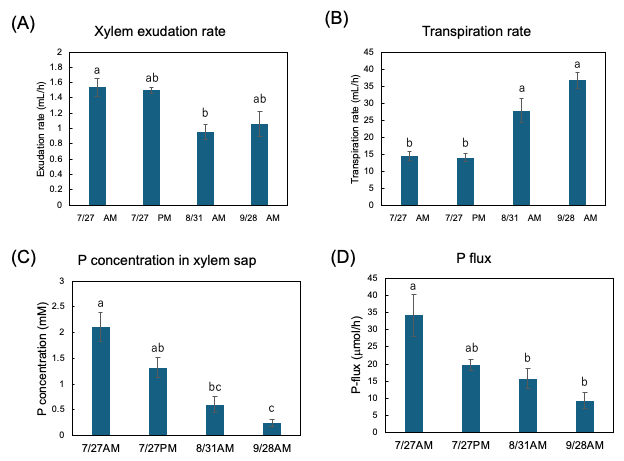
Figure 13. Estimation of P flux using the P concentration of xylem sap and the transpiration rate. (A) Xylem sap exudation rate from cut stump, (B) transpiration rate from decapitated shoot, (C) the Pi concentration in the xylem sap, (D) estimation of the P-flux based on multiplying the nutrient concentration value in xylem sap collected (C) by the sum of the xylem exudation rate (A),
plus transpiration rate (B). Different letters indicate the significant difference in the values among treatments using Tukey’s method. n = 4. [27]
Based on the results, we would like to propose a new estimation of P flux in field-grown soybeans.
P Flux (mmol/h) = P concentration in xylem sap (mM) x (xylem sap exudation rate (mL/h) + transpiration rate by detached shoot (mL/h)).
There have been several methods for collecting xylem sap [30][31][32][33]. Bollard [31] collected xylem sap evacuated from a cut stem to investigate the translocation forms of nitrogen among various dicotyledons, monocotyledons, and gymnosperms. Glutamine and asparagine were dominant in the xylem sap of most species, but some plants contained citrulline or allantoic acid as a principal component. Another method to obtain xylem sap depends on the decapitation of shoots and the collection of the sap that exudates from the cut end of the stump [31]. This “root pressure method” is the simplest way to collect xylem sap, and this technique can be easily applied to field experiments [34][35].
- Conclusions and Prospects
P is a major essential element for crop production, but the available P resources are limited, and efficient P use is vital for sustainable agriculture. Here, we proposed a new diagnosis of P flux in field-grown soybean plants using xylem sap collected from the cut stump and the transpiration rate measured by the cut shoot. Based on the 33P tracer experiment, the estimated P-flux using xylem sap was almost the same as the P transport rate in intact plants. This result indicates that the P concentration in xylem sap collected for a short period of 1h was not changed from the intact xylem sap. This method can be applied to estimate the flux of other nutritional elements, phytohormones, etc. Also, this method may be useful in various crops when the xylem sap can be collected from the cut stamp. Further experiments are required.
References
- Marschner, H. Mineral Nutrition of Higher Plants, 2nd ed.; Academic Press: London, UK, 1986; pp. 1-889.
- Lambers, H.; Phosphorus acquisition and utilization in plants.. Annu. Rev. Plant Biol. 2022, 73, 17-42, .
- Lambers, H.; Plaxton, W.C.; Phosphorus: Back to the roots.. Annu. Plant Rev. 2015, 48, 3-22, .
- Sinclair, J.B. Soybeans. In Nutrient Deficiencies & Toxicities in Crop Plants.; Bennett, W.F., Eds.; APS Press: St. Paul, MN, USA, 1993; pp. 99-103.
- Poirier,Y.; Bucher, M.; Phosphate transport and homeostasis in Arabidopsis. . The Arabidopsis Book 2002, September 30, 2002, e0024, .
- López-Arredondo, D.L.; Leyva-González, M.A.; González-Morales, S.I.; López-Bucio, J.; Herrera-Estrella, L.; Phosphate nutrition: Improving low-phosphate tolerance in crops.. Annu. Rev. Plant Biol. 2014, 65, 95-123, .
- Khan, F.; Siddique, A.B.; Shabala, S.; Zhou, M.; Zhao, C.; Phosphorus plays key roles in regulating plants’ physiological responses to abiotic stresses.. Plants 2023, 12, 2861, .
- Cassman, K.G.; Whitney, A.S.; Stockinger, K.R.; Root growth and dry matter distribution of soybean as affected by phosphorus stress, nodulation, and nitrogen source.. Crop Sci. 1980, 20, 239-244, .
- Israel, D.W.; Investigation of the role of phosphorus in symbiotic dinitrogen fixation.. Plant Physiol. 1987, 84, 835-840, .
- Fredeen, A.L.; Rao, I.M.; Terry, N.; Influence of phosphorus nutrition on growth and carbon partitioning in Glycine max.. Plant Physiol. 1989, 89, 225-230, .
- Rao, I.M.; Terry, M.; Leaf phosphate status, photosynthesis, and carbon partitioning in sugar beet. I. Changes in growth, gas exchange, and Calvin cycle enzymes.. Plant Physiol. 1989, 90, 814-819, .
- Mo, X.; Zhang, M.; Zhang, Z.; Lu, X.; Liang, C.; Tian, J.; Phosphate (Pi) starvation up-regulate GmCSN5A/B participates in anthocyanin synthesis in soybean (Glycine max) dependent on Pi availability.. Int. J. Mol. Sci. 2021, 22, 12348, .
- Ohyama, T.; Takayama, K.; Akagi, A.; Saito, A.; Higuchi, K.; Sato, T.; Development of an N-free culture solution for cultivation of nodulated soybean with less pH fluctuation by the addition of potassium bicarbonate.. Agriculture 2023, 13, 739, .
- Qin, L.; Guo, Y.; Chen, L.; Liang, R.; Gu, M.; Xu, G.; Zhao, J.; Walk, T.; Liao, H.; Functional characterization of 14 Pht1 family genes in yeast and their expressions in response to nutrient starvation in soybean.. PLoS ONE 2012, 7, e47726, .
- Tamura, Y.; Kobae, Y.; Mizuno, T.; Hata, S.; Identification and expression analysis of arbuscular mycorrhiza-inducible phosphate transporter genes of soybean.. Biosci. Biotechnol. Biochem. 2012, 76, 309-313, .
- Puga, M.I.; Rojas-Triana, M.; de Lorenzo, L.; Leyva, A.; Ruvio, V.; Paz-Ares, J.; Novel signals in the regulation of Pi starvation responses in plants: facts and promises.. Current Opinion in Plant Biology 2017, 39, 40-49, .
- Chien, P.-S.; Chiang, C.-P.; Leong, S.J.; Chiou, T.-J.; Sensing and signaling of phosphate starvation: from local to long distance.. Plant Cell Physiol. 2018, 59, 1714-1722, .
- Goldstein A., Danon A., Baertlein D. & McDaniel R.; Phosphate starvation inducible metabolism in Lycopersicon esculentum II. characterization of the phosphate starvation in-ducible excreted acid phosphatase. . Plant Physiol. 1988, 87, 716-720, .
- Lambers, H.; Shane, M.W.; Cramer, M.D. et al.; Root structure and functioning for efficient acquisition of phosphorus: matching morphological and physiological traits.. Annals of Botany 2006, 98, 693-713, .
- Bates, T.R.; Lynch, J.P.; Stimulation of root hair elongation in Arabidopsis thaliana by low phosphorus availability.. Plant Cell Environ. 1996, 19, 529-538, .
- Mo, X.; Liu, G.; Zhang, Z.; Liang, C.; Tian, J.; Mechanisms underlying soybean response to phosphorus deficiency through integration of omics analysis. . Int. J. Mol. Sci. 2022, 23, 4592, .
- Baslam, M.; Mitsui, T.; Sueyoshi, K.; Ohyama, T.; Recent advances in carbon and nitrogen metabolism in C3 plants.. Int. J. Mol. Sci. 2021, 22, 318, .
- Yang, S.Y.; Huang, T.K.; Kuo, H.F.; Chiou, T.J.; Role of vacuoles in phosphorus storage and remobilization.. J. Exper. Bot. 2017, 68, 3045-3055, .
- Bieleski, R.L.; Effect of phosphorus deficiency on levels of phosphorus compounds in Spirodela.. Plant Physiol. 1968, 43, 1309-1316, .
- Yamamura, Y.; Higuchi, K.; Saito, A.; Ohyama, T.; Absorption and transport of phosphorus in nodulated soybean plants and diagnosis of phosphorus status using xylem sap analysis.. Agriculture 2024, 14, 403, .
- Yamamura,Y.; Higuchi, K.; Saito, A.; Ohyama, T.; Phosphate turnover in various parts of nodulated soybean (Glycine max (L.) Merr.) plants and the relation to the xylem transport.. Crops 2024, 4, 413-425, .
- Yamamura, Y.; Nara, S.; Higuchi, K.; Saito, A.; Ohyama, T.; Absorption and Xylem Transport of 33P-Labeled Phosphorus in Nodulated Soybean Plants.. Agriculture 2024, 14, 1104, .
- Yamawaki, M.; Kanno, S.; Ishibashi, H.; Noda, A.; Hirose, A.; Tanoi, K.; Nahanishi, T.M.; A study of 32P-phosphate uptake in a plant by a real-time RI imaging system.. Proc. Radiochem. 2011, 1, 289-293, .
- Ohyama, T.; Ikebe, K.; Okuoka, S.; Ozawa, T.; Nishiura, T.; Ishiwata, T.; Yamazaki, A.; Tanaka, F.; Takahashi, T.; Umezawa, T.; et al. A deep placement of lime nitrogen reduces the nitrate leaching and promotes soybean growth and seed yield. . Crop Environ. 2022, 1, 221-230, .
- Schurr, U.; Xylem sap sampling-new approaches to an old topic. . Trends Plant Sci. 1998, 3, 293-298, .
- Bollard, E.G.; Translocation of organic nitrogen in the xylem.. Aust. J. Biol. Sci. 1957, 10, 292-301, .
- Alexou, M.; Peuke, A.D. Methods for xylem sap collection. Chapter 13. In Plant Mineral Nutrients: Methods and Protocols, Methods in Molecular Biology; Maathuis, J.M., Eds.; Springer Science+Business Media, LLC: Berlin/Heidelberg, Germany, 2013; pp. volume 953.
- Takamatsu, T.; Watanabe, M.; Koshikawa, M.K.; Convenient sampling of xylem sap from adult tree trunks and analysis of its components.. Forests 2023, 14, 389, .
- Takahashi, Y.; Chinushi, T.; Nakano, T.; Ohyama, T.; Evaluation of N2 fixation activity and N absorption activity by relative ureide methods in field-grown soybean plants with deep placement of coated urea.. Soil Sci. Plant Nutr. 1992, 38, 699-708, .
- Sakazume, T.; Tanaka, K.; Aida, H.; Ishikawa, S.; Nagumo, Y.; Takahashi, Y.; Ohtake, N.; Sueyoshi, K.; Ohyama, T.; Estimation of nitrogen fixation rate of soybean (Glycine max(L.) Merr.) by micro-scale relative ureide analysis using root bleeding xylem sap and apoplast fuid in stem.. Bull. Facul. Agric. Niigata Univ. 2014, 67, 27-41, .
