Magneto-resistance data R(T, B) obtained at temperatures in the range 4.2 K ≤ T ≤ 150 K (applied magnetic fields ranging from 0 to 7 T) were analyzed in the framework of the fluctuation-induced conductivity (FIC) approach using the models of Aslamazov-Larkin (AL) and Lawrence-Doniach (LD). From the R(T, B) curves we determine in a first instance the residual resistivity ρ0, the normal-state resistivity ρn(T), the mean-field transition temperature TcMF (here due to the appearance of two peaks in dρ/dT called Tc1mid and Tc2mid), the temperature T* (the deviation from the linear resistance behavior), and the characteristic temperatures Tconset and Tcoffset. The data of 10% ρn yield information on the irreversibility line (Hirr(T)), and the data of 90% ρn give information on the upper critical field, Hc2(T).
This material then serves to obtain the fluctuation induced conductivity (FIC) or excess conductivity. The resulting FIC curves for each applied magnetic field reveal the presence of five distinct fluctuation regimes above the temperature Tcmid, namely, the short-wave (SWF), one-dimensional (1D), two-dimensional (2D), three-dimensional (3D), and critical (CR) fluctuation domains. The analysis of the FIC data enable the coherence length in the direction of the c-axis at zero-temperature (ξc(0)), the lower and upper critical magnetic fields (Bc1, Bc2), the critical current density at T = 0 K (Jc(0)) and several other parameters describing the the material’s superconducting properties to be determined. A proper knowledge of the microstructure of the YBCO foam sample contributes to the understanding of the present data. It is revealed that the minuscule Y-211 particles found along the YBCO grain boundaries alter the excess conductivity and the fluctuation behavior as compared to conventional YBCO samples, leading to a quite high value for Jc(0) for a sample with a non-optimized pinning landscape.
- YBCO
- foam
- excess conductivity
- superconductors
1. Introduction
Open-cell, superconducting YBa2Cu3Oy (YBCO or Y-123) foams are a very interesting type of superconducting material for several possible applications, e.g., for fault-current limiters [1–3] or space applications [4–6], as the porosity of the open-cell foams brings out several advantages over conventional, bulk superconducting samples. This is manifested in an effective cooling process, an easy and quick oxygenation procedure and a low sample weight. The special properties of (nano-)porous and foam-type superconducting samples were recently reviewed in Refs. [7,8].
YBCO foams were fabricated in a two-step process. The first step involved the fabrication of a Y2BaCuO5 (Y-211) foam by coating a polyurethane foam with a slurry consisting of Y-211 powder, dissolved in a mixture of polyvinylalcohol (PVA) and demineralized H2O. The resulting green Y-211 foams were then subjected to an infiltration growth process together with a Nd-123 seed crystal as described in Refs. [9,10].
Struts from the large YBCO foam sample were broken out and Electrical contacts to the foam struts were made by gold wires and silver pastewith an additional baking process at 150 °C to achieve small contact resistivities. Resistance was measured in a Physical Property Measurement System (PPMS) with 9 T applied magnetic field (Quantum Design) using the standard four probe terminalmethod. Excitation currents (1 – 10 mA) were injected along the major length of the foam strut.
- Results
Magneto-resistance and FIC measurements provide important information on the material properties, especially details on the superconducting transition, but also information on the normal state resistivity, the connectivity, the RRR, which give ideas about the current paths, the percolation and phonon scattering at grain boundaries.
The excess conductivity analysis can provide detailed information on the transition to the superconducting state from temperatures well above the critical temperature, Tc. The resistivity curves of high-temperature superconducting (HTSc) materials exhibit a pronounced rounding around the superconducting transition, which is due to the high anisotropy, the short coherence lengths, and the low density of charge carriers [11]. Thus, it becomes possible to probe the fluctuations of the superconducting Cooper pairs in a wide temperature range beyond Tc. As result, several microscopic properties of HTSc materials can be accessed experimentally.
Figure 1. Resistivity ρ(T) as function of temperature for an YBCO foam strut without an applied magnetic field (μ0Ha = 0, ■). The red line shows the determination of ρn(T) by an extrapolation to the low-temperature region. The definitions for Tconset and Tcoffset are also indicated in the graph. The inset depicts the method used for determining the temperature T∗ by plotting (ρ − ρ0)/αT.
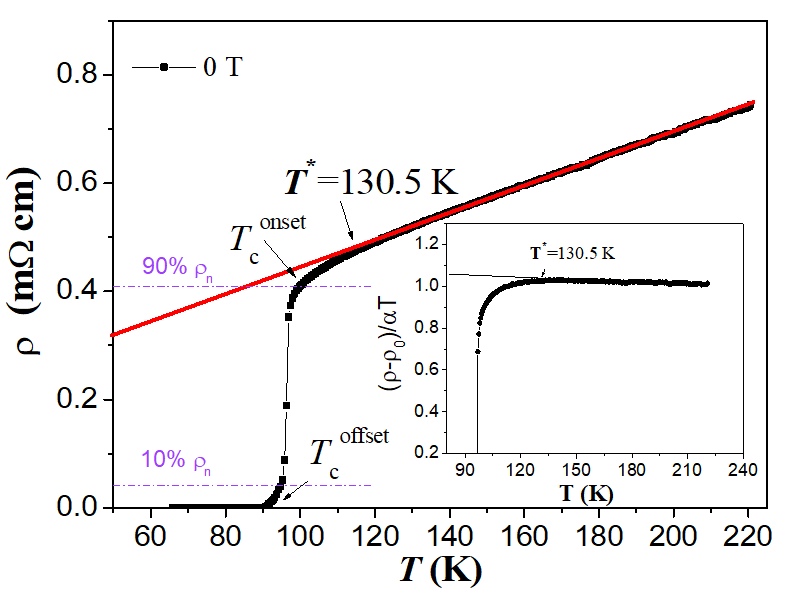
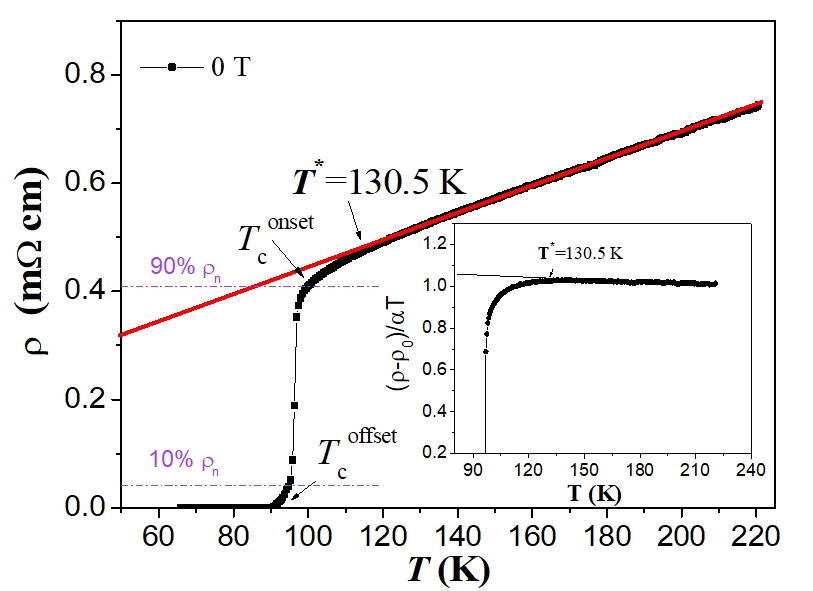
Figure 2. (a) Resistivity of the YBCO foam as function of temperature measured in the superconducting transition region in various applied magnetic fields ranging between 0–7 T. The red circle marks the kinks in the ρ(T)-curves for applied magnetic fields of 3, 5 and 7 T. (b) Plots of the derivative of the resistivity dρ/dT versus temperature of the YBCO foam sample for different applied magnetic fields. Note the double-peak behavior seen at applied magnetic fields above 3 T. Here, the peak at higher temperature is defined as Tc1mid and the peak at lower temperature is denoted as Tc2mid. The two temperatures, Tconset and Tcoffset, can be more precisely determined from this graph as indicated for the data at 0 T and 7 T.
|
µ0Ha (T) |
Tcoffset (K) |
Tconset (K) |
rn (mΩ cm) |
Tc1mid (K) |
Tc2mid (K) |
|
0 |
90.16 |
101.5 |
0.429 |
96.26 |
-- |
|
1 |
88.01 |
99.47 |
0.405 |
92.86 |
-- |
|
3 |
84.14 |
96.03 |
0.3789 |
91.85 |
90.60 |
|
5 |
82.42 |
94.85 |
0.3770 |
91.82 |
89.29 |
|
7 |
80.79 |
94.08 |
0.3748 |
90.64 |
87.66 |
Table 1. Presents the data for the temperatures Tconset, Tcoffset and Tc1mid, Tc2mid as function of the applied field, together with the normal-state resistivity, ρn, taken at T = 120 K.
Figure 1 shows ρ(T) of the foam strut at zero field up to 220 K to enable the determination of ρn(T) by an extrapolation to the low-temperature region. The definitions for Tconset and Tcoffset are also indicated in the graph, and the inset depicts the method used for determining the temperature T∗ by plotting (ρ − ρ0)/αT. Figure 2 (a) presents ρ(T) at the superconducting transition in various applied magnetic fields ranging between 0–7 T and (b) gives the derivative dρ/dT. All data obtained are summarized in Table 1.
The analysis of excess conductivity has been performed in our paper in close vicinity to the critical temperature of the YBCO foam strut sample. The superconducting state with long-range ordering arises at temperatures well beyond the superconducting transition temperature, but a finite probability of formation of Cooper pairs exists in the normal state near the transition during the transport of charge carriers. The formation of Cooper pairs and their interactions with the remaining normal electrons are the cause for the evolution of superconducting fluctuations near to the superconducting transition. When the sample temperature comes close to the transition point, the number of Cooper pairs increases fastly on the cost of normal electrons, which ultimately causes the conductivity of the sample to increase [12]. As consequence, the normal-state resistivity curves tend downwards over the superconductivity transition. The Aslamazov-Larkin model [13,14] explains the mean-field regime related to the induction of fluctuations as being due to the excess conductivity. The excess conductivity, Δσ, is defined via

where ρ(T) denotes the measured resistivity and ρn(T) represents the normal state resistivity. According to the Aslamazov and Larkin theory [13], Δσ above Tc (here, Tc = TcMF, i.e., the mean-field temperature defined as the temperature given by the maximum in the dρ/dT curves, see Fig. 2(b) in the mean-field region (MFR), which can be described by

where ϵ represents the reduced temperature, ϵ = (T−Tc)/Tc and λ denotes the Gaussian critical exponent related to the conduction dimensionality D. From the theoretical considerations, the values for the exponent λ in Eq. (2) are known to be 0.33 for dynamic critical fluctuations (λCR), 0.66 for static critical fluctuations, 0.5 for three-dimensional (3D) fluctuations, 1.0 for two-dimensional (2D) fluctuations, 1.5 for one-dimensional (1D) fluctuations and 3.0 for short-wave fluctuations (SWF). A denotes a constant being temperature-independent, defined via

for the 3D-, 2D- and 1D-case. e denotes the electron charge, ξc(0) represents the coherence length along the c-axis at T = 0 K, d gives the effective layer thickness of the 2D system and s describes the wire cross-sectional area of the 1D system.
To enable a comparison of the experimental data with the theoretical expression for the fluctuation conductivity, ln(Δσ) versus ln(ϵ) is plotted in Fig. 3, allowing the determination of the various fluctuation regimes via linear fitting and the values for λ and A can be determined from the slopes. Fits with varying λ-values around the respective mean values are made, allowing a determination of the best fits to the experimental data. The obtained λ-values are given in Table 2 below.
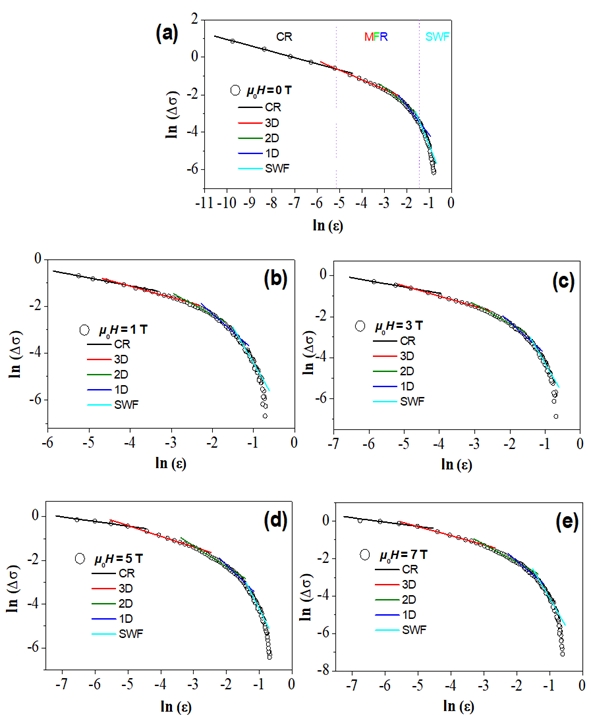
Figure 3. Plots of ln Δσ vs. ln ϵ for the YBCO foam strut sample at (a) μ0Ha = 0 T, (b) μ0Ha = 1 T, (c) μ0Ha = 3 T, (d) μ0Ha = 5 T, and (e) μ0Ha = 7 T in comparison with the Aslamazov-Larkin model. The borders between CR, MFR and SWF fluctuation regimes are indicated by vertical dotted lines in (a). The in total five fluctuation regimes recognized here are indicated by for the critical regime (CR), by for 3D fluctuations, for 2D fluctuations, for 1D fluctuations and for the SWF regime.
Furthermore, the various crossover temperatures, TG, TLD, T(2D−1D), and T(1D−SWF) can be determined. These values are included in Table 3 and plotted in Fig. 4, where all temperatures obtained from the FIC-analysis are plotted as function of the applied field, together with the characteristic fields, Hirr(T), obtained from the resistivity curves using a criterion of 0.1ρn and
|
µ0Ha (T) |
|
|
|
|
|
|
0 |
0.32 |
0.51 |
0.95 |
1.50 |
2.95 |
|
1 |
0.34 |
0.48 |
0.96 |
1.55 |
3.05 |
|
3 |
0.30 |
0.49 |
0.94 |
1.54 |
2.97 |
|
5 |
0.21 |
0.48 |
0.95 |
1.45 |
3.02 |
|
7 |
0.23 |
0.48 |
0.95 |
1.50 |
3.01 |
Table 2. The Gaussian and critical exponents deduced from excess conductivity results
performed at different applied magnetic fields for the YBCO foam sample.
|
µ0Ha (Tesla) |
(K) |
(K) |
(K) |
(K) |
|
0 |
96.9 |
103.10 |
108.79 |
119.67 |
|
1 |
95.02 |
100.65 |
107.51 |
117.38 |
|
3 |
93.66 |
98.09 |
106.95 |
117.27 |
|
5 |
93.27 |
97.29 |
107.48 |
116.31 |
|
7 |
92.21 |
96.54 |
106.82 |
115.35 |
Table 3. Excess conductivity results (TG, TLD, T(2D−1D) and T(1D−SWF)) analyzed at different applied magnetic fields for the YBCO foam sample.
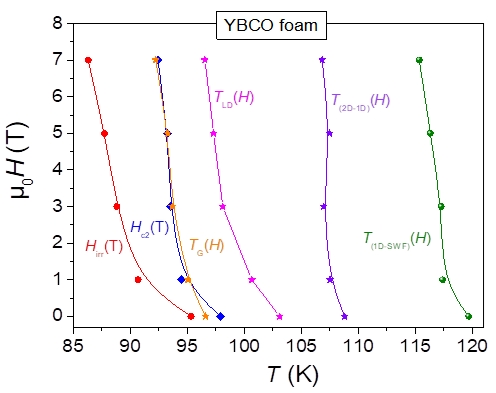
Figure 4. The upper critical field, µ0Hc2(T) and the irreversibility field, µ0Hirr(T), as a function of temperature for the studied YBCO foam strut. For comparison, the FIC data of the characteristic temperatures are also plotted as function of the applied field.
Hc2(T), obtained using a criterion of 0.9ρn (see also Figs. 1 and 2). Here, we must note that Hirr(T) describes the line where the flux pinning vanishes [15], whereas Hc2(T) is the upper critical field defining the field-induced superconducting-normal transition. All FIC-determined data are clearly located in the normal state.
The width of the 1D-, 2D- and 3D-fluctuation regimes as function of the applied field is shown in Fig. 5 (a).
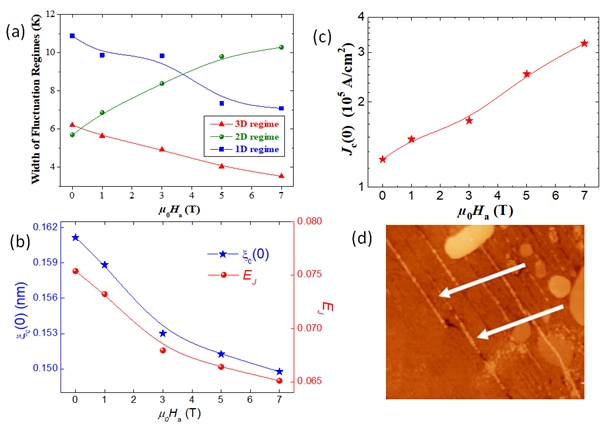
Figure 5. (a) The widths of the 3D-, 2D-, and 1D-fluctuation regimes plotted versus the applied magnetic field, μ0Ha. The lines drawn serve as guide for the eyes. The width of the 3D- and1D-regimes decrease on increasing the applied magnetic field, whereas the width of the 2D-regime is found to increase. (b) Variation of the zero-temperature coherence length along the c-axis, ξc(0), and the interlayer Josephson coupling strength, EJ , as function of the applied magnetic field. The lines drawn serve as guide for the eyes. (c) Variation of the current density at 0 K, Jc(0), as function of the applied magnetic field, μ0Ha. The red line drawn serves as guide for the eyes. (d) AFM topography image indicating that many nanometer-sized Y-211 particles (bright) are located within the grain boundaries (grooves) in between the YBCO grains, revealing details of the minuscule Y-211 particles (bright, marked by white arrows).
Hikami and Larkin (HL) [16] constructed a theory for layered structured superconductors by taking into account simultaneously Maki-Thompson (MT) and AL mechanisms. For layered structured cuprate HTSc, the occurrence of superconductivity is highly dependent on the coupling among the planes and chains.

The Lawrence-Doniach (LD) model [17], a particular instance of HL theory, is actually reproduced by Eq. (4). This model inserts the concept of the strength of the interlayer Josephson coupling among the CuO2 planes, denoted as EJ in cuprate HTSc. By taking α = 1/2, the temperature at which 2D and 3D regimes cross-over is given as:

Figure 5 (b) displays the variations of EJ and ξc(0) as a function of the applied magnetic field. As can be observed, both EJ and ξc(0) diminished with increasing the applied magnetic field. The determination of the crossover between the mean-field regime and the critical region at the temperature TG (the so-called Ginzburg temperature) leads to the estimation of important physical parameters, mainly the critical current density at T = 0 K (Jc(0)) [18]. The corresponding values of TG are 96.9, 96.02, 93.66, 93.27, and 92.21 K for Ha = 0, 1, 3, 5, and 7 T, respectively. Figure 5 (c) depicts the applied magnetic field variations of Jc(0) for our YBCO foam sample. With the increase of the applied field, the value of Jc(0) increases progressively up to 7 T. This progressive increase of the critical current density at the absolute temperature can be ascribed to the tiny Y-211 particles that fill up the channels between the YBCO channels ([19], see Fig. 5 (d)). It is likely that these small Y-211 particles work as efficient and strong pinning centers in YBCO foam sample as they can reduce and disrupt the motion of vortices and facilitate the flow of the current from one grain to another. Similar results have been previously reported by Sedky et al. where an increase in the value of Jc(0) up to 9 T applied magnetic field was observed [20].
- Conclusions and Outlook
Let us summarize here the most important results of the foam microstructure, the resistance measurements and the fluctuation conductivity analysis.
- The microstructure of the YBCO foam struts is distinctly different from both poly-crystalline and melt-textured bulks. An overall texture was introduced by means of a seed crystal, but the local microstructure of an individual foam strut depends on its orientation in the original foam sample. Furthermore, there is not a true single-grain configuration as GBs between YBCO grains prevail, which are filled up with nanometer-sized, tiny Y-211 particles.
- The YBCO foam struts exhibit the presence of Ba3Cu5Oy particles on the sample surface, left over from the capillary flow of the liquid phase during the IG processing.
- The microstructure investigation performed on the foam struts reveals several possibilities to further improve the current flow and hence, the critical current density.
- The resistance measurements reveal a relatively high Tconset of 99.97 K at zero field, a quite sharp superconducting transition followed by a broad foot close to Tcoffset.
- In applied magnetic fields at 3 T and above, a clear kink appears in ρ(T) leading to a double-peak structure in the dρ/dT-plot. This double-peak structure (Tc1mid and Tc2mid) is due to the formation of a long-range superconducting state at lower temperatures involving zero resistivity achieved via a percolation-like process.
- The FIC analysis reveals the presence of three possible fluctuation regimes, namely CR, MFR, and SWF regimes, which can be clearly distinguished. The MFR consists of the three 1D, 2D, and 3D fluctuations.
- The width of the 1D regime is found to decrease on increasing the applied magnetic field, reflecting a destabilization of the conducting charge strips in the YBCO foam strut with magnetic field application.
- The width of the 2D fluctuation regime increases while the width of the 3D regime shrinks on increasing the applied magnetic field.
- The coupling strength, EJ, between the CuO2 planes and the zero-temperature coherence length along the c-axis ξc(0) diminish with increasing the applied magnetic field.
As outlook, we may state that the Jc(0) value deduced in the current study for the YBCO foam strut is quite appealing and it is anticipated that an appropriate doping of nanostructures in the infiltration growth process may further enhance its superconducting features for potential real applications, especially such ones in space where the weight and the quick temperature exchange play an important role, e.g., like for flux-pinning docking interfaces (FPDI) for satellites.
This entry is adapted from 10.3390/ma17071649.
This entry is adapted from the peer-reviewed paper 10.3390/ma17071649
References
- Noe, M.; Steurer,; High-temperature superconductor fault current limiters: Concepts, applications, and development status.. Supercond. Sci. Technol. 2007, 20, R15-R29, .
- Reddy, E.S.; Schmitz, G.J.; Superconducting foams. . Supercond. Sci. Technol. 2002, 15, L21-L24, .
- Noudem, J.G.; Noudem, J.G. . J. Supercond. Nov. Magn. 2011, 24, 105-110, .
- Mitschang, G.W.; Space applications and implications of high temperature superconductivity.. IEEE Trans. Appl. Supercond. 1995, 5, 69-73, .
- Zhang, M.; Han, Y.; Guo, X.; Zhao, C.; Deng, F.; The connection characteristics of flux pinned docking interface.. J. Appl. Phys. 2017, 121, 113907, .
- M. R. Koblischka, A. Koblischka-Veneva, D. Gokhfeld, S. Pavan Kumar Naik, Q. Nouailhetas, K. Berger, B. Douine,; Flux Pinning Docking Interfaces in Satellites Using Superconducting Foams as Trapped Field Magnets. . IEEE Trans. Appl. Supercond. 2022, 32, 4900105, .
- Koblischka, M.R.; Koblischka-Veneva,; Porous high-Tc superconductors and their applications.. AIMS Material Sci. 2018, 5, 1199-1213, .
- Gokhfeld, D.; Koblischka, M. R.; Koblischka-Veneva, A.; ВЫСОКОПОРИСТЫЕ СВЕРХПРОВОДНИКИ: СИНТЕЗ, ИССЛЕДОВАНИЯ И ПЕРСПЕКТИВЫ. Highly Porous Superconductors: Synthesis, Research, and Prospects.. Physics of Metals and Metallography 2020, 121, 936-948 , .
- Reddy, E.S.; Schmitz, G.J.; Ceramic foams. . Am. Ceram. Soc. Bull. 2003, 81, 35-37, .
- Reddy, E.S.; Herweg, M.; Schmitz, G.J.; Processing of Y2BaCuO5 foams. . Supercond. Sci. Technol. 2003, 16, 608-612, .
- Hannachi, E.; Slimani, Y.; Salem, M.K.B.; Hamrita, A.; Al-Otaibi, A.L.; Almessiere, M.A.; Salem, M.B.; Azzouz, F.B.; Fluctuation induced conductivity studies in YBa2Cu3Oy compound embedded by superconducting nano-particles Y-deficient YBa2Cu3Oy: effect of silver inclusion. . Indian J. Phys. 2016, 90, 1009-1018, .
- Larkin, A.; Varlamov, A. . Fluctuation Phenomena in Superconductors; Oxford University Press: Oxford, 2005; pp. 1.
- Aslamazov, L.G.; Larkin, A.L.; The influence of fluctuation pairing of electrons on the conductivity of normal metal. Phys. Lett. A 1968, 26, 238-252, .
- Maki, K.; Thompson, R.S.; Fluctuation conductivity of high-Tc superconductors.. Phys. Rev. B 1989, 39, 2767-2771, .
- Yeshurun, Y.; Malozemoff, A.P.; Shaulov, A.; Magnetic relaxation in high-temperature superconductors. . Rev. Mod. Phys. 1996, 68, 911-949, .
- Hikami, S.; Larkin, A.; Magnetoresistance of high temperature superconductors.. Mod. Phys. Lett. B 1988, 2, 693-698, .
- Lawrence, W.E.; Doniach, S. Theory of layer structure, superconductors. In Proceedings of the 12th International Conference on Low Temperature Physics, Kyoto, Japan, 4.-10. September 1970.
- Subhasis, S.; Namburi, D.K.; Das, S.D.; Nath, T.K.; Magnetic field-dependent study of excess conductivity and pseudogap state of single grain GdBa2Cu3O7−δ superconductor. . Appl. Phys. A 2022, 128, 469, .
- Koblischka, M.R.; Koblischka-Veneva, A.; Nouailhetas, Q.; Hajiri, G.; Berger, K.; Douine, B.; Gokhfeld, D.; Microstructural Parameters for Modelling of Superconducting Foams. . Materials 2022, 15, 2303, .
- Sedky, A.; Nazarova, E.; Nenkov, K.; Buchkov, K.; A comparative study between electro and magneto excess conductivities in FeTeSe superconductors. . J. Supercond. Nov. Magn. 2017, 30, 2751-2762, .