Your browser does not fully support modern features. Please upgrade for a smoother experience.
Please note this is an old version of this entry, which may differ significantly from the current revision.
Subjects:
Biochemistry & Molecular Biology
Secondary acute myeloid leukemia (sAML) is a heterogeneous malignant hematopoietic disease that arises either from an antecedent hematologic disorder (AHD) including myelodysplastic syndromes (MDS), myeloproliferative neoplasms (MPN), aplastic anemia (AA), or as a result of exposure to genotoxic chemotherapeutic agents or radiotherapy (therapy related AML, tAML). sAML is diagnosed when the number of blasts is ≥20% in the bone marrow or peripheral blood, and it is characterized by poor prognosis, resistance to therapy and low overall survival rate.
- sAML
- AHD
- MPN
- MDS
- tAML
- 7 + 3 regimen
- AlloSCT
- CAR-T
- HSC
- LSC
1. Introduction
Acute myeloid leukemia (AML) is defined as a heterogeneous malignant clonal disorder of hematopoietic stem cells (HSC) and is the most common myeloid disorder among adults. This disease can be secondary (sAML) to either an AHD such as MPN and MDS or as a consequence of a prior treatment (tAML), or without an AHD history in the case of de novo AML [1,2,3]. MPNs lack cytopenia and are instead characterized by heightened differentiation of progenitor cells and are negative for the BCR-ABL fusion protein. They are divided into three main sub-categories: polycythemia vera (PV), essential thrombocythemia (ET), and myelofibrosis (MF) [4]. MPN rates of progression to sAML vary by subtype: on average 15% of PMF patients, 8.35% of PV patients, and 1.85% of ET patients develop sAML over a ten-year period [5]. MDS are narrow clonal stem cell disorders characterized by heightened cytopenia in the blood and bone marrow due to apoptosis of hematopoietic progenitor cells, and one third of these syndromes progress to sAML [6,7]. AA is a rare, life-threatening bone marrow disorder characterized by deficiencies in hematopoietic cell production resulting from T-cell mediated autoimmunity. Like other AHDs, approximately 15–20% of AA patients over a ten-year period progress further to MDS/sAML. In addition to mutations and chromosomal abnormalities (Figure 1), other factors including telomere attrition, time to therapy, and the patient response to initial immunosuppressant treatment contribute to disease progression [8,9].
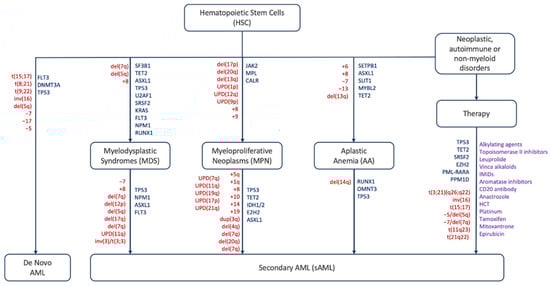
Unlike AHDs, sAML is a severe disease with a poor prognosis that has an overall survival time of 4.7 months and an event-free survival time of 2.9 months [27]. The disease affects the elderly and the majority of diagnosed cases are over 65 years old: the median age of diagnosis is 67 years old with a third of patients over the age of 75. Common mutations that lead to the evolution of sAML are found in members of the spliceosome such as SRSF2, epigenetic modifiers including TET2, IDH1/2, ASXL1, and EZH2, or TP53 which maintains genomic integrity [28]. The aforementioned mutations are acquired on top of the mutations driving MDS or MPN development [29,30,31,32,33,34,35].
According to the 2016 WHO classification, patients are diagnosed with sAML when the percentage of myeloblasts in the bone marrow and/or peripheral blood is equal to or greater than 20% [36,37]. Although blast count has been set as the differentiator between the three phases, there are limitations to this method in that the blasts under examination, commonly through microscopy, are not easily distinguishable between normal samples and those of MDS and MPN patients. In addition to blast count, there are other indicators of progression to sAML, such as decreased apoptosis in the case of post-MDS sAML and increased cell proliferation for post-MPN sAML [38,39,40]. The vast majority of sAML patients progress from MDS (~85%) and upon exposure to therapy (~9%) (Figure 2). MPN and AA contribution is lower with (~5%) and (~1%), respectively [5,7,41,42,43,44].
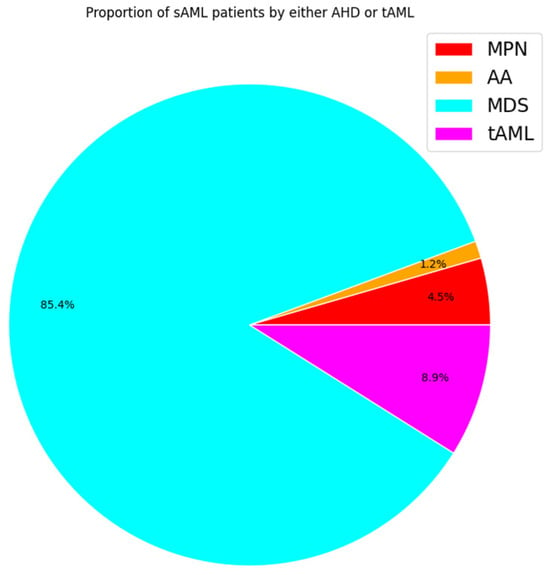
Figure 2. Pie chart displaying estimated proportions of sAML patients by history based on studies monitoring leukemic transformation. Each color represents the proportion of sAML patients by class. Percentages based on average incidence per 100,000 people.
The outcome of sAML patients correlates with the mutational landscape. For example, patients with TP53 mutations, roughly 10–15%, have a worse outcome than those with wild type TP53. Not just due to the pernicious nature of these mutations, but also because of the co-occurring mutations including but not limited to IDH2 and NPM1. Due to the difference in mutation profiles between sAML and de novo AML, the treatment regimen has not been as successful when applied to sAML. For example, TP53 mutant patients had an overall survival of 8 months with induction therapy compared with 1.7 months for those without. The hazard ratio for having a TP53 mutation was 3.1-fold which is higher than either increasing age or performance status, although co-occurring mutations in FLT3 had a slightly smaller ratio of 3.01 [45]. The most recommended method for treating sAML is allogeneic stem cell transplantation (alloSCT) due to the highest probability of success [46], especially compared with the more traditional method of 7 + 3, or 7 days of continuous dosing of cytarabine followed by 3 days of IV injection of daunorubicin, which has been the standard for decades [47]. However, direct comparison studies have shown that sAML patients are consistently less responsive to 7 + 3 treatment compared with de novo AML, and have a lower overall survival rate with this regimen, prompting the need for new therapies to be developed [48,49].
2. Pathophysiology of sAML
The WHO standard of a ≥20% blast count to differentiate between sAML and antecedent disorders is arbitrary like any threshold, but also has a potentially decisive impact on patients who may either display other characteristics of sAML with a blast count below the threshold or do not display characteristics of leukemogenesis despite having surpassed the threshold [50]. Therefore, this approach does not always assure diagnosis accuracy or reflect the complexity of leukemogenesis nor does it guarantee the optimal treatment for the patient. It is crucial to note that there are additional factors such as mutation type influencing diagnosis and treatment regimens. During the progression process, the immune system responds to the growth of the malignant cells. For example, Bauer et al. have shown a shift in immune cell populations between healthy donors’ bone marrow samples and those diagnosed with either MDS or sAML: there were neither CD3+CD8+ nor CD3+FOXP3+ T cells within a 25-micron radius in healthy bone marrow samples, but both of these populations were present in sAML patients at much higher levels. However, when comparing subsets of sAML, the outcomes were not uniform: in contrast to patients with TP53 mutations, patients with mutations in either signal transduction genes, chromatin modifiers, or splicing factors showed a significant increase in both populations [51].
One of the reasons why sAML is more common in older patients, especially over the age of 60, is the phenomenon of clonal hematopoiesis of indeterminate potential (CHIP), which is defined as having more than 2% mutant hematopoietic stem cells (HSC) without a history of either cytopenia or myeloid neoplasms. The risk for patients accumulates every year by 0.5–1%, thus most sAML patients skew older with some exceptions such as Fanconi anemia (FA) that progresses earlier. FA is a rare blood disorder characterized by a selective growth advantage to HSCs with an extra copy of 1q, leading to bone marrow depletion and an elevated risk of both MDS and later sAML [52,53]. However, in cases of cytopenia where patients do not exactly meet the criteria for MDS, they are diagnosed with clonal cytopenia of undetermined significance (CCUS) [54]. A 2023 study of UK Biobank patients found that patients diagnosed with either CCUS or CHIP had a significantly higher risk to develop MPNs and subsequently sAML: 1.74 for the former and 2.63 for the latter. For comparison, the risk for patients over 65 to develop MPN/sAML was 1.53 and the risk associated with the total number of mutations was 2.32. Non-genomic factors like red blood cell width distribution (RDW) over 15% or the mean corpuscular volume over 100 fL (MCV) had even higher risks: 3.63 and 4.03 [55]. RDW is also a biomarker for leukemic transformation: a higher RDW is not only used to distinguish MDS patients from healthy ones, but it is also a reliable predictor of leukemogenesis years after the initial MDS diagnosis. Higher RDW is associated with overall worse outcome in patients who have been treated with alloSCT and increased possibility to have passenger mutations in genes like NPM1 or ASXL1 [56].
In terms of cytogenetic risk for leukemic transformation, chromosomal mosaicism is also positively correlated with MPN formation: the 10-year cumulative incidence with mosaicism was 83% and 43% without it [55]. Moreover, chromosomal abnormalities impact diagnosis. For example, t(8;21) is associated with a favorable diagnosis, whereas poor prognosis is associated with −7, inv(3)/t(3q)/del(3q), −7/del(7q), or complex karyotype (CK) with ≥3 abnormalities, which substantially increases the risk of leukemic progression [57,58]. A recent study has reported a case of a 44-year-old female with MDS/MPN where constitutional trisomy 21 was the only identified chromosomal abnormality [59]. Due to higher average age, the risk of an adverse karyotype is higher in sAML than in de novo. Compared with de novo AML, sAML patients have lower overall platelet and leukocyte counts, as well as a lower blast percentage in either bone marrow or peripheral blood [60]. Another study found that 81% of post-MDS sAML patients had a lower WBC count compared with 68% of MPN blast phase or 60% of de novo AML cases (Table 1) [61].
Table 1. Hematological features associated with MPN, MDS, sAML and de novo AML.
| Clinical Overview | Healthy | MDS | MPN | sAML | De Novo AML |
|---|---|---|---|---|---|
| Age (y) | 18–65 | 53–98 | 18–92 | 21–77 | 18–59 |
| White Blood Cells (109/L) | 4–11 | 1.1–17.9 | 7.2–14.7 | 0.8–144.1 | 0.77–419.9 |
| Platelets (109/L) | 150–450 | 8–505 | 376–720 | 3–752 | 30–171 |
| Hemoglobin (g/L) | 120–175 | 47–149 | 109–173 | 34–143 | 2–1726 |
| Clinical record | Free of treatment and transfusion | Both therapy free and treatment * | 3 + 7 regimen Hypomethylation or palliative treatment |
3 + 7 regimen | |
| Reference | [62] | [63] | [64] | [65] | [65] |
* anti-platelet drugs, cytoreductive therapy, JAK-2 inhibitors, immunomodulators, venipuncture, and supportive RBC transfusions.
Another factor that contributes to sAML progression is inflammation through immune system dysregulation. Patients with autoimmune diseases (AIDs) are already at higher risk of developing sAML due to the elevated levels of inflammatory cytokines in the blood [66,67]. A recent study demonstrated that the increase in inflammation is particularly observed in MPN patients with TP53 mutations, either heterozygous or multi-hit, where the mutant myeloid cells gain a selective advantage over erythroid cells, especially those with WT TP53, which leads to a distortion in the ratio between erythroid and myeloid progenitor cells [68]. For example, TNF drives malignant clonal dominance by targeting healthy myeloid progenitor cells with both apoptotic and necroptotic signaling while malignant cells are left unaffected and able to proliferate through immuno-evasive mechanisms. Moreover, constitutive NFκB activity has been reported in both MPN/MDS and sAML patients [68,69,70]. In the case of MDS progressing to sAML, the chemokine receptor CCRL2, normally expressed in granulocytes, monocytes and NK cells is up-regulated in stem cells, which in turn stimulates IL-8 and the chemokine receptor CXCR2 [71,72]. On the other hand, IL-8 is a catalyst for several downstream pathways that promote proliferation, especially in tumors, including NFκB, MAPK, AKT, STAT3, and β-catenin. In a study conducted by Montes et al., compared with healthy donors, patients with MDS and sAML have significantly reduced counts of both CD4+ T lymphocytes and NK cells, with sAML having a higher count of CD4+ T lymphocytes than MDS, but lower than healthy donors. This illustrates that at least the correlation between CD4+ T lymphocytes and MDS progression to sAML is not linear. In tandem with lower counts of proactive immune cells, programmed death ligand 1 (PD-L1) is upregulated, which suppresses the T-cell response to tumor growth and permits clonal expansion and metastasis of leukemic cells [73,74]. Patients with sAML have lower or similar expression levels of PD-L1 compared with MPN/MDS, with no difference between early and advanced stages of MDS; suggesting that the peak of PD-L1 expression results in a long-term suppression of the immune response that allows subsequent mutations to develop and trigger the progression to sAML [75]. In parallel, monocytic myeloid-derived suppressor cells (Mo-MDSC), another immuno-suppressive cell type, has been shown to have stronger positive correlation with the progression to sAML from MDS [74,76]. In addition, alteration in the extracellular matrix (ECM), and in particular the leucine-rich proteoglycan biglycan (BG), contributes to the heightened inflammatory environment observed in both MPN/MDS and sAML. BG is expressed in the bone marrow of both MDS and sAML patients but not in healthy individuals: it promotes cell signaling, bone mineralization, and differentiation. The presence of BG was positively correlated with activity of inflammasome components such as IL-1β, IL-18, and IFN-α. There was no significant difference in BG bone marrow expression between MDS and sAML patients. The hazard ratio of BG-high MDS patients versus BG-low patients for progression to sAML was 8.3 [77].
Another key feature of sAML is the increased self-renewal activity of pre- Leukemic Stem Cells (pre- LSC) through the WNT/β-catenin pathway activation during progression, which produces three main LSC phenotypes: multi-potent progenitor (MPP), lymphoid primed multi-potent progenitor (LMPP) and granulocyte-macrophage progenitor (GMP) [78]. Compared with de novo AML, sAML patients had higher amounts of MPP-like LSCs and LMPP-like LSCs, and this difference was more pronounced in post-MPN sAML. Post-MDS sAML patients had more GMP-like LSCs than post-MPN patients, but similar to de novo AML. The first two types of LSCs were strongly correlated with poor prognosis while GMP-like LSCs were more commonly seen in patients (either de novo or sAML) with either an intermediate or favorable prognosis. There was no difference in terms of LSC type distribution between patients younger than 65 and those older than 65 [79].
In contrast to increased pre-LSC activity in MPN patients progressing to sAML, there is a negative correlation between interferon (IFN) activity and risk of sAML. A study by de Castro et al. categorized MPN patients by both LSC and IFN activity and found that those with both the lowest IFN and highest LSC activity had the greatest risk of progression to sAML. Clonogenicity was significantly higher in this cohort compared with the rest of the study population, and the result was the same when comparing before and after transformation. The low IFN activity in these transforming cells also results in a more chaotic microenvironment where endothelial cells are dysregulated, and leukocytes are behaving abnormally while under increased oxidative stress [80].
The transition to sAML is accompanied with a shift in the clonal architecture inside the bone marrow. This shift is correlated with the number of acquired mutations during progression. Static shift occurs when mutations are acquired sequentially and the clones with the most mutations gradually dominate the bone marrow. Dynamic-S (for single nucleotide variant) shift occurs upon acquisition of multiple mutations that can be in multiple categories simultaneously (Table 2) and their rise to clonal dominance is expedited. Finally, the Dynamic-C (for chromosomal) shift is similar to Dynamic-S except that instead of gaining mutations, the clones acquire chromosomal abnormalities that confer a selective advantage (Table 3) [81]. Most genomic aberrations are either initiators in terms of clonal expansion and myeloid transformation or acquired after the process has begun [82].
Table 2. Mutated genes implicated in leukemic transformation and clonal expansion.
| Category of Genes | Examples | Citations |
|---|---|---|
| Spliceosome | SRSF2, U2AF1, SF3B1 | [86,87] |
| DNA Methylation | DMNT3A, TET 1/2, IDH 1/2, | [88,89] |
| Activated Signaling | CALR, JAK2, PTPN11, TpoR, KRAS, FLT3, NRAS | [90,91] |
| Transcription Factors | RUNX1, NFE2, TP53 | [92,93,94,95,96] |
| Chromatin Modification | EZH2, ASXL1, NPM1 | [89,97] |
Table 3. Chromosomal abnormalities correlated with sAML transformation.
| Type of Chromosomal Abnormality | Examples | Citations |
|---|---|---|
| Deletions | del(7q), del(5q), del(17p) | [106,113] |
| Duplications | dup(1q), dup(3q), dup(11q), dup(17q) | [114,115,116] |
| Translocations | t(1;11)(q21;p15), t(10;11)(q22;q23), t(8;21) | [65,117,118] |
| Inversions | inv(3)/t(3;3) | [24] |
| Monosomy | −7 | [87,119] |
| Trisomy | +8, +19, +21 | [59,87,120] |
| Uniparental disomy | UPD(9p), UPD(1p), UPD (17p) | [75,92,121] |
This entry is adapted from the peer-reviewed paper 10.3390/life14030309
This entry is offline, you can click here to edit this entry!