Your browser does not fully support modern features. Please upgrade for a smoother experience.
Please note this is an old version of this entry, which may differ significantly from the current revision.
Marine lipids are recognized for their-health promoting features, mainly for being the primary sources of omega-3 fatty acids, and are therefore critical for human nutrition in an age when the global supply for these nutrients is experiencing an unprecedent pressure due to an ever-increasing demand. The seafood industry originates a considerable yield of co-products worldwide that, while already explored for other purposes, remain mostly undervalued as sustainable sources of healthy lipids, often being explored for low-value oil production. These co-products are especially appealing as lipid sources since, besides the well-known nutritional upside of marine animal fat, which is particularly rich in omega-3 polyunsaturated fatty acids, they also have interesting bioactive properties, which may garner them further interest, not only as food, but also for other high-end applications. Besides the added value that these co-products may represent as valuable lipid sources, there is also the obvious ecological upside of reducing seafood industry waste. In this sense, repurposing these bioresources will contribute to a more sustainable use of marine animal food, reducing the strain on already heavily depleted seafood stocks. Therefore, untapping the potential of marine animal co-products as valuable lipid sources aligns with both health and environmental goals by guaranteeing additional sources of healthy lipids and promoting more eco-conscious practices.
- bioactive lipids
- lipidomics
- marine animal co-products
- omega-3 PUFAs
- seafood industry
- sustainable practices
1. Marine Animal Co-Products
Seafood encompasses a large and varied range of different animal species, including fish (e.g., salmon, tuna, cod, sardine, seabass, seabream), crustaceans (e.g., crabs, shrimp, and lobsters), and bivalve (e.g., mussels, clams, and oysters) and cephalopod mollusks (e.g., squid and octopus). They can arrive to the market either through farming (aquaculture) or being wild-caught (fishery operations), with both production systems being collectively responsible for 178 million tons of aquatic animals in 2020 [1]. In the specific case of fish, aquaculture production (94.7 million metric tons) is expected to have slightly surpassed production by capture fisheries (90.7 million metric tons) in 2023 [2]. Most commonly, consumer interest in seafood products primarily focuses on fillets and whole seafood items, such as shrimp or fish [3]. In many occasions, however, a substantial portion of harvested marine animals, corresponding to less valuable, non-edible, and less marketable parts, is depreciated as co-products [4]. Marine animal co-products may be generated during all the production, processing, distribution, consumption, and disposal stages, with the processing stage being responsible for the majority of unused material produced [5][6]. Normally, seafood processing co-products result from processes that include bleeding, beheading, deshelling, skinning, trimming, gutting, removal of fins and scales, filleting, and washing [7][8] (Figure 1). Within the context of marine animal co-products, it is crucial to understand the intricacies of this resource pool. Each specific co-product may present unique opportunities and challenges for lipid extraction and repurposing, and therefore, a detailed examination of their detailed profiles and characteristics, specifically using more advanced lipidomics methodologies, is mandatory.
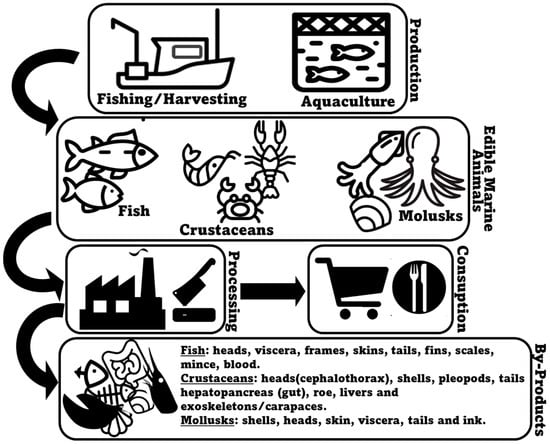
Figure 1. An overview of the generation of marine animal co-products.
Seafood industries have made some efforts to deal with the significant amounts of biomass originated by their activity. Still, the level of biowaste generated is commonly either repurposed for low-value purposes, such as animal feed, plant fertilizers, fish oils and fish meals, or even biodiesel production, or is simply discarded, often being incinerated, resulting in additional energy consumption, costs, and environmental impact [9][10][11][12]. Therefore, the current scenario is far from ideal for both industry players and the general population, representing a missed opportunity from an economic standpoint, while also contributing to environmental issues related to increased waste disposal and processing. Therefore, understanding and repurposing the various types of marine animal co-products and their potential for sustainable resource development is crucial from both the economic and ecological standpoints. Moreover, by recognizing the diversity of marine animal co-products and their local/regional availability, stakeholders can devise resource utilization strategies to minimize waste and maximize value within the seafood industry while guaranteeing foreseeable benefits for local economies.
Taking into account idiosyncratic geographical tendencies regarding both production/capture and consumption trends driven by regional socioeconomic and cultural constraints, differences in the production of co-products, both regarding quantity and type, are to be expected. According to the IFFO—The Marine Ingredients Organization site, Asia is responsible for recycling the majority of raw materials from the seafood industry, accounting for the production of 40.0% of marine ingredients based on co-products, followed by Europe (23.3%) and Latin America (20.8%), with North America producing just 7.8% of global co-products [13]. This is somewhat expected since in 2020, Asian countries distinctly led total fishery production (70%) [14]. Although considerable efforts have been made to more readily utilize marine animal co-products originated from the seafood processing worldwide, their exploration and use may vary considerably regionally [15]. In Asia, seafood value chains effectively accommodate these resources, resulting in little waste, while in Europe, stricter legislation (as response to bovine spongiform encephalopathy and other food threats) has rendered the utilization of these resources more difficult [16][17]. In other, less developed regions, more lenient legislation and the low valorization of co-products make disposal more generalized [15]. A specific case of particularly efficient utilization of marine animal co-products is Norway, which has developed processing facilities able to process over 0.65 million tons of seafood co-products by year, and where the Norwegian Atlantic salmon industry is reported to utilize 90% of its byproducts [18].
2.1. Fish
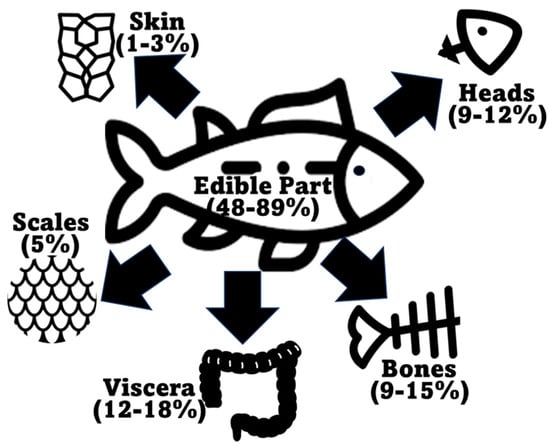
According to the Food and Agriculture Organization of the United Nations (FAO) in the latest “The State of World Fisheries and Aquaculture 2022” report, global marine and diadromous fish production amounted to 77 million tons in 2020 (Figure 2) [1]. Approximately 67 million metric tons of marine/diadromous fish were obtained via capture, while only around 10 million tons were produced in aquaculture. The most consumed fishes in the European Union are tuna (several species, including Katsuwonus pelamis, Thunnus albacares, and Thunnus thynnus), salmon (Salmo salar), cod (Gadus morhua), and Alaska pollock (Gadus chalcogrammus), in this respective order [19]; therefore, these should be the species responsible for generating the greatest amounts of co-products. Moreover, it is estimated that around 70% of the fish captured and produced undergoes processing before entering the market, which implies a considerable production of potential fish waste if this biomass is not duly used for other purposes [20]. These processing steps preceding human consumption, intended to facilitate consumer manipulation, are normally achieved by the removal of uneatable or less savory parts. This processing originates co-products in the form of heads, viscera, frames, and skins, or others like tails, fins, scales, mince, and blood [9]. All this raw material can represent between 30 and 70% of the wet weight of the fish, depending on the species [7][21]. An estimate of the total generation of fish co-products using these estimates is presented in Figure 2. As an estimate, heads represent 9–12%, viscera 12–18%, skin 1–3%, bones 9%–15%, and scales 5% of total fish weight (Figure 3) [22][23], while the edible part of fish may represent 48–89%. Some of these co-products are considered easily degradable products (especially viscera and blood) given their high enzyme content, while others are considered to be more stable (e.g., bones, heads, and skin) [24].
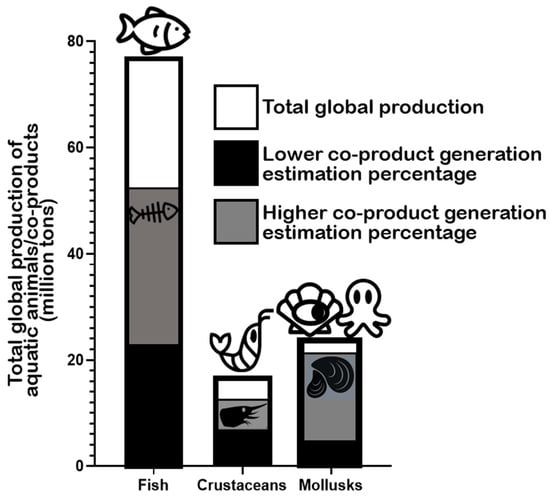
Figure 2. Total global production of fish, crustaceans, and mollusks according to the “The State of World Fisheries and Aquaculture” (2022) by FAO and estimated generated co-products according to generally accepted estimates (mentioned in the text).
1.2. Crustaceans
The global production of crustaceans is estimated to reach approximately 17 million tons worldwide, with aquaculture production (≈11 million tons) surpassing capture (approximately 6 million tons) (Figure 2) [1]. The whiteleg shrimp (Penaeus vannamei), the Chinese mitten crab (Eriocheir sinensis), and the giant tiger prawn (Penaeus monodon) are the most important crustacean marine/brackish–marine species produced in aquaculture in the world, while “Natantian decapods” as a group (including species of shrimp and prawns like, e.g., P. vannamei and P. monodon), Antarctic krill (Euphausia superba), and the Gazami crab (Portunus trituberculatus) are the most frequently captured species [1]. Crustacean processing, including various shrimp and crab species, produces multiple co-products, in this case mostly in the form of heads, pleopods, tails, and exoskeletons [26]. In general, it is estimated that up to approximately 75% of the total weight of crustaceans (e.g., shrimp, crabs, prawns, lobster, and krill) may become co-products in some form [27][28][29], which is an impressive value, potentially representing large environmental challenges locally. In the specific case of shrimp, the waste generated during industrial processing represents 40–50% of its total weight [30][31]. Shrimp co-products are generally discarded or processed into animal feed or protein feedstuff for aquaculture diets [32][33]. Specific shrimp co-products include the cephalothorax (the head and the thorax or pereon region) and the hepatopancreas (midgut diverticulum and primary digestive organ) as substantial non-edible parts [30][32], along with carapaces and tails [34]. Heads (cephalothorax) and tails are thought to be the richest in lipids [33]. In the lobster “tailing” process, the “head” (cephalothorax) is discarded as waste [35]. In the processing of shellfish, 50–70% is estimated to end up as co-products, including carapaces (namely heads), roe, and the hepatopancreas, which are also removed and traditionally discarded [36].
1.3. Mollusks
The production of mollusks for human consumption is estimated at a total of approximately 24 million tons worldwide (Figure 2) [1]. Here, aquaculture production (18 million tons) also surpasses the amount obtained by capture (approximately 6 million tons). Cupped oysters (Magallana gigas and Magallana angulata), the Japanese carpet shell (Ruditapes philippinarum), and scallops (including species from the Placopecten and Pecten genera) are the main mollusks produced in aquaculture and consumed worldwide [1]. Hard-shelled mollusk processing, including the handling of clams, mussels, and oysters for consumption, may generate attached soft tissues that can be exploited and repurposed. Undersized specimens are also usually discarded as waste [37]. Hard shells (of clams, mussels, and scallops) can account for 65–90% of live weight depending on the actual species [38][39][40]. The processing of cephalopods, such as octopuses and squids, is also a source of waste and co-products, corresponding to non-edible or less savory parts. Octopus processing originates co-products that may represent 10–15% of total weight after the commercial scission of tentacles and heads [41]. In the case of squids, the mantel is the portion directed for commercial purposes, with the heads, skin, viscera, tails, and ink becoming the processing co-products that are commonly discarded [42][43][44][45].
2. Marine Animal Co-Products as a Source of Healthy Lipids
The characterization of the fatty acid profile and the overall lipidome of marine animal co-products represents a starting point and a foundation for the ultimate valorization and rational utilization of these resources. Marine animal products, as foods, are commonly recognized for their beneficial features, especially their health-promoting profile in terms of lipid composition, displaying high polyunsaturated fatty acid (PUFA) content, along with low contents of saturated fatty acids and cholesterol [46]. One especially enticing characteristic is their high content of omega-3 PUFAs, particularly eicosapentaenoic acid (EPA) and docosahexaenoic acid (DHA) [47][48][49][50][51][52], which have been ascribed a vast list of health-promoting benefits [53][54][55]. But ultimately, it is the full spectrum of fatty acids, including monounsaturated and saturated fatty acids, which will determine the overall nutritional quality and even the stability of lipids [56]. There are many available reports characterizing the fatty acid profile of marine animal co-products, probably because of the aforementioned interest in omega-3 fatty acids, with the perspective of using these wastes as potential sources of highly valued fatty acids, such as EPA and DHA. There are fewer studies characterizing lipid class distribution in these matrixes, and just a few employing lipidomics and molecular-level profiling to characterize the lipid content in marine animal co-products. Anyway, it is well established that triglycerides and phospholipids are the main lipid classes present upon analysis of lipid extracts of marine animals [57][58][59][60][61][62][63], and that is also very generally the case for their co-products, as will be later detailed. Other lipid classes that were reported to be present in marine animal co-products and that will be appraised in this section include diacylglycerides and sterols, although the presence of lipid-soluble compounds like carotenoids and vitamins, which should also be present in lipid fractions, will also be highlighted and discussed.
2.1. Fish
Some lipid extracts of fish co-products have already been characterized for some marine species, but typically only on what concerns their fatty acid content. These characterizations reveal some variability in lipid content among different fish species and their co-products, but ultimately highlight the potential of these resources to represent a viable and significant source of healthy fats, with emphasis on omega-3 polyunsaturated fatty acids.
Fish nutritional composition varies with species, age, gender, health, nutrition and nutritional status, and seasonality [64]. Normally, and besides moisture (50–80%), fish are nutritionally rich in proteins (15–30% of total weight), although lipid content may be very variable (generally described as representing 0–25% of total weight) [65]. Depending on their fat content, fish may be classified as lean fish (cod (G. morhua) and hake (family Merlucciidae), presenting low lipid levels—0.5–3%), fatty fish, such as mackerel (family Scombridae) and salmon (S. salar) (10%–18% fat) [66], and semi-fatty fish, as gilthead sea bream (Sparus aurata), sea bass (Dicentrarchus labrax), and trout species, whose fat content in general is somewhere in between that of the former two [65].
A recent study encompassing several different co-products/parts (heads, frames, trimmings, skin, and viscera) of four of the most important marine fish farmed in Europe, Atlantic salmon (S. salar), European seabass (D. labrax), gilthead seabream (S. aurata), and turbot (Scophthalmus maximus), reported important lipid yields. For S. salar and D. labrax, viscera were the co-product displaying the greatest lipid yield (37.0% and 39.3% wet weight, respectively), while for S. aurata, the heads were the body part most abundant in lipids (22.3%); for S. maximus, the most lipid-rich part were frames (12.1%) [67]. Another study screening the lipid content of different fish co-product parts (head, gills, intestines, trimmings, bones, and skin) from meagre (Argyrosomus regius) and S. aurata, showed that the heads (28.9% and 37.1% DW, respectively), intestines (17.1% and 43.2% DW, respectively), and bones (35.0% and 30.6% DW, respectively), as well as the skin in the particular case of S. aurata (46.4% DW, only 6% DW in the meagre), were particularly rich in lipids [68]. Another study reported a 34.1% lipid content in the guts of S. aurata and 26.8% in its skin, which are levels too considerable not to be acknowledged [65]. The considerable lipid content in co-products of D. labrax were confirmed in another study [69], especially in the viscera (44.1% wet weight) and the liver (26.2%).
Lipid content in the co-products of aquaculture bluefin tuna (T. thynnus) was reported to represent up to 32.1% [70], while lipid content in the viscera of sardinelle (Sardinella aurita) was shown to vary seasonally, attaining a maximum yield of 25.4% (DW) [71]. However, other marine animal co-products were reported to display lower but still considerable lipid levels, such as the viscera of yellowfin tuna (T. albacares), containing 5.1% fat [72], the viscera of Atlantic herring (Clupea harengus), containing 9.6% lipids [73], or the viscera of salema (Sarpa salpa), displaying a maximum of 3.6% lipids [71]. Lipid content in another tuna fish (Euthynnus affinis) amounted to 7.0% in the head, 4.5% in the intestine, and 3.7% in the liver [74], while in sardines (Sardinella lemuru), fat content represents 5.7% in the head, 5.1% in the intestine, and 5.8% in the liver [75]. Lipids in cod offal represent 4.3% [76]. The lipid content in king salmon (Oncorhynchus tshawytscha) head, roe, and skin was reported to represent 35.5%, 13.4%, and 14.0% of wet tissue, respectively [77]. In blue mackerel (Scomber australasicus) processing co-products, namely in the head, skin, roe, and male gonads, the lipid contents were 12.3%, 20.9%, 9.4%, and 6.9% of wet tissue, respectively [78]. Regarding the lipid content of fishbones, the Pacific halibut (Hippoglossus stenolepis), the albacore (Thunnus alalunga), the sockeye salmon (Oncorhynchus nerka), the lingcod (Ophiodon elongatus), the golden pompano (Trachinotus blochii), the Atlantic cod (G. morhua), and the Chinook salmon (O. tshawytscha) have been reported to contain bone lipids in the range of 10–30% [79]. However, the total lipid content of fish bone powder from Sardinella fimbriata was relatively modest, estimated to be only 0.8% [80]. The Atlantic cod (G. morhua) is another species reported to have negligible bone lipid content (in the range of 1–3%) [79], with those values being comparable to those occurring in mammalian cortical bone tissue [81][82].
Most of the available studies characterizing the fatty acid profile of marine fish co-products focused on their fatty acid profile, certainly foreseeing the good nutritional characteristics normally assigned to marine fish products. Currently available studies are summarized in Table 1. Results are very variable, and this variability is certainly related to sampling specificities and to the specific technical approach applied in terms of extraction and fatty acid analysis. For instance, Soxhlet extraction seems to generate inferior yields in terms of EPA and DHA with regard to other approaches (Table 1). Nevertheless, it is fair to say that fish co-products generally present a significant content of PUFAs and omega-3, with the most consistent characteristic being the extremely low ratios of n-6/n-3 fatty acids, considered beneficial to health. It is also important to mention that, in some cases, co-products were analyzed in parallel with the actual edible fish parts (fillets) or whole fish, and in those cases, lipid profiles were very similar [65][83] or co-products even presented better yields [73], confirming the prospective quality of the fat present in this type of waste.
Table 1. Studies characterizing the fatty acid profiles of fish co-products using conventional extraction methods, with an emphasis on healthy characteristics. Results are presented as percentages of total fatty acids.
| Species | Co-Product | Extraction | PUFAs | Omega-3 | n-6/3 | EPA | DHA | Ref. |
|---|---|---|---|---|---|---|---|---|
| Champsocephalus gunnari | Brain | Solvent (hexane) | 0% | 0% | ------ | 0% | 0% | [84] |
| Champsocephalus gunnari | Liver | Solvent (hexane) | 2.29% | 1.34% | 0 | 1.34% | 0% | [84] |
| Champsocephalus gunnari | Stomach | Solvent (hexane) | 35.6% | 32.7% | 0.02 | 15.9% | 14.9% | [84] |
| Champsocephalus gunnari | Skin | Solvent (hexane) | 27.8% | 25.9% | 0 | 15.6% | 8.0% | [84] |
| Clupea harengus | Co-product mix (heads, fins, tails, and viscera) | Bligh and Dyer | 35.5% | 26.4% | 0.34 | 5.6% | 9.2% | [83] |
| Clupea harengus | Minced co-product (heads, frames, skin, and viscera) | Bligh and Dyer | 21.9% | ------ | ------ | 6.4% | 9.4% | [73] |
| Dicentrarchus labrax | Heads | Folch | 28.0% | 12.4% | 1.21 | 3.0% | 5.1% | [67] |
| Dicentrarchus labrax | Frames | Folch | 29.4% | 13.1% | 1.19 | 3.2% | 5.2% | [67] |
| Dicentrarchus labrax | Skin | Folch | 33.8% | 16.6% | 1.00 | 4.0% | 7.5% | [67] |
| Dicentrarchus labrax | Trimmings | Folch | 27.3% | 11.0% | 1.43 | 2.6% | 4.3% | [67] |
| Dicentrarchus labrax | Viscera | Folch | 27.9% | 10.7% | 1.55 | 2.4% | 4.0% | [67] |
| Euthynnus affinis | Heads | Bligh and Dyer | 28.8% | 17.2% | 0.67 | 1.5% | 15.7% | [74] |
| Euthynnus affinis | Intestine | Bligh and Dyer | 27.4% | 17.0% | 0.61 | 2.7% | 14.3% | [74] |
| Euthynnus affinis | Liver | Bligh and Dyer | 24.0% | 15.9% | 0.51 | 1.7% | 14.2% | [74] |
| Gadus morhua | Offal (heads, viscera, and skeletal frames) | Bligh and Dyer | 32.1% | ------ | ------ | 8.9% | 13.3% | [76] |
| Gadus morhua | Liver | Bligh and Dyer | 24.7% | ------ | ------ | 7.7% | 11.4% | [76] |
| Katsuwonus pelamis | Heads | Soxhlet | 12.7% | 9.6% | 0.32 | 1.3% | 6.3% | [85] |
| Lophius litulon | Liver | Soxhlet | 46.6% | ------ | ------ | 1.2% | 8.1% | [86] |
| Notothenia rossii | Brain | Solvent (hexane) | 32.9% | 32.2% | 0.02 | 9.8% | 22.0% | [84] |
| Notothenia rossii | Liver | Solvent (hexane) | 26.0% | 21.8% | 0.13 | 8.4% | 11.5% | [84] |
| Nototheniarossii | Stomach | Solvent (hexane) | 41.6% | 30.8% | 0.32 | 11.3% | 18.6% | [84] |
| Notothenia rossii | Skin | Solvent (hexane) | 35.0% | 31.0% | 0.09 | 16.2% | 10.7% | [84] |
| Salmo salar | Heads | Bligh and Dyer | 35.4% | 27.7% | 0.28 | 8.4% | 12.1% | [87] |
| Salmo salar | Heads | Folch | 31.9% | 16.3% | 0.93 | 3.2% | 4.8% | [67] |
| Salmo salar | Frames | Folch | 31.9% | 15.9% | 0.98 | 3.0% | 4.6% | [67] |
| Salmo salar | Skin | Folch | 31.9% | 15.4% | 1.05 | 2.8% | 4.0% | [67] |
| Salmo salar | Trimmings | Folch | 32.0% | 15.9% | 0.98 | 3.0% | 4.0% | [67] |
| Salmo salar | Viscera | Folch | 25.0% | 10.4% | 1.37 | 1.6% | 2.3% | [67] |
| Sardinella lemuru | Heads | Bligh and Dyer | 26.4% | 17.8% | 0.54 | 1.8% | 16.0% | [75] |
| Sardinella lemuru | Intestine | Bligh and Dyer | 24.9% | 13.6% | 0.83 | 1.7% | 11.9% | [75] |
| Sardinella lemuru | Liver | Bligh and Dyer | 22.7% | 15.7% | 0.44 | 2.8 | 13.0% | [75] |
| Sardinella aurita | Viscera | Bligh and Dyer | 30.5% | 26.1% | 0.15 | 7.4% | 13.6% | [71] |
| Sarpa salpa | Viscera | Bligh and Dyer | 34.8% | 20.4% | 0.71 | 4.1% | 6.0% | [71] |
| Scomber australasicus | Head | EtOH:hexane | 39.9% | 36.6% | 0.09 | 9.1% | 21.9% | [78] |
| Scomber australasicus | Skin | EtOH:hexane | 38.1% | 34.8% | 0.09 | 9.6% | 19.5% | [78] |
| Scomber australasicus | Roe | EtOH:hexane | 47.0% | 44.4% | 0.06 | 11.3% | 27.5% | [78] |
| Scomber australasicus | Male gonads | EtOH:hexane | 44.7% | 42.5% | 0.05 | 12.1% | 24.7% | [78] |
| Scomber scombrus | Heads | Soxhlet | 25.4% | ------ | ------ | 3.6% | 9.3% | [88] |
| Scomber scombrus | Gills | Soxhlet | 12.3% | ------ | ------ | 1.0% | 1.7% | [88] |
| Scophthalmus maximus | Heads | Folch | 36.8% | 22.5% | 0.61 | 4.4% | 11.6% | [67] |
| Scophthalmus maximus | Frames | Folch | 36.5% | 21.7% | 0.64 | 5.2% | 7.9% | [67] |
| Scophthalmus maximus | Skin | Folch | 37.4% | 22.6% | 0.62 | 5.2% | 8.9% | [67] |
| Scophthalmus maximus | Trimmings | Folch | 37.5% | 22.8% | 0.61 | 4.9% | 9.8% | [67] |
| Scophthalmus maximus | Viscera | Folch | 33.3% | 17.7% | 0.86 | 2.7% | 7.6% | [67] |
| Sparus aurata | Fishbone | Bligh and Dyer | 33.8% | 13.6% | 1.48 | 2.8% | 4.6% | [65] |
| Sparus aurata | Frames | Folch | 28.5% | 12.3% | 1.27 | 2.2% | 4.8% | [67] |
| Sparus aurata | Gills | Bligh and Dyer | 31.2% | 11.9% | 1.62 | 1.9% | 4.1% | [65] |
| Sparus aurata | Guts | Bligh and Dyer | 33.1% | 12.1% | 1.75 | 1.8% | 3.5% | [65] |
| Sparus aurata | Heads | Bligh and Dyer | 33.8% | 14.0% | 1.41 | 2.8% | 5.0% | [65] |
| Sparus aurata | Heads | Folch | 28.4% | 12.7% | 1.20 | 2.2% | 5.2% | [67] |
| Sparus aurata | Liver | Bligh and Dyer | 32.2% | 13.6% | 1.38 | 1.9% | 4.9% | [65] |
| Sparus aurata | Skin | Bligh and Dyer | 33.2% | 12.9% | 1.57 | 2.0% | 4.0% | [65] |
| Sparus aurata | Skin | Folch | 29.9% | 13.2% | 1.21 | 2.3% | 5.5% | [67] |
| Sparus aurata | Trimmings | Folch | 29.6% | 13% | 1.23 | 2.2% | 5.4% | [67] |
| Sparus aurata | Viscera | Folch | 28.8% | 12.9% | 1.20 | 1.7% | 5.9% | [67] |
| Thunnus thynnus | Minced side streams | Folch | 33.2% | 29.9% | 0.06 | 9.9% | 13.6% | [70] |
A few studies were able to characterize the lipid classes in terms of their distribution in several fish co-products. The phospholipid content in salmon heads was reported to represent 65.5% of total lipids, with the main polar lipids present being phosphatidylcholine (up to 43.4%) and phosphatidylethanolamine (31.2% of total phospholipid) [89]. Phospholipids in salmon (S. salar) heads were proposed to represent effective carriers of highly unsaturated fatty acids, given their remarkable content of EPA and especially DHA [87][89]. In the heads, roe, and skin of another salmon species (O. tshawytscha), phospholipids were reported to represent 1.9%, 1.3%, and 3.2% of wet tissue, respectively [77]. In all organs, phosphatidylcholine was the most abundant phospholipid class by a wide margin (especially in roe), followed by sphingomyelin in the head and roe, and phosphatidylethanolamine in the skin. Phospholipids were especially enriched in EPA and DHA when compared to neutral lipids, namely triglycerides [77]. The heads, skin, roe, and male gonads of blue mackerel (S. australasicus) were also studied in terms of their phospholipid content, displaying 2.7%, 2.8%, 3.5%, and 1.9% of phospholipids in wet tissue, respectively [67]. Again, phosphatidylcholine was the most abundant phospholipid class (especially in roe), with the exception of the gonads, where sphingomyelin was the major class present. Phospholipids containing omega-3 fatty acids were higher in roe (55.5%) compared to the head (40.9%), skin (21.8%), and male gonads (32%) [67].
2.2. Crustaceans
Crustacean processing co-products may represent viable and sustainable sources of quality lipids. The lipid content in the co-products of different species of crustaceans is very variable, depending on the species, the specificities of the co-products themselves, and the extraction methods employed for their characterization [90][91].
Co-products (heads, shells, and tails) of speckled shrimp (Metapenaeus monoceros) and striped prawn (Penaeus kerathurus) presented total lipid contents of 2.6% and 3.2%, respectively, which are higher values than those reported for the edible parts (muscle) [92]. Another study also reported that total lipid contents were higher in co-products of northern shrimp (Pandalus borealis) and the prawn Trachypena curvirostris (0.6% and 0.7% wet weight) compared to the muscle (0.4% and 0.3%, respectively) [31][33]. Brazilian redspotted shrimp (Penaeus paulensis) waste, also including a mixture of heads, shells, and tails, was reported to contain 4.9% lipids [90]. The lipid content in Argentine red shrimp (Pleoticus muelleri) co-products was reported to reach up to 11.3% (DW) in a mixture of carapaces plus heads (only 4% in just shells) [29].
Among shrimp waste products, shrimp cephalothorax and hepatopancreas have also been explored and proposed as viable sources of lipids with a high PUFA content. The total lipid content of brown shrimp (Penaeus californiensis) cephalotorax was reported to be 9.1% [93]. In Pacific white shrimp (P. vannamei), the cephalothorax and hepatopancreas presented lipid yields of up to 2.9% and 12.64% DW, respectively [32][94][95], although a different study reported a much higher lipid content in Pacific white shrimp cephalothorax (11.9% DW) [96]. In giant tiger prawn (P. monodon), the lipid content in the cephalothorax was reported to be higher in farmed (9.4% DW) than wild specimens (7.1%) [97]. Lipid content was higher in the heads than in the muscle of P. monodon, highlighting the quality of lipids from crustacean co-product sources. Also, total lipids in wild shrimp P. kerathurus cephalothorax (2.4% wet weight) was reported to be higher than those of muscle (1.0%) [98], and in Indian white shrimp (Penaeus indicus), total lipids in carapaces was shown to be 2% higher than those in the edible portion [99].
Among other crustaceans, the total lipid content in Norway lobster (Nephrops norvegicus) cephalothorax was reported to reach 11.5% (DW) in the summer [35]. Australian lobster (Panulirus cygnus) cephalothorax was reported to display a lipid content of 19.4% [100]. Lobster hepatopancreas was reported to be even more lipid-rich, with the lipid from these organs in Australian rock lobster (Jasus edwardsii) representing up to 24.3% [101]. For the side streams of the snow crab (Chionoecetes opilio), the reported lipid content was also very significant (14.8%) [102]. However, the southern king crab (Lithodes santolla) was reported to display a total lipid content of only 0.5% (DW) in its exoskeleton [29].
Most of the characterizations of lipid content in crustacean co-products focus on determining their fatty acid profiles (Table 2). Results vary, even for co-products from the same species, most likely due to the analytic techniques used. Nevertheless, in general, crustacean co-products do present significant amounts of PUFAs (close to or above 40%), low n-6/n-3 ratios, and, in some cases more than others, can represent viable sources of EPA and DHA. In some studies where co-products were studied in parallel to the edible parts of the animals (muscle), it is possible to observe that their fatty acid profiles are quite similar [31][92][98], highlighting the viability of using these co-products as sources of quality lipids.
Table 2. Studies characterizing the fatty acid profiles of crustacean co-products using conventional extraction methods, with an emphasis on healthy characteristics. Results are presented as percentages of total fatty acids.
| Species | Co-Product | Extraction | PUFAs | Omega-3 | n-6/3 | EPA | DHA | Ref. |
|---|---|---|---|---|---|---|---|---|
| Chionoecetes opilio | Co-product mix (cephalothorax, digestive system, and physiological liquid) | Bligh and Dyer | 24.4% | 21.1% | 0.10 | 9.9% | 8.9% | [102] |
| Commercial crab (no specified species) |
Shells | Folch | 35.9% | 23.2% | 0.52 | 12.5% | 9.9% | [103] |
| Commercial shrimp (no specified species) |
Shells | Folch | 40.9% | 12.3% | 2.2 | 6.3% | 4.1% | [103] |
| Jasus edwardsii | Hepatopancreas | Soxhlet | 7.8% | 3.1% | 1.52 | 0.9% | 0.9% | [101] |
| Lithodes santolla | Exoskeleton | Bligh and Dyer | 40.0% | 40.0% | 0 | 20.5% | 14.4% | [29] |
| Metapenaeus monoceros | Minced co-product (heads, tails, shells) | Folch | 34.5% | ------ | ------ | 8.9% | 6.9% | [92] |
| Nephrops norvegicus | Heads | Folch | 36.2% | 27.6% | 0.26 | 15.5% | 8.4% | [35] |
| Pandalus borealis | Co-product mix (heads, tails, shells) | Bligh and Dyer | 43.9% | 24.2% | 0.57 | 8.9% | 10.7% | [31] |
| Pandalus borealis | Processing co-product | Soxhlet | 41.1% | 37.1% | 0.11 | 21.1% | 13.9% | [33] |
| Panulirus cygnus | Cephalothorax | Folch | 38.2% | 13.5% | 0.64 | 5.6% | 4.2% | [100] |
| Penaeus japonicus | Hepatopancreas | Folch | 37.2% | 20.0% | 0.82 | 8.4% | 6.1% | [104] |
| Penaeus kerathurus | Cephalothorax | Bligh and Dyer | 44.5% | 28.7% | 0.55 | 14.5% | 13.4% | [98] |
| Penaeus kerathurus | Minced co-product (heads, tails, shells) | Folch | 38.8% | ------ | ------ | 12.2% | 16.1% | [92] |
| Penaeus monodon | Heads | Bligh and Dyer | 44.8% | 29.8% | 0.50 | 15.4% | 13.3% | [97] |
| Penaeus paulensis | Minced co-product (heads, tails, shells) | Bligh and Dyer | 34.6% | 26.0% | 0.30 | 11.7% | 12.2% | [90] |
| Penaeus vannamei | Cephalothorax | Bligh and Dyer | 43.0% | 12.2% | ------ | 5.0% | 7.2% | [105] |
| Penaeus vannamei | Cephalothorax | Folch | 42.5% | 10.5% | ------ | 4.1% | 6.4% | [105] |
| Penaeus vannamei | Cephalothorax | Bligh and Dyer | 39.3% | 14.7% | 1.67 | 4.6% | 8.3% | [32] |
| Penaeus vannamei | Cephalothorax | “Typical solvent extraction” | 48.5% | 24.5% | 0.95 | 9.6% | 13.3% | [106] |
| Penaeus vannamei | Cephalothorax | “Solvent extraction” | 37.5% | 18.1% | 1.08 | 9.2% | 8.1% | [107] |
| Penaeus vannamei | Hepatopancreas | Bligh and Dyer | 37.4% | 10.6% | 2.53 | 2.2% | 6.2% | [32] |
| Penaeus vannamei | Hepatopancreas | Bligh and Dyer | 38.1% | 16.2% | 1.35 | 3.3% | 10.4% | [95] |
| Pleoticus muelleri | Shells | Bligh and Dyer | 52.0% | 50.3% | 0.03 | 21.5% | 22.3% | [29] |
| Pleoticus muelleri | Shells + heads | Bligh and Dyer | 43.9% | 42.3% | 0.04 | 14.9% | 22.0% | [29] |
| Trachypena curvirostris | Co-product mix (heads, tails, shells) | Bligh and Dyer | 48.3% | 26.1% | 0.44 | 10.7% | 10.9% | [31] |
A few studies characterizing the lipid fractions of crustacean co-products also discriminate the distributions of different lipid classes. Phospholipids are generally reported as being the major lipid class in crustacean co-products. Phospholipids (64.2% of total lipid) were in fact the main lipid class present in processing co-products from northern shrimp (P. borealis), with sterols representing 21.2% and triglycerides 13.7% [33]. In the cephalotorax of brown shrimp (P. californiensis), phospholipids were the main lipid class reported (6.0% of total weight), followed by sterols (2.7%) and free fatty acids (1.3%), with triglycerides only representing 0.6% of total weight [93]. The major lipid class reported to be present in the cephalothorax of Pacific white shrimp (P. vannamei) are also phospholipids, although their amount changes between reports (from 68.3% [95] to 82.51% [32]), with phosphatidylcholine and phosphatidylethanolamine being the main phospholipid classes present [108]. These phospholipid percentages are similar to those reported for the lipids in the meat of both the giant tiger prawn (P. monodon) and whiteleg shrimp (P. vannamei) (74.5% and 72.3%, respectively) [109]. The cephalothorax of P. vannamei contained 13.7% of phospholipids (DW), a significant part of which were PUFA-structured, and phosphatidylcholine was the most abundant class, followed by phosphatidylethanolamine [105]. The heads of P. monodon contained 39.2% phospholipids and 25.9% triglycerides (fewer phospholipids and more triglycerides than the muscle) [97]. Phosphatidylcholine represented 52.0% of total phospholipids, phosphatidylethanolamine 27.1%, sphingomyelin 9.0%, phosphatidylserine 7.9%, and phosphatidylinositol 2.9%, a profile very similar to the muscle [105]. In striped prawn (P. kerathurus) cephalothorax, polar lipids represented 48.3% of total lipids, with phospholipids representing 94.3% of the total polar lipid [98]. Similarly, in P. monodon cephalothorax [97], phosphatidylcholine was the major phospholipid present, representing 47.2% of total cephalothorax phospholipids, followed by phosphatidylethanolamine, representing 24.7% of polar lipids [98]. Phosphatidylethanolamine was found to contain higher proportions of omega-3 fatty acids than phosphatidylcholine, especially DHA [98], while the presence of plasmalogen species from both phosphatidylethanolamine and phosphatidylcholine was also unveiled [98]. Notwithstanding the studies referred above, the hepatopancreas of Japanese tiger prawn (Penaeus japonicus) displayed triglycerides as the main lipid class present (37.8%) and not phospholipids (35.5%) [104][110]. This was also the case in the hepatopancreas of P. vannamei, with triglycerides representing the major lipid class present, at 45.4%, and phospholipids representing 38.0% of total lipid content [32].
The lipid fraction of Norway lobster (N. norvegicus) cephalothorax was shown to contain 33.9% triglycerides and 31.8% phospholipids, with the other main lipid classes present being free fatty acids (15%) and cholesterol/sterols (14.9%) [35]. The main phospholipids present were phosphatidylcholine (14.0% of total lipids) and phosphatidylethanolamine (7.4%) [35]. Another study reported triglycerides to be the major lipid class in a homogenate of C. opilio co-products (more than 50% of total lipids), with phospholipids representing just 6.2% [102].
When comparing lipids from crustaceans to fish oils, one obvious difference is the presence of carotenoids as additional bioactive compounds [111]. Lipophilic fractions obtained from crustaceans (e.g., lobsters, shrimp, crabs, and krill) are an especially important source of natural carotenoids, with astaxanthin in particular being the most valued and most abundant [94][112][113][114]. Total carotenoid and astaxanthin content in crustacean co-products were shown to vary with species, season, and environmental grown conditions (feed and habitat) [36][115]. Shrimp waste (including from P. paulensis, P. vannamei, P. borealis, P. indicus, Xiphopenaeus kroyeri) has been reported to represent a good source of carotenoids, especially astaxanthin, presenting yields in the range of 40–148 µg/g waste [33][116][117][118][119][120]. Modern extraction approaches, namely ultrasonication/ultrasound-assisted techniques, have also been tested for the recovery of carotenoids from shrimp co-products with good results [106][107].
The exoskeletons of other crustaceans, namely crabs, were also reported to be good sources of carotenoids and astaxanthin in particular. The shells of the blue crab (Callinectes bellicosus) and the Mexican brown crab (Callinectes sapidus) contained 39 and 44 μg/g (DW) of astaxanthin [120], while the shell of the marine crab Charybdis cruciata contained 11.0 mg/g carotenoids, with astaxanthin representing 65.5% of that total [115]. Lobsters may also be an interesting source of natural carotenoids and astaxanthin, with yields of 70.4 and 41.6 μg/mL, respectively, being recorded in the exoskeletons of Australian rock lobsters (J. edwardsii) [36].
Liposoluble vitamins have also been described and quantified in crustacean co-products, such as the cephalothorax of whiteleg shrimp (P. vannamei), where vitamin A content ranged from 0.9 to 1.6 mg/100 g of waste, while vitamin E represented up to 49.0 mg/100 g [121].
2.3. Mollusks
Studies characterizing the lipid content of co-products of hard-shelled mollusks and cephalopods are scarcer, but the ones available also highlight the potential of these raw materials as sources of lipids with beneficial characteristics for human health.
Waste from great scallops (Pecten maximus) (comprising the mantle, gill, liver, digestive gland, and kidney) were reported to contain 8.6% total lipids (DW) in one study [122], while another reported higher levels (14.2% DW) [123]. The viscera of pen shell scallops (Pinna rugosa) presented 7.5% lipids in their composition,
With regard to cephalopods, the lipid yield of a pool of Patagonian squid (Doriteuthis gahi) co-products (viscera, heads, skin) was reported to amount to up to 10.3% (DW), depending on the extraction solvents used [42][124], while Argentine shortfin squid (Illex argentinus) viscera presented up to 11.1% lipid content [125] and the lipid content in giant squid (Dosidicus gigas) viscera was reported to represent 20.0% [93]. In viscera fractions from cuttlefish (Sepia officinalis), consisting of the stomach, intestines, and pyloric caeca, the lipid content was reported to represent 4.0% (DW) [71]. In the common octopus (Octopus vulgaris), co-products were reported to display a lipid content of 13.7% DW [41].
Focusing on the healthy characteristics of the fatty acid content in mollusk co-products, the available studies characterizing the fatty acid contents of these biological matrixes are summarized in Table 3. From the analysis of available information, it is possible to notice that mollusk co-products could generally represent excellent sources of PUFA and omega-3, with emphasis on both EPA and DHA. Moreover, in some cases, these enticing characteristics are comparable to those of the edible parts of these animals, namely in squid, thus confirming the viability of exploring these largely overlooked resources as healthy lipid sources [124].
Table 3. Studies characterizing the fatty acid profiles of mollusk co-products, with an emphasis on healthy characteristics. Results are presented as percentages of total fatty acids.
| Hard-Shelled Mollusks | Co-Product | Extraction | PUFAs | Omega-3 | n-6/3 | EPA | DHA | Ref. |
| Pecten maximus | Pooled mantle, gill, liver, digestive gland, kidney |
Supercritical extraction | 42.1% | 40.7% | 0.03 | 20.0% | 12.3% | [123] |
| Pinna rugosa | Viscera | Folch | 41.8% | 37.5% | ------ | 17.0% | 20.0% | [93] |
| Cephalopods | Co-product | Extraction | PUFAs | Omega-3 | n-6/3 | EPA | DHA | Ref. |
| Commercial squid (no specified species) |
Squid viscera oil | Supercritical extraction | 44.7% | ------ | ------ | 15.1% | 24.9% | [43] |
| Doryteuthis gahi | Pooled viscera, heads, skin | Bligh and Dyer | 52.6% | 48.6% | 0.08 | 17.2% | 30.8% | [124] |
| Dosidicus gigas | Viscera | Folch | 36.6% | 34.0% | ------ | 15.5% | 17.8% | [93] |
| Illex argentinus | Viscera | Wet pressing | ------ | ------ | 0.75 | 9.3% | 16.4% | [125] |
| Octopus vulgaris | Pooled co-products | Bligh and Dyer | 49.3% | 36.8% | 0.34 | 12.9% | 22.2% | [41] |
| Sepia officinalis | Viscera | Bligh and Dyer | 44.0% | 26.0% | 0.69 | 11.6% | 6.3% | [71] |
Some studies characterizing lipid class distribution in mollusk co-products are also available. In co-products of great scallops (P. maximus) (a homogenate of the mantle, gill, liver, and kidney), phospholipids represented 1.8% of dry scallop waste [122]. Phospholipids were the most abundant lipid class in Patagonian squid (D. gahi) co-products (up to 46.4% of total lipids of pooled viscera, heads, and skin), followed by free fatty acids (up to 28.2%) and sterols (up to 13.2%), while triglycerides only represented up to 1.3.1% [124][126][127]. Another study reported the phospholipids in the co-products of P. maximus to be especially rich in DHA, with phosphatidylcholine being the major phospholipid class present, followed by lysophosphatidylcholine and phosphatidylethanolamine [123]. Considerable amounts of phosphatidylcholine and phosphatidylethanolamine plasmalogens were also detected. Also in the viscera of pen shell scallops (P. rugosa), phospholipids were again the main lipid class present (2.8% of total weight), followed by sterols (1.6%), with triglycerides representing 0.9% [93].
In turn, the viscera of giant squid (D. gigas) presented 10.8% phospholipids, 3.0% sterols, and 2.7% triglycerydes [93]. In Japanese flying squid (Todarodes pacificus) viscera residues, phospholipids were also the major lipid class present [128]. Phosphatidylcholine (80.5%) and phosphatidylethanolamine (13.2%) were the main phospholipids present, with both classes displaying significant amounts of EPA and DHA [128]. Pen squid (Loligo sp) and big blue octopus (Octopus cyanea) co-products were shown to be rather different, with sphingosines predominating in Loligo sp. extracts, while glycerolipids and glycerophospholipids predominated in O. cyanea [44]. Omega-3 fatty acids were reported to be major components of phospholipids, and substantial amounts of plasmalogens were also detected [44]. Phospholipids constituted 22.9% of total lipid content in the co-products of the common octopus (O. vulgaris) [41]. Interestingly, in other squid organs, namely the liver, the major lipid class were not phospholipids but rather triglycerides, as is the case for the arrow squid (Heterololigo bleekeri) (up to 63% of total lipids) [129], schoolmaster gonate squid (Berryteithis magister) (53%) [130], and Humboldt squid (D. gigas) (up to 27%) [131].
Patagonian squid (D. gahi) co-products were also explored for their liposoluble vitamin E contents in lipid extracts and were reported to be especially rich in tocopherols, (especially α-tocopherol, up to 2.8 mg/Kg), therefore being suggested as novel and valuable sources for α-tocopherol extraction from marine animal origin [42][124][127].
3. The Value of Marine Animal Co-Product Lipids for Human Health
Lipids make up a wide group of essential macronutrients which are incorporated into the diet and represent energy resources for the cell while also performing other roles in important physiological functions such as cellular signaling and regulation of cell membrane physical characteristics and function [132]. An unbalanced lipid intake can cause either a deficiency in essential fatty acids and fat-soluble vitamins [133][134][135], or, in excess, can lead to problems linked with metabolic syndrome, like hypertension, diabetes, and cardiovascular issues, but also to liver disease [136][137]. Recent knowledge has pointed out diacylglycerols and structured (and PUFA-rich) triglycerides and phospholipids (especially omega-3-containing phospholipids) as representing improved nutritional and health value [138]. The lipid content of marine animal co-products is generally recognized as being nutraceutically rich, including PUFAs, omega-3 fatty acids, and lipid-soluble vitamins. A summary of the beneficial health effects ascribed to the lipids present in marine animal co-products is presented in Figure 4. The lipid content in marine animal co-products, although not predominant, is still very substantial, especially, as described before, in certain fish and shellfish species (it can represent more than 25% of co-products of meagre (A. regius) [68], sea bass (D. labrax) [67][69], Chinook salmon (O. tshawytscha) [77], gilthead sea bream (S. aurata) [65][68], sardinelle (S. aurita) [71], salmon (S. salar) [67], or bluefin thuna (T. thynnus) [70]), crustaceans (it can amount to more than 10% DW in shrimp co-products of Argentine red shrimp (P. muelleri) [29] or whiteleg shrimp (P. vannamei) [106][107] and to more than 15% in some lobsters, namely Australian lobster (P. cygnus) [100] and Australian rock lobster (J. edwardsii) [101]) and mollusks (more than 10% in Patagonian squid (D. gahi) [42][124], Argentine shortfin squid (I. argentinus) [125], giant squid (D. gigas) [93], or common octopus (O. vulgaris) [41] co-products). Obviously, the higher the lipid content, the more justifiable it is to explore and take advantage of these co-product matrixes as possible sources of healthy lipids. Interestingly, the lipid content in some of the previously profiled co-products is comparable, or, at times, even higher than that reported in the edible portions of the same species; this feature has already been documented in fish [139], crustaceans [140][141], or mollusks [142]. A comprehensive study comprising fish, crustacean, and mollusk species showed that this is consistently the case, with co-products being more lipid-rich than edible muscle portions in all cases [143].
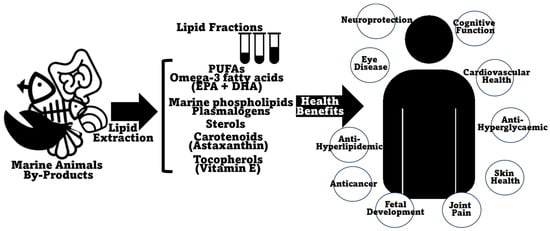
Figure 4. Schematic representation of the beneficial health-promoting effects and biological activities ascribed to/reported in lipids and lipid fractions of marine animal co-products.
Lipids from marine animals are usually associated with a healthy content of PUFAs and omega-3 fatty acids, namely EPA and DHA [144], with DHA- and EPA-containing phospholipids being often referred to as “marine phospholipids” [145][146]. In fact, from a chemical standpoint, marine lipids are generally more varied in their fatty acid content and present longer chain fatty acids (besides the aforementioned prevalence of PUFAs, omega-3, and EPA and DHA in particular) than terrestrial plants and animals [147]. The fact that the human metabolism of alpha-linolenic acid of plant-derived origins to synthetize EPA de novo is negligible [53] and that the metabolism of EPA to DHA is virtually non-existent [148][149][150] implies that EPA and DHA must be acquired from the diet, making marine sources of these fatty acids even more critical from a nutritional standpoint. Moreover, the current human consumption and plasma levels of EPA and DHA are generally considered deficient, and are definitely lower than those considered to be ancestral values [151][152]. An intake of up to 0.5 g of EPA + DHA per day is recommended by health agencies to foster the prevention of cardiovascular diseases and other metabolic disorders [53][153][154][155].
The benefits of PUFA consumption have always been highlighted, normally in opposition to the detrimental effects of excessive saturated fatty acid consumption (namely increased risk of cardiovascular disease and type-2 diabetes) [156]. Lately, the benefits of PUFAs have been increasingly focused on the content of omega-3 fatty acids, and of EPA and DHA in particular [148][157][158][159]. Omega-3 fatty acids have essentially been elevated to the status of wide-spectrum nutraceuticals, with reported beneficial impacts on eye disease, bone health, fetal development, cardiovascular disease, diabetes, cancer treatment/prevention, cognitive function, neurodegenerative diseases, and inflammation [53][160][161][162][163][164]. The most immediate association between omega-3 fatty acids and health-promoting benefits concerns cardiovascular disease, although this association has been a matter of some controversy as of late [165][166][167]. Currently, there have been some steps towards the differentiation of the effects of EPA and DHA, with EPA being shown to present more beneficial effects than EPA/DHA formulations, at least for some specific cases [167][168]. In fact, the pharmacologies of EPA and DHA are distinct, with divergent effects on membrane structure, lipoprotein oxidation, and on the production of downstream metabolites that modulate the resolution of inflammation [168]. Marine animal co-products were reported to generally present substantial omega-3 fatty acid content, comparable to the edible parts of the animals, therefore making them good alternative sources of these specific nutrients.
Among fish co-products, those from marbled rockcod (Notothenia rossii, >30% omega-3 fatty acids [84]), blue mackerel (S. australasicus, >35% [78]), and Atlantic bluefin tuna (T. thynnus, 29.9% [70]), the viscera of sardinelle (S. aurita, 26.1% [71]), and the co-products of Atlantic herring (C. harengus, 26.5% [83]) are especially good potential omega-3 sources. In crustaceans, the exoskeletons of southern king crab (L. santolla, 40% [29]), exoskeletons and heads of Argentine red shrimp (P. muelleri, >40% [29]), processing co-products of northern shrimp (P. borealis, 37.1% [33]), and the cephalothorax of the Norway lobster (N. norvegicus, 27.6% omega-3 fatty acids) [35] present the highest percentages of omega-3. Mollusk co-products may represent especially promising sources of omega-3 fatty acids, with Patagonian squid (D. gahi) co-products containing up to 48.6% [124] and the co-products of great scallops (P. maximus) displaying a remarkable 40.7% of omega-3 fatty acids [123]. Concerning EPA, the processing co-products of P. borealis (21.1% EPA) [33] and the exoskeletons of southern king crab (L. santolla, 20.5%) [29] present the highest percentual EPA contents among crustaceans, as do the co-products of wild scallops (P. maximus, 20% [123]), Patagonian squid (D. gahi, 17.2% [124][127]), and pen shell scallops (P. rugosa, 17% [93]) among mollusks. As for DHA, the roe (and male gonads) of blue mackerel (S. australasicus [78]), shells and heads of Argentine red shrimp (P. muelleri [29]), and especially the co-products of mollusks, especially Patagonian squid (D. gahi [127]) and common octopus (O. vulgaris [41]), can contain over 20% of this particular omega-3 fatty acid. Another way to look at the benefits that lipids from marine animal co-products may entail has to do with the low n-6/n-3 fatty acid ratios consistently reported. A low n-6/n-3 ratio has been reported to promote beneficial effects on inflammatory conditions, cancer, and cardiovascular and neurological disorders [169][170]. A ratio of 4–5 to 1 or lower is recommended, although it is reported to normally be much higher in Western diets [171][172]. Therefore, with many co-products studied presenting extremely low n-6/n-3 ratios, they present nutritional characteristics that are optimal to mitigating the pernicious effects of modern diets in Western countries.
This entry is adapted from the peer-reviewed paper 10.3390/md22020073
References
- FAO. The State of World Fisheries and Aquaculture 2022; Food and Agriculture Organization: Rome, Italy, 2022; Volume 3.
- OECD/FAO. OECD-FAO Agricultural Outlook; OECD Publishing: Paris, France, 2023.
- Hicks, D.T. Seafood Safety and Quality: The Consumer’s Role. Foods 2016, 5, 71.
- Ozogul, F.; Cagalj, M.; Šimat, V.; Ozogul, Y.; Tkaczewska, J.; Hassoun, A.; Kaddour, A.A.; Kuley, E.; Rathod, N.B.; Phadke, G.G. Recent developments in valorisation of bioactive ingredients in discard/seafood processing by-products. Trends Food Sci. Technol. 2021, 116, 559–582.
- Venugopal, V. Valorization of Seafood Processing Discards: Bioconversion and Bio-Refinery Approaches. Front. Sustain. Food Syst. 2021, 5, 611835.
- Cooney, R.; de Sousa, D.B.; Fernández-Ríos, A.; Mellett, S.; Rowan, N.; Morse, A.P.; Hayes, M.; Laso, J.; Regueiro, L.; Wan, A.H.L.; et al. A circular economy framework for seafood waste valorisation to meet challenges and opportunities for intensive production and sustainability. J. Clean. Prod. 2023, 392, 136283.
- Mutalipassi, M.; Esposito, R.; Ruocco, N.; Viel, T.; Costantini, M.; Zupo, V. Bioactive Compounds of Nutraceutical Value from Fishery and Aquaculture Discards. Foods 2021, 10, 1495.
- Olsen, R.L.; Toppe, J.; Karunasagar, I. Challenges and realistic opportunities in the use of by-products from processing of fish and shellfish. Trends Food Sci. Technol. 2014, 36, 144–151.
- Coppola, D.; Lauritano, C.; Palma Esposito, F.; Riccio, G.; Rizzo, C.; de Pascale, D. Fish Waste: From Problem to Valuable Resource. Mar. Drugs 2021, 19, 116.
- Ideia, P.; Pinto, J.; Ferreira, R.; Figueiredo, L.; Spínola, V.; Castilho, P.C. Fish Processing Industry Residues: A Review of Valuable Products Extraction and Characterization Methods. Waste Biomass Valorization 2020, 11, 3223–3246.
- Saravanan, A.; Yuvaraj, D.; Senthil Kumar, P.; Karishma, S.; Rangasamy, G. Fish processing discards: A plausible resource for valorization to renewable fuels production, optimization, byproducts and challenges. Fuel 2023, 335, 127081.
- Samat, A.F.; Muhamad, N.A.S.; Abd Rasib, N.A.; Mohd Hassan, S.S.; Ahmad Sohaimi, K.S.; Iberahim, N.I. The Potential of Biodiesel Production derived from Fish Waste. IOP Conf. Ser. Mater. Sci. Eng. 2018, 318, 012017.
- The Marine Ingredients Organisation. The Global Growth of By-Products. Available online: https://www.iffo.com/global-growth-products (accessed on 10 January 2024).
- Zhang, J.; Akyol, Ç.; Meers, E. Nutrient recovery and recycling from fishery waste and by-products. J. Environ. Manag. 2023, 348, 119266.
- Pounds, A.; Kaminski, A.M.; Budhathoki, M.; Gudbrandsen, O.; Kok, B.; Horn, S.; Malcorps, W.; Mamun, A.A.; McGoohan, A.; Newton, R.; et al. More Than Fish-Framing Aquatic Animals within Sustainable Food Systems. Foods 2022, 11, 1413.
- Regueiro, L.; Newton, R.; Soula, M.; Méndez, D.; Kok, B.; Little, D.C.; Pastres, R.; Johansen, J.; Ferreira, M. Opportunities and limitations for the introduction of circular economy principles in EU aquaculture based on the regulatory framework. J. Ind. Ecol. 2022, 26, 2033–2044.
- Woodgate, S.L.; Wilkinson, R.G. The role of rendering in relation to the bovine spongiform encephalopathy epidemic, the development of EU animal by-product legislation and the reintroduction of rendered products into animal feeds. Ann. Appl. Biol. 2021, 178, 430–441.
- Kumar, V.; Muzaddadi, A.; Mann, S.; Balakrishnan, R.; Bembem, K.; Kalnar, Y. Utilization of Fish Processing Waste: A Waste to Wealth Approach. In Emerging Post-Harvest Engineering and Techological Interventions for Enhancing Farmer’s Incom; ICAR-CIPHET: Ludhiana, India, 2022; pp. 127–131.
- European Commission. Oceans and Fisheries–Consumption. Available online: https://oceans-and-fisheries.ec.europa.eu/facts-and-figures/facts-and-figures-common-fisheries-policy/consumption_en (accessed on 10 January 2024).
- Siddiqui, S.A.; Schulte, H.; Pleissner, D.; Schönfelder, S.; Kvangarsnes, K.; Dauksas, E.; Rustad, T.; Cropotova, J.; Heinz, V.; Smetana, S. Transformation of Seafood Side-Streams and Residuals into Valuable Products. Foods 2023, 12, 422.
- Toppe, J.; Olsen, R.L.; Peñarubia, O.R.; James, D.G. Production and Utilization of Fish Silage: A Manual on How to Turn Fish Waste into Profit and a Valuable Feed Ingredient or Fertilizer; Food and Agriculture Organization of the United Nations: Rome, Italy, 2018.
- Villamil, O.; Váquiro, H.; Solanilla, J.F. Fish viscera protein hydrolysates: Production, potential applications and functional and bioactive properties. Food Chem. 2017, 224, 160–171.
- Boronat, Ò.; Sintes, P.; Celis, F.; Díez, M.; Ortiz, J.; Aguiló-Aguayo, I.; Martin-Gómez, H. Development of added-value culinary ingredients from fish waste: Fish bones and fish scales. Int. J. Gastron. Food Sci. 2023, 31, 100657.
- Rustad, T.; Storrø, I.; Slizyte, R. Possibilities for the utilisation of marine by-products. Int. J. Food Sci. Technol. 2011, 46, 2001–2014.
- Pedrosa, E.; Costa, C.; Lobato, L.; Mendes, S.; Oliveira, B. Study of the Edible Portion of Some Fishes. Rev. Nutr. 2014, 20, 20–24.
- Pinheiro, A.C.D.A.S.; Martí-Quijal, F.J.; Barba, F.J.; Tappi, S.; Rocculi, P. Innovative Non-Thermal Technologies for Recovery and Valorization of Value-Added Products from Crustacean Processing By-Products—An Opportunity for a Circular Economy Approach. Foods 2021, 10, 2030.
- Saima, M.K.; Roohi, I.Z.A. Isolation of novel chitinolytic bacteria and production optimization of extracellular chitinase. J. Genet. Eng. Biotechnol. 2013, 11, 39–46.
- Hamed, I.; Özogul, F.; Regenstein, J.M. Industrial applications of crustacean by-products (chitin, chitosan, and chitooligosaccharides): A review. Trends Food Sci. Technol. 2016, 48, 40–50.
- Cretton, M.; Malanga, G.; Mazzuca Sobczuk, T.; Mazzuca, M. Lipid Fraction from Industrial Crustacean Waste and Its Potential as a Supplement for the Feed Industry: A Case Study in Argentine Patagonia. Waste Biomass Valorization 2021, 12, 2311–2319.
- Sachindra, N.M.; Bhaskar, N.; Mahendrakar, N.S. Carotenoids in different body components of Indian shrimps. J. Sci. Food Agric. 2005, 85, 167–172.
- Heu, M.-S.; Kim, J.-S.; Shahidi, F. Components and nutritional quality of shrimp processing by-products. Food Chem. 2003, 82, 235–242.
- Takeungwongtrakul, S.; Benjakul, S.; H-kittikun, A. Lipids from cephalothorax and hepatopancreas of Pacific white shrimp (Litopenaeus vannamei): Compositions and deterioration as affected by iced storage. Food Chem. 2012, 134, 2066–2074.
- Phadtare, I.; Vaidya, H.; Hawboldt, K.; Cheema, S.K. Shrimp Oil Extracted from Shrimp Processing By-Product Is a Rich Source of Omega-3 Fatty Acids and Astaxanthin-Esters, and Reveals Potential Anti-Adipogenic Effects in 3T3-L1 Adipocytes. Mar. Drugs 2021, 19, 259.
- Cahú, T.B.; Santos, S.D.; Mendes, A.; Córdula, C.R.; Chavante, S.F.; Carvalho, L.B.; Nader, H.B.; Bezerra, R.S. Recovery of protein, chitin, carotenoids and glycosaminoglycans from Pacific white shrimp (Litopenaeus vannamei) processing waste. Process Biochem. 2012, 47, 570–577.
- Albalat, A.; Nadler, L.E.; Foo, N.; Dick, J.R.; Watts, A.J.R.; Philp, H.; Neil, D.M.; Monroig, O. Lipid Composition of Oil Extracted from Wasted Norway Lobster (Nephrops norvegicus) Heads and Comparison with Oil Extracted from Antarctic Krill (Euphasia superba). Mar. Drugs 2016, 14, 219.
- Nguyen, T.T.; Barber, A.R.; Corbin, K.; Zhang, W. Lobster processing by-products as valuable bioresource of marine functional ingredients, nutraceuticals, and pharmaceuticals. Bioresour. Bioprocess. 2017, 4, 27.
- Naik, A.S.; Hayes, M. Bioprocessing of mussel by-products for value added ingredients. Trends Food Sci. Technol. 2019, 92, 111–121.
- Tokeshi, M.; Ota, N.; Kawai, T. A comparative study of morphometry in shell-bearing molluscs. J. Zool. 2000, 251, 31–38.
- Morris, J.P.; Backeljau, T.; Chapelle, G. Shells from aquaculture: A valuable biomaterial, not a nuisance waste product. Rev. Aquac. 2019, 11, 42–57.
- Uzcátegui, L.U.M.; Vergara, K.; Martínez Bordes, G. Sustainable alternatives for by-products derived from industrial mussel processing: A critical review. Waste Manag. Res. 2022, 40, 123–138.
- Méndez, L.; Rodríguez, A.; Aubourg, S.P.; Medina, I. Low-Toxicity Solvents for the Extraction of Valuable Lipid Compounds from Octopus (Octopus vulgaris) Waste. Foods 2023, 12, 3631.
- Rodríguez, A.; Trigo, M.; Aubourg, S.P.; Medina, I. Optimisation of Low-Toxicity Solvent Employment for Total Lipid and Tocopherol Compound Extraction from Patagonian Squid By-Products. Foods 2023, 12, 504.
- Kang, K.-Y.; Ahn, D.-H.; Wilkinson, G.T.; Chun, B.-S. Extraction of lipids and cholesterol from squid oil with supercritical carbon dioxide. Korean J. Chem. Eng. 2005, 22, 399–405.
- Fitahia, E.M.; Croyal, M.; Raheriniaina, C.E.; Ferchaud-Roucher, V.; Nazih, H. High-Resolution Mass Spectrometry Unravels a Broad Range of Bioactive Lipid Species in Octopus cyanea and Loligo sp. By-products from Southwestern Madagascar. Waste Biomass Valorization 2018, 9, 1787–1793.
- Wang, C.-H.; Doan, C.T.; Nguyen, V.B.; Nguyen, A.D.; Wang, S.-L. Reclamation of Fishery Processing Waste: A Mini-Review. Molecules 2019, 24, 2234.
- Durazzo, A.; Di Lena, G.; Gabrielli, P.; Santini, A.; Lombardi-Boccia, G.; Lucarini, M. Nutrients and Bioactive Compounds in Seafood: Quantitative Literature Research Analysis. Fishes 2022, 7, 132.
- Durmus, M. Fish oil for human health: Omega-3 fatty acid profiles of marine seafood species. Food Sci. Technol. 2019, 39, 1–12.
- Rincón-Cervera, M.Á.; González-Barriga, V.; Romero, J.; Rojas, R.; López-Arana, S. Quantification and Distribution of Omega-3 Fatty Acids in South Pacific Fish and Shellfish Species. Foods 2020, 9, 233.
- Oliver, L.; Dietrich, T.; Marañón, I.; Villarán, M.C.; Barrio, R.J. Producing Omega-3 Polyunsaturated Fatty Acids: A Review of Sustainable Sources and Future Trends for the EPA and DHA Market. Resources 2020, 9, 148.
- Olgunoglu, İ. Review on Omega-3 (n-3) Fatty Acids in Fish and Seafood. J. Biol. Agric. Healthc. 2017, 7, 37–45.
- Irkin, L.C. The Effects of Shellfish Consumption Frequency for Human Health. In Update on Malacology; Sajal, R., Soumalya, M., Eds.; IntechOpen: Rijeka, Croatia, 2021; p. Ch. 1.
- Carboni, S.; Kaur, G.; Pryce, A.; McKee, K.; Desbois, A.P.; Dick, J.R.; Galloway, S.D.R.; Hamilton, D.L. Mussel Consumption as a “Food First” Approach to Improve Omega-3 Status. Nutrients 2019, 11, 1381.
- Shahidi, F.; Ambigaipalan, P. Omega-3 Polyunsaturated Fatty Acids and Their Health Benefits. Annu. Rev. Food Sci. Technol. 2018, 9, 345–381.
- Li, J.; Pora, B.L.R.; Dong, K.; Hasjim, J. Health benefits of docosahexaenoic acid and its bioavailability: A review. Food Sci. Nutr. 2021, 9, 5229–5243.
- Dempsey, M.; Rockwell, M.S.; Wentz, L.M. The influence of dietary and supplemental omega-3 fatty acids on the omega-3 index: A scoping review. Front. Nutr. 2023, 10, 1072653.
- Shahidi, F.; Zhong, Y. Lipid oxidation and improving the oxidative stability. Chem. Soc. Rev. 2010, 39, 4067–4079.
- Lordan, R.; Tsoupras, A.; Zabetakis, I. Phospholipids of Animal and Marine Origin: Structure, Function, and Anti-Inflammatory Properties. Molecules 2017, 22, 1964.
- Tran, Q.T.; Le, T.T.T.; Pham, M.Q.; Do, T.L.; Vu, M.H.; Nguyen, D.C.; Bach, L.G.; Bui, L.M.; Pham, Q.L. Fatty Acid, Lipid Classes and Phospholipid Molecular Species Composition of the Marine Clam Meretrix lyrata (Sowerby 1851) from Cua Lo Beach, Nghe An Province, Vietnam. Molecules 2019, 24, 895.
- Kizmaz, V. Analysis of lipid classes and the fatty acid composition of fresh and the salted fish, Alburnus tarichi. Cogent Food Agric. 2022, 8, 2126052.
- Sushchik, N.N.; Makhutova, O.N.; Rudchenko, A.E.; Glushchenko, L.A.; Shulepina, S.P.; Kolmakova, A.A.; Gladyshev, M.I. Comparison of Fatty Acid Contents in Major Lipid Classes of Seven Salmonid Species from Siberian Arctic Lakes. Biomolecules 2020, 10, 419.
- Biandolino, F.; Prato, E. A preliminary investigation of the lipids and fatty acids composition of Gammarus aequicauda (Crustacea: Amphipoda) and its main food source. J. Mar. Biol. Assoc. UK 2006, 86, 345–348.
- Laudicella, V.A.; Beveridge, C.; Carboni, S.; Franco, S.C.; Doherty, M.K.; Long, N.; Mitchell, E.; Stanley, M.S.; Whitfield, P.D.; Hughes, A.D. Lipidomics analysis of juveniles’ blue mussels (Mytilus edulis L. 1758), a key economic and ecological species. PLoS ONE 2020, 15, e0223031.
- Medina, I.; Aubourg, S.P.; Martín, R.P. Composition of phospholipids of white muscle of six tuna species. Lipids 1995, 30, 1127–1135.
- Al Khawli, F.; Pateiro, M.; Domínguez, R.; Lorenzo, J.M.; Gullón, P.; Kousoulaki, K.; Ferrer, E.; Berrada, H.; Barba, F.J. Innovative Green Technologies of Intensification for Valorization of Seafood and Their By-Products. Mar. Drugs 2019, 17, 689.
- Pateiro, M.; Munekata, P.E.S.; Domínguez, R.; Wang, M.; Barba, F.J.; Bermúdez, R.; Lorenzo, J.M. Nutritional Profiling and the Value of Processing By-Products from Gilthead Sea Bream (Sparus aurata). Mar. Drugs 2020, 18, 101.
- Kundam, D.; Acham, I.O.; Girgih, A. Bioactive Compounds in Fish and Their Health Benefits. Asian Food Sci. J. 2018, 4, 1–14.
- Malcorps, W.; Newton, R.W.; Sprague, M.; Glencross, B.D.; Little, D.C. Nutritional Characterisation of European Aquaculture Processing By-Products to Facilitate Strategic Utilisation. Front. Sustain. Food Syst. 2021, 5, 720595.
- Kandyliari, A.; Mallouchos, A.; Papandroulakis, N.; Golla, J.P.; Lam, T.T.; Sakellari, A.; Karavoltsos, S.; Vasiliou, V.; Kapsokefalou, M. Nutrient Composition and Fatty Acid and Protein Profiles of Selected Fish By-Products. Foods 2020, 9, 190.
- Messina, C.M.; Renda, G.; La Barbera, L.; Santulli, A. By-products of farmed European sea bass (Dicentrarchus labrax L.) as a potential source of n-3 PUFA. Biologia 2013, 68, 288–293.
- Messina, C.M.; Arena, R.; Manuguerra, S.; La Barbera, L.; Curcuraci, E.; Renda, G.; Santulli, A. Valorization of Side Stream Products from Sea Cage Fattened Bluefin Tuna (Thunnus thynnus): Production and In Vitro Bioactivity Evaluation of Enriched ω-3 Polyunsaturated Fatty Acids. Mar. Drugs 2022, 20, 309.
- Kacem, M.; Sellami, M.; Kammoun, W.; Frikha, F.; Miled, N.; Ben Rebah, F. Seasonal Variations in Proximate and Fatty Acid Composition of Viscera of Sardinella aurita, Sarpa salpa, and Sepia officinalis from Tunisia. J. Aquat. Food Prod. Technol. 2011, 20, 233–246.
- Ovissipour, R.; Abedian Kenari, A.; Motamedzadegan, A.; Nazari, R. Optimization of Enzymatic Hydrolysis of Visceral Waste Proteins of Yellowfin Tuna (Thunnus albacares). Food Bioprocess Technol. 2010, 5, 696–705.
- Aidos, I.; Lourenclo, S.; van der Padt, A.; Luten, J.B.; Boom, R. Stability of Crude Herring Oil Produced from Fresh Byproducts: Influence of Temperature during Storage. J. Food Sci. 2002, 67, 3314–3320.
- Khoddami, A. Quality and fatty acid profile of the oil extracted from fish waste (head, intestine and liver) (Euthynnus affinis). Afr. J. Biotechnol. 2012, 11, 1683–1689.
- Khoddami, A.; Ariffin, A.; Bakar, J.; Mohd Ghazali, H. Fatty acid profile of the oil extracted from fish waste (head, intestine and liver) (Sardinella lemuru). World Appl. Sci. J. 2009, 7, 127–131.
- Shahidi, F.; Naczk, M.; Pegg, R.B.; Synowiecki, J. Chemical composition and nutritional value of processing discards of cod (Gadus morhua). Food Chem. 1991, 42, 145–151.
- Ahmmed, M.K.; Carne, A.; Ahmmed, F.; Stewart, I.; Sabrina Tian, H.; Bekhit, A.E.A. Positional distribution of fatty acids and phospholipid composition in King salmon (Oncorhynchus tshawytscha) head, roe and skin using nuclear magnetic resonance spectroscopy. Food Chem. 2021, 363, 130302.
- Ahmmed, M.K.; Ahmmed, F.; Stewart, I.; Carne, A.; Tian, H.S.; Bekhit, A.E.A. Omega-3 phospholipids in Pacific blue mackerel (Scomber australasicus) processing by-products. Food Chem. 2021, 353, 129451.
- Guiry, E.J.; Szpak, P.; Richards, M.P. Effects of lipid extraction and ultrafiltration on stable carbon and nitrogen isotopic compositions of fish bone collagen. Rapid Commun. Mass Spectrom. 2016, 30, 1591–1600.
- Rosidi, W.N.T.M.; Arshad, N.M.; Mohtar, N.F. Characterization of Sardinella fimbriata and Clarias gariepinus bones. Biodivers. J. Biol. Divers. 2021, 22, 1621–1626.
- During, A.; Penel, G.; Hardouin, P. Understanding the local actions of lipids in bone physiology. Prog. Lipid Res. 2015, 59, 126–146.
- Mularchuk, P.; Boskey, A. Lipids in bone: Optimal conditions for tissue storage prior to lipid analyses. Calcif. Tissue Int. 1990, 46, 57–59.
- Aitta, E.; Marsol-Vall, A.; Damerau, A.; Yang, B. Enzyme-Assisted Extraction of Fish Oil from Whole Fish and by-Products of Baltic Herring (Clupea harengus membras). Foods 2021, 10, 1811.
- Lee, S.; Koo, M.H.; Han, D.W.; Kim, I.C.; Lee, J.H.; Kim, J.H.; Sultana, R.; Kim, S.Y.; Youn, U.J.; Kim, J.H. Comparison of Fatty Acid Contents and MMP-1 Inhibitory Effects of the Two Antarctic Fish, Notothenia rossii and Champsocephalus gunnari. Molecules 2022, 27, 4554.
- Li, W.; Liu, Y.; Jiang, W.; Yan, X. Proximate Composition and Nutritional Profile of Rainbow Trout (Oncorhynchus mykiss) Heads and Skipjack tuna (Katsuwonus pelamis) Heads. Molecules 2019, 24, 3189.
- Hu, Z.; Chin, Y.; Liu, J.; Zhou, J.; Li, G.; Hu, L.; Hu, Y. Optimization of fish oil extraction from Lophius litulon liver and fatty acid composition analysis. Fish. Aquat. Sci. 2022, 25, 76–89.
- Gbogouri, G.; Linder, M.; Fanni, J.; Parmentier, M. Analysis of lipids extracted from salmon (Salmo salar) heads by commercial proteolytic enzymes. Eur. J. Lipid Sci. Technol. 2006, 108, 766–775.
- Abiona, O.O.; Awojide, S.H.; Anifowose, A.J.; Adegunwa, A.O.; Agbaje, W.B.; Tayo, A.S. Quality characteristics of extracted oil from the head and gills of Catfish and Titus fish. Bull. Natl. Res. Cent. 2021, 45, 101.
- Wang, Q.; Wang, R.; Zhao, X.; Lu, H.; Zhang, P.; Dong, X.; Wang, Y. Comparison of the Effect of Phospholipid Extracts from Salmon and Silver Carp Heads on High-Fat-Diet-Induced Metabolic Syndrome in C57BL/6J Mice. Mar. Drugs 2023, 21, 409.
- Sánchez-Camargo, A.P.; Meireles, M.Â.A.; Lopes, B.L.F.; Cabral, F.A. Proximate composition and extraction of carotenoids and lipids from Brazilian redspotted shrimp waste (Farfantepenaeus paulensis). J. Food Eng. 2011, 102, 87–93.
- Ahmadkelayeh, S.; Hawboldt, K. Extraction of lipids and astaxanthin from crustacean by-products: A review on supercritical CO2 extraction. Trends Food Sci. Technol. 2020, 103, 94–108.
- Limam, Z.; Arafa, S.; Sadok, S.; El Abed, A. Lipids and fatty acids composition in the tissues and by-products of two Tunisian shrimp species from the north and south regions. Nutr. Health 2008, 19, 215–220.
- Toyes-Vargas, E.; Robles-Romo, A.; Méndez, L.; Palacios, E.; Civera, R. Changes in fatty acids, sterols, pigments, lipid classes, and heavy metals of cooked or dried meals, compared to fresh marine by-products. Anim. Feed Sci. Technol. 2016, 221, 195–205.
- Takeungwongtrakul, S.; Benjakul, S.; Santoso, J.; Trilaksani, W.; Nurilmala, M. Extraction and Stability of Carotenoid-Containing Lipids from Hepatopancreas of Pacific White Shrimp (Litopenaeus vannamei). J. Food Process. Preserv. 2015, 39, 10–18.
- Senphan, T.; Benjakul, S. Compositions and yield of lipids extracted from hepatopancreas of Pacific white shrimp (Litopenaeus vannamei) as affected by prior autolysis. Food Chem. 2012, 134, 829–835.
- Trung, T.S.; Phuong, P.T.D. Bioactive Compounds from By-Products of Shrimp Processing Industry in Vietnam. J. Food Drug Anal. 2012, 20, 194–197.
- O’Leary, C.D.; Matthews, A.D. Lipid class distribution and fatty acid composition of wild and farmed prawn, Penaeus monodon (Fabricius). Aquaculture 1990, 89, 65–81.
- Miniadis-Meimaroglou, S.; Kora, L.; Sinanoglou, V.J. Isolation and identification of phospholipid molecular species in α wild marine shrimp Penaeus kerathurus muscle and cephalothorax. Chem. Phys. Lipids 2008, 152, 104–112.
- Ravichandran, S.; Rameshkumar, G.; Prince, A.R. Biochemical composition of shell and flesh of the Indian white shrimp Penaeus indicus (H. milne Edwards 1837). Am.-Eurasian J. Sci. Res. 2009, 4, 191–194.
- Tsvetnenko, E.; Kailis, S.; Evans, L.; Longmore, R. Fatty acid composition of lipids from the contents of rock lobster (Panulirus cygnus) cephalothorax. J. Am. Oil Chem. Soc. 1996, 73, 259–261.
- Nguyen, T.T.; Zhang, W.; Barber, A.R.; Su, P.; He, S. Significant Enrichment of Polyunsaturated Fatty Acids (PUFAs) in the Lipids Extracted by Supercritical CO2 from the Livers of Australian Rock Lobsters (Jasus edwardsii). J. Agric. Food Chem. 2015, 63, 4621–4628.
- Beaulieu, L.; Thibodeau, J.; Bryl, P.; Carbonneau, M.-É. Characterization of enzymatic hydrolyzed snow crab (Chionoecetes opilio) by-product fractions: A source of high-valued biomolecules. Bioresour. Technol. 2009, 100, 3332–3342.
- Lv, S.; Xie, S.; Liang, Y.; Xu, L.; Hu, L.; Li, H.; Mo, H. Comprehensive lipidomic analysis of the lipids extracted from freshwater fish bones and crustacean shells. Food Sci. Nutr. 2022, 10, 723–730.
- Muriana, F.J.; Ruiz-Gutierrez, V.; Gallardo-Guerrero, M.L.; Mínguez-Mosquera, M.I. A study of the lipids and carotenoprotein in the prawn, Penaeus japonicus. J. Biochem. 1993, 114, 223–229.
- Shen, Q.; Song, G.; Wang, H.; Zhang, Y.; Cui, Y.; Xie, H.; Xue, J.; Wang, H. Isolation and lipidomics characterization of fatty acids and phospholipids in shrimp waste through GC/FID and HILIC-QTrap/MS. J. Food Compos. Anal. 2021, 95, 103668.
- Sinthusamran, S.; Benjakul, S.; Kijroongrojana, K.; Prodpran, T.; Agustini, T.W. Yield and chemical composition of lipids extracted from solid residues of protein hydrolysis of Pacific white shrimp cephalothorax using ultrasound-assisted extraction. Food Biosci. 2018, 26, 169–176.
- Gulzar, S.; Benjakul, S. Ultrasound Waves Increase the Yield and Carotenoid Content of Lipid Extracted from Cephalothorax of Pacific White Shrimp (Litopenaeus vannamei). Eur. J. Lipid Sci. Technol. 2018, 120, 1700495.
- Zhang, M.; Li, P.; Wang, F.; Zhang, S.; Li, H.; Zhang, Y.; Wang, X.; Liu, K.; Li, X. Separation, identification and cardiovascular activities of phospholipid classes from the head of Penaeus vannamei by lipidomics and zebrafish models. Food Funct. 2021, 12, 2282–2291.
- Sriket, P.; Benjakul, S.; Visessanguan, W.; Kijroongrojana, K. Comparative studies on chemical composition and thermal properties of black tiger shrimp (Penaeus monodon) and white shrimp (Penaeus vannamei) meats. Food Chem. 2007, 103, 1199–1207.
- Guary, J.-C. Lipid class distribution and fatty acid composition of prawn, Penaus japonicus bate. Bull. Jpn. Soc. Sci. Fish. 1974, 40, 1027–1032.
- Sowmya, R.; Sachindra, N.M. Evaluation of antioxidant activity of carotenoid extract from shrimp processing byproducts by in vitro assays and in membrane model system. Food Chem. 2012, 134, 308–314.
- Sachindra, N.M.; Bhaskar, N.; Siddegowda, G.S.; Sathisha, A.D.; Suresh, P.V. Recovery of carotenoids from ensilaged shrimp waste. Bioresour. Technol. 2007, 98, 1642–1646.
- Li, J.; Sun, W.; Ramaswamy, H.S.; Yu, Y.; Zhu, S.; Wang, J.; Li, H. High Pressure Extraction of Astaxanthin from Shrimp Waste (Penaeus vannamei Boone): Effect on Yield and Antioxidant Activity. J. Food Process Eng. 2017, 40, e12353.
- Shahidi, F.; Synowiecki, J. Isolation and characterization of nutrients and value-added products from snow crab (Chionoecetes opilio) and shrimp (Pandalus borealis) processing discards. J. Agric. Food Chem. 1991, 39, 1527–1532.
- Sachindra, N.M.; Bhaskar, N.; Mahendrakar, N.S. Carotenoids in crabs from marine and fresh waters of India. LWT-Food Sci. Technol. 2005, 38, 221–225.
- Sánchez-Camargo, A.; Martinez-Correa, H.; Paviani, L.; Cabral, F. Supercritical CO2 extraction of lipids and astaxanthin from Brazilian redspotted shrimp waste (Farfantepenaeus paulensis). J. Supercrit. Fluids 2011, 56, 164–173.
- Sachindra, N.M.; Bhaskar, N.; Mahendrakar, N.S. Recovery of carotenoids from shrimp waste in organic solvents. Waste Manag. 2006, 26, 1092–1098.
- Holanda, H.; Netto, F. Recovery of Components from Shrimp (Xiphopenaeus kroyeri) Processing Waste by Enzymatic Hydrolysis. J. Food Sci. 2006, 71, C298–C303.
- Higuera-Ciapara, I.; Félix-Valenzuela, L.; Goycoolea, F.M. Astaxanthin: A review of its chemistry and applications. Crit. Rev. Food Sci. Nutr. 2006, 46, 185–196.
- Montoya, J.; Mata, S.; Acosta, J.; Cabrera, B.; López-Valdez, L.; Reyes, C.; Barrales-Cureño, H. Obtaining of Astaxanthin from Crab Exosqueletons and Shrimp Head Shells. Biointerface Res. Appl. Chem. 2021, 11, 13516–13523.
- López-Cervantes, J.; Sánchez-Machado, D.I.; Ríos-Vázquez, N.J. High-performance liquid chromatography method for the simultaneous quantification of retinol, α-tocopherol, and cholesterol in shrimp waste hydrolysate. J. Chromatogr. A 2006, 1105, 135–139.
- Subra-Paternault, P.; ThongDeng, H.; Grélard, A.; Cansell, M. Extraction of phospholipids from scallop by-product using supercritical CO2/alcohol mixtures. LWT-Food Sci. Technol. 2015, 60, 990–998.
- Savoire, R.; Subra-Paternault, P.; Bardeau, T.; Morvan, E.; Grélard, A.; Cansell, M. Selective extraction of phospholipids from food by-products by supercritical carbon dioxide and ethanol and formulating ability of extracts. Sep. Purif. Technol. 2020, 238, 116394.
- Aubourg, S.P.; Trigo, M.; Prego, R.; Cobelo-García, A.; Medina, I. Nutritional and Healthy Value of Chemical Constituents Obtained from Patagonian Squid (Doryteuthis gahi) By-Products Captured at Different Seasons. Foods 2021, 10, 2144.
- Rodríguez, A.; Trigo, M.; Aubourg, S.P.; Medina, I. Optimisation of Healthy-Lipid Content and Oxidative Stability during Oil Extraction from Squid (Illex argentinus) Viscera by Green Processing. Mar. Drugs 2021, 19, 616.
- Aubourg, S.P.; Trigo, M.; González, M.J.; Lois, S.; Medina, I. Comparative Study of Bioactive Lipid Extraction from Squid (Doryteuthis gahi) by-Products by Green Solvents. Foods 2022, 11, 2188.
- Aubourg, S.P.; Rodríguez, A.; Trigo, M.; Medina, I. Yield Enhancement of Valuable Lipid Compounds from Squid (Doryteuthis gahi) Waste by Ethanol/Acetone Extraction. Foods 2023, 12, 2649.
- Uddin, M.S.; Kishimura, H.; Chun, B.S. Isolation and characterization of lecithin from squid (Todarodes pacificus) viscera deoiled by supercritical carbon dioxide extraction. J. Food Sci. 2011, 76, C350–C354.
- Hayashi, K. Composition and distribution of lipids in different tissues of the arrow squid Loligo bleekeri. Fish. Sci. 1996, 62, 84–87.
- Hayashi, K.; Kishimura, H. Amount and Composition of Diacyl Glyceryl Ethers in Various Tissue Lipids of the Deep-sea Squid Berryteuthis magister. J. Oleo Sci. 2002, 51, 523–529.
- Saito, H.; Sakai, M.; Wakabayashi, T. Characteristics of the lipid and fatty acid compositions of the Humboldt squid, Dosidicus gigas: The trophic relationship between the squid and its prey. Eur. J. Lipid Sci. Technol. 2014, 116, 360–366.
- Ghazani, S.M.; Marangoni, A.G. Microbial lipids for foods. Trends Food Sci. Technol. 2022, 119, 593–607.
- Shahidi, F.; Pinaffi-Langley, A.C.C.; Fuentes, J.; Speisky, H.; de Camargo, A.C. Vitamin E as an essential micronutrient for human health: Common, novel, and unexplored dietary sources. Free Radic. Biol. Med. 2021, 176, 312–321.
- Gimenez, M.S.; Oliveros, L.B.; Gomez, N.N. Nutritional deficiencies and phospholipid metabolism. Int. J. Mol. Sci. 2011, 12, 2408–2433.
- Jeppesen, P.; Christensen, M.; Høy, C.; Brøbech, P. Essential fatty acid deficiency in patients with severe fat malabsoption. Am. J. Clin. Nutr. 1997, 65, 837–843.
- Kuller, L.H. Dietary fat and chronic diseases: Epidemiologic overview. J. Am. Diet. Assoc. 1997, 97, S9–S15.
- Graham, D.S.; Liu, G.; Arasteh, A.; Yin, X.M.; Yan, S. Ability of high fat diet to induce liver pathology correlates with the level of linoleic acid and Vitamin E in the diet. PLoS ONE 2023, 18, e0286726.
- Xu, Q.; Tang, Q.; Xu, Y.; Wu, J.; Mao, X.; Li, F.; Wang, S.; Wang, Y. Biotechnology in Future Food Lipids: Opportunities and Challenges. Annu. Rev. Food Sci. Technol. 2023, 14, 225–246.
- Azam, K.; Basher, M.; Asaduzzaman, M.; Hossain, M.; Ali, M. Biochemical assessment of fourteen selected dried fish. Univ. J. Zool. Rajshahi Univ. 2003, 22, 23–26.
- Pongsetkul, J.; Benjakul, S.; Vongkamjan, K.; Sumpavapol, P.; Osako, K. Changes in lipids of shrimp (Acetes vulgaris) during salting and fermentation. Eur. J. Lipid Sci. Technol. 2017, 119, 1700253.
- Kommuri, P.K.; Mugada, N.; Kondamudi, R.B. Proximate Analysis and Mineral Composition of Commercially Important Spiny Lobsters from Visakhapatnam Coast, Andhra Pradesh, India. Asian J. Fish. Aquat. Res. 2021, 14, 39–47.
- Rosa, R.; Pereira, J.; Nunes, M. Biochemical composition of cephalopods with different life strategies, with special reference to a giant squid, Architeuthis sp. Mar. Biol. 2005, 146, 739–751.
- Ahmad, T.B.; Rudd, D.; Kotiw, M.; Liu, L.; Benkendorff, K. Correlation between Fatty Acid Profile and Anti-Inflammatory Activity in Common Australian Seafood by-Products. Mar. Drugs 2019, 17, 155.
- Tocher, D.R.; Betancor, M.B.; Sprague, M.; Olsen, R.E.; Napier, J.A. Omega-3 Long-Chain Polyunsaturated Fatty Acids, EPA and DHA: Bridging the Gap between Supply and Demand. Nutrients 2019, 11, 89.
- Takahashi, K.; Inoue, Y. Marine by-product phospholipids as booster of medicinal compounds. Adv. Food Nutr. Res. 2012, 65, 31–46.
- Burri, L.; Hoem, N.; Banni, S.; Berge, K. Marine omega-3 phospholipids: Metabolism and biological activities. Int. J. Mol. Sci. 2012, 13, 15401–15419.
- Nollet, L.M.; Toldrá, F. Handbook of Seafood and Seafood Products Analysis; CRC Press: Boca Raton, FL, USA, 2009.
- von Schacky, C. Omega-3 index in 2018/19. Proc. Nutr. Soc. 2020, 79, 381–387.
- Arterburn, L.M.; Hall, E.B.; Oken, H. Distribution, interconversion, and dose response of n-3 fatty acids in humans. Am. J. Clin. Nutr. 2006, 83 (Suppl. 6), 1467s–1476s.
- Baker, E.J.; Miles, E.A.; Burdge, G.C.; Yaqoob, P.; Calder, P.C. Metabolism and functional effects of plant-derived omega-3 fatty acids in humans. Prog. Lipid Res. 2016, 64, 30–56.
- Kuipers, R.S.; Luxwolda, M.F.; Janneke Dijck-Brouwer, D.A.; Eaton, S.B.; Crawford, M.A.; Cordain, L.; Muskiet, F.A.J. Estimated macronutrient and fatty acid intakes from an East African Paleolithic diet. Br. J. Nutr. 2010, 104, 1666–1687.
- Simopoulos, A.P.; DiNicolantonio, J.J. The importance of a balanced ω-6 to ω-3 ratio in the prevention and management of obesity. Open Heart 2016, 3, e000385.
- Harris, W.S.; Mozaffarian, D.; Lefevre, M.; Toner, C.D.; Colombo, J.; Cunnane, S.C.; Holden, J.M.; Klurfeld, D.M.; Morris, M.C.; Whelan, J. Towards establishing dietary reference intakes for eicosapentaenoic and docosahexaenoic acids. J. Nutr. 2009, 139, 804s–819s.
- Kris-Etherton, P.M.; Grieger, J.A.; Etherton, T.D. Dietary reference intakes for DHA and EPA. Prostaglandins Leukot. Essent. Fat. Acids 2009, 81, 99–104.
- Siscovick, D.S.; Barringer, T.A.; Fretts, A.M.; Wu, J.H.Y.; Lichtenstein, A.H.; Costello, R.B.; Kris-Etherton, P.M.; Jacobson, T.A.; Engler, M.B.; Alger, H.M.; et al. Omega-3 Polyunsaturated Fatty Acid (Fish Oil) Supplementation and the Prevention of Clinical Cardiovascular Disease. Circulation 2017, 135, e867–e884.
- Lenighan, Y.M.; McNulty, B.A.; Roche, H.M. Dietary fat composition: Replacement of saturated fatty acids with PUFA as a public health strategy, with an emphasis on α-linolenic acid. Proc. Nutr. Soc. 2019, 78, 234–245.
- Weylandt, K.H.; Serini, S.; Chen, Y.Q.; Su, H.-M.; Lim, K.; Cittadini, A.; Calviello, G. Omega-3 Polyunsaturated Fatty Acids: The Way Forward in Times of Mixed Evidence. BioMed Res. Int. 2015, 2015, 143109.
- Saini, R.K.; Prasad, P.; Sreedhar, R.V.; Akhilender Naidu, K.; Shang, X.; Keum, Y.-S. Omega-3 Polyunsaturated Fatty Acids (PUFAs): Emerging Plant and Microbial Sources, Oxidative Stability, Bioavailability, and Health Benefits—A Review. Antioxidants 2021, 10, 1627.
- Swanson, D.; Block, R.; Mousa, S.A. Omega-3 fatty acids EPA and DHA: Health benefits throughout life. Adv. Nutr. 2012, 3, 1–7.
- Bae, J.H.; Lim, H.; Lim, S. The Potential Cardiometabolic Effects of Long-Chain ω-3 Polyunsaturated Fatty Acids: Recent Updates and Controversies. Adv. Nutr. 2023, 14, 612–628.
- Djuricic, I.; Calder, P.C. Beneficial Outcomes of Omega-6 and Omega-3 Polyunsaturated Fatty Acids on Human Health: An Update for 2021. Nutrients 2021, 13, 2421.
- DiNicolantonio, J.J.; O’Keefe, J.H. The Importance of Marine Omega-3s for Brain Development and the Prevention and Treatment of Behavior, Mood, and Other Brain Disorders. Nutrients 2020, 12, 2333.
- Liao, J.; Xiong, Q.; Yin, Y.; Ling, Z.; Chen, S. The Effects of Fish Oil on Cardiovascular Diseases: Systematical Evaluation and Recent Advance. Front. Cardiovasc. Med. 2022, 8, 802306.
- Mone, P.; Varzideh, F.; Kansakar, U.; Infante, C.; Lombardi, A.; de Donato, A.; Frullone, S.; Santulli, G. Omega-3 fatty acids coordinate glucose and lipid metabolism in diabetic patients. Lipids Health Dis. 2022, 21, 31.
- Abdelhamid, A.S.; Brown, T.J.; Brainard, J.S.; Biswas, P.; Thorpe, G.C.; Moore, H.J.; Deane, K.H.; Summerbell, C.D.; Worthington, H.V.; Song, F.; et al. Omega-3 fatty acids for the primary and secondary prevention of cardiovascular disease. Cochrane Database Syst. Rev. 2018, 3, Cd003177.
- Sherratt, S.C.R.; Libby, P.; Budoff, M.J.; Bhatt, D.L.; Mason, R.P. Role of Omega-3 Fatty Acids in Cardiovascular Disease: The Debate Continues. Curr. Atheroscler. Rep. 2023, 25, 1–17.
- Jo, S.-H.; Han, S.H.; Kim, S.-H.; Eckel, R.H.; Koh, K.K. Cardiovascular effects of omega-3 fatty acids: Hope or hype? Atherosclerosis 2021, 322, 15–23.
- Toth, P.P.; Chapman, M.J.; Parhofer, K.G.; Nelson, J.R. Differentiating EPA from EPA/DHA in cardiovascular risk reduction. Am. Heart J. Plus Cardiol. Res. Pract. 2022, 17, 100148.
- Liput, K.P.; Lepczyński, A.; Ogłuszka, M.; Nawrocka, A.; Poławska, E.; Grzesiak, A.; Ślaska, B.; Pareek, C.S.; Czarnik, U.; Pierzchała, M. Effects of Dietary n-3 and n-6 Polyunsaturated Fatty Acids in Inflammation and Cancerogenesis. Int. J. Mol. Sci. 2021, 22, 6965.
- Mukhametov, A.; Yerbulekova, M.; Aitkhozhayeva, G.; Tuyakova, G.; Dautkanova, D. Effects of ω-3 fatty acids and ratio of ω-3/ω-6 for health promotion and disease prevention. Food Sci. Technol. 2022, 42, e58321.
- Sahena, F.; Zaidul, I.S.M.; Jinap, S.; Saari, N.; Jahurul, H.A.; Abbas, K.A.; Norulaini, N.A. PUFAs in Fish: Extraction, Fractionation, Importance in Health. Compr. Rev. Food Sci. Food Saf. 2009, 8, 59–74.
- Simopoulos, A.P. The importance of the ratio of omega-6/omega-3 essential fatty acids. Biomed. Pharmacother. 2002, 56, 365–379.
This entry is offline, you can click here to edit this entry!