Your browser does not fully support modern features. Please upgrade for a smoother experience.
Please note this is an old version of this entry, which may differ significantly from the current revision.
Subjects:
Environmental Sciences
Human population growth has resulted in increased food consumption, followed by agrifood production intensification. Human activities have a significant impact on the environment, causing, among other things, air and water pollution and biodiversity degradation. In an international context where there is strong concern about environmental issues, it is also necessary to direct food production towards more sustainable models.
- greenhouse gases
- climate change
- carbon footprint
- water footprint
- biodiversity
- life-cycle assessment
- environmental product declaration
1. Climate Change
One of the hottest problems of humanity is the struggle against climate change. The major emitters of GHG are the sectors of energy and transportation via the use of fossil fuels. However, it has been determined that the food industry is yet another important factor in climate change related to human activities [22]. Global warming (GW) is an estimation of the greenhouse gases released over the life of a product/process under investigation, and as a result, an estimation of the product’s or service’s contribution to climate change [23]. The recently observed rise in the planet’s average surface temperature, which is ascribed to an increase in human activity, is referred to as global warming [24], in particular, the atmosphere’s higher concentration in greenhouse gases carbon dioxide, nitrous oxide, and methane [24,25]. The increase in GHG levels is astronomically high and far beyond the range that is considered normal. The majority (76%) of these GHGs are produced when fossil fuels are burned, primarily CO2, followed by CH4 and N2O, which, respectively, contribute 16% and 6% of the total collective CO2-e based on global emissions from 2010. Agriculture is the primary source of these two gases [26]. The temperature of the Earth is influenced by a variety of elements, not just greenhouse gases. Volcanoes and variations in solar radiation are two examples of external but natural phenomena that affect world temperatures. Additionally, there are a variety of natural, intrinsic fluctuations in the Earth’s climate system [27].
According to [28], the contribution of food-production systems to anthropogenic emissions is significant and accounts for 19–29% of all greenhouse-gas emissions [29]. Agricultural production is responsible for between 80% and 86% of these emissions, with the remainder coming from preproduction (mostly fertilizer production) and postproduction activities, including primary and secondary processing, packing, shipping, etc. [30]. In Europe, the agrifood system accounts for about 14%, 13%, and 9% of total emissions of CO2, N2O, and CH4, respectively, between 2020 and 2021 [31]. For customers to make wise decisions, there is a lot of interest in calculating the carbon footprint (CF) of food goods, or the total amount of GHG emitted throughout the product’s life cycle [32]. Mathematical formulas are used to determine the overall global-warming potential (GWP) and express it concerning CO2. Therefore, the carbon dioxide equivalent (CO2-e) is the GWP measuring unit [33]. The calculation formula is as follows:
GWPtot (kg CO2-e) = [Amount of CO2×1] + [Amount of CH4×GWPCH4] + [Amount of N2O × GWPN2O]
2. Organic Farming
Addressing agricultural development and climate change adaptation and mitigation mainly employs three different approaches: conventional agriculture, conservation agriculture, and organic agriculture [17], which promote increased CO2 sequestration and reduced GHG emissions. Organic farming is a method of managing agricultural holdings that involves significant restrictions on the use of fertilizers and pesticides. This production method is based on various farming practices. It is concerned with environmental protection, and it seeks to promote sustainable agricultural development [34]. To maintain soil fertility and health, as well as to control insects, weeds, and other pests, organic farming relies on different agricultural techniques (soil cultivation, mineral-bearing rocks, crop rotation, the use of resistant varieties, etc.) and inputs (crop residues, animal manures, legumes, green manures, and off-farming organic wastes). The market within Europe for organic produce is growing rapidly in many countries. Organic farming is popular in Europe, with France having the largest agricultural area in this system, followed by Spain, while Italy and Germany also are key players (Figure 2).
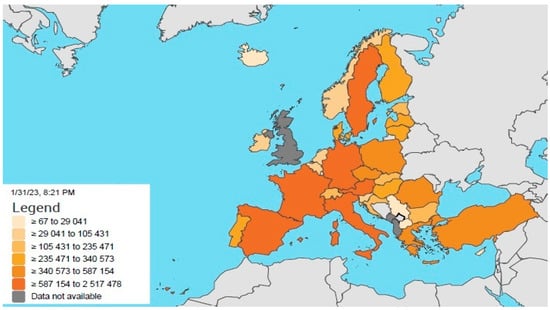
Figure 2. Acreage of organic agriculture in Europe in 2020. The map depicts farms in the conversion stage as well as fully organic [35] © European Union, 1995–2024.
Over the period 2012–2020, the proportion of EU agricultural land dedicated to organic farming increased by more than 50%, with a mean annual increase of 5.7%. Organic farming covered 9.1% of the EU agricultural land area in 2020. Permanent grassland received the greatest share of organic farming land in the EU (42%). The second dominant activity is green fodder (17%), followed by cereals (16%), while permanent crops (vineyards, fruit trees, and olives) represent 11% [36]. Organically produced food must meet predefined standards to be communicated and commercialized as ‘organic’ in the European Union. The regulatory framework for the production, processing, labeling, and control of organic products is established by European Council (EC) Regulation No 834/2007 [37]. Product labeling with organic certification logos is used to inform consumers at the point of sale that a product is certified organic. The organic label is essential in the handling and definition of organic food. Organic certification systems in Europe are implemented based on The European Standard ISO/IEC 17065 [38,39,40]. The United States Department of Agriculture (USDA) describes the five steps of organic certification starting with registration and ending with certification (Figure 3).
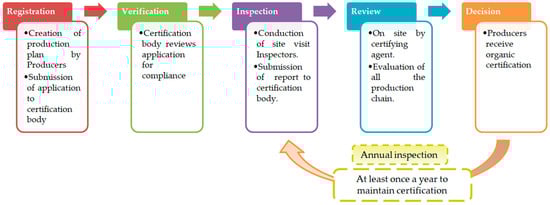
Figure 3. Organic certification process, redrawn based on [41].
There is a transitional stage from conventional farming to organic that is named “conversion”. Organic production methods must be used during this time, but the finished product cannot be labeled as organic. This conversion period varies depending on the type of organic product produced. The conversion period is the time between the start of organic management and crop or animal-husbandry certification. It is the time required to neutralize any chemical residues left in the soil by conventional agricultural techniques previously used. For annual crops, this period is 24 months; for perennials, it can be up to 36 months [42]. With the growing interest in organic products, there are many organic labels available today, including Organic Farmers and Growers Certification, Organic Food Federation, Agriculture Biologic (AB), Italian Association for Organic Agriculture (AIAB), Australian Certified Organic, BIO Hellas, etc.
3. Carbon Footprint
A product’s “carbon footprint” is expressed as the totality of all equivalent carbon dioxide emissions per functional unit (e.g., ton, Ha, bottle, L), whether they are produced directly, indirectly, or over the course of the life cycle of a product. The actions of people, groups, governments, companies, organizations, procedures, industries, etc. are covered by it. Services and goods are considered products. Every direct (internal, on site) as well as indirect (external, off site, downstream, and upstream) emission must be considered [87]. The carbon footprint, which is a quantifiable representation of a given activity’s GHG emissions, is useful for managing emissions and evaluating mitigation strategies. After emissions have been quantified, the major sources of emissions are identified, and zones for emissions reduction and efficiency improvement can be prioritized [88]. This offers the chance to save expenses while improving environmental efficiency.
3.1. Estimation of the Carbon Footprint
The quantity of greenhouse gases released, withdrawn, or sequestered during a product’s life cycle should be quantified and added to determine the carbon footprint. The life cycle of a product comprises each stage of production, from the sourcing of raw materials to final packing, distribution, consumption, usage, and disposal [33]. Boundaries are established following the carbon footprinting goals and techniques. To account for greenhouse gases, there are standards and recommendations. Typical resources include the following.
-
World Business Council for Sustainable Development (WBCSD) and World Resource Institute (WRI) Climate Change Protocol. There are two criteria:
- (a)
-
An Accounting and Reporting Standard for the Product Life Cycle, and
- (b)
-
Corporate Accounting and Reporting Standard: Guidelines for Value Chain (Tier III) Accounting and Reporting. It covers the quantification of GHG reductions resulting from the application of mitigation strategies in its project protocol and offers sector-specific and generic accounting tools. The majority of GHG accounting standards, including ISO 14064 parts 1 [89] and 2 [50,90], are based on it;
-
ISO 14064 (Parts 1 and 2): this is a global standard for establishing limits, calculating GHG emissions, and reducing them. It also offers a guideline for organizing efforts to reduce greenhouse-gas emissions [89];
-
British Standard Institution (BSI) Publicly Available Specifications-2050 (PAS 2050 [91]): this defines the criteria for evaluating the life-cycle greenhouse-gas emissions of products and services;
-
ISO 14025 [92]: This is a guideline for LCA implementation;
The GHG emissions can be gathered by measurements of actual field-activity data taken in real time or by using estimations via models and emission variables. The aim (voluntary, mandated, or for internal management), viability, credibility, and cost and capacity factors all play a role in selecting the best method. The most popular and favored methods are emissions factors and models. Typically, emissions factors and models that employ data on the use of fuels, energy, and other inputs that result in emissions are used to compute emissions for items, organizations, and events (especially CO2) [33]. Carbon-footprint labels detail how much carbon dioxide equivalents were emitted during the production and distribution of a product, as well as its usage and disposal [94,95]. The aim of carbon-footprint labeling is to communicate to consumers the effect of their product selections on GHG emissions and assist them in finding low-carbon substitutes [96,97].
Around the world, we have seen the application of many schemes for labeling the carbon footprint. The first such label indicating a product’s carbon footprint was adopted by the British government-established commercial enterprise Carbon Trust in 2007 [98]. The same year, Tesco, a British retailer, promised to include a carbon footprint on each of its product labels [99]. Although many products were tagged, Tesco discontinued the label in 2012 due to the laborious process and the lack of cooperation from other retailers [100]. There are three main types of carbon labeling. The greenhouse-gas emissions linked to a product throughout its life cycle are disclosed on the Carbon Trust label. Other emissions labels express a desire to cut emissions [101]. A third form identifies the product as being carbon neutral, which is typically done by reclaiming carbon credits or compensating for carbon emissions. Because “carbon neutrality” can be attained through financial transactions without necessitating a reduction in carbon emissions, this third option in particular has drawn criticism.
The carbon footprint (CF) is calculated as follows: The entire amount of GHG released by the growing of each crop, represented in units of carbon equivalents (CE), is the CF of the agricultural cultivation process. It is calculated using the relationship shown below, according to [102,103].
Carbon Footprint = Agricultural Input × Emission factor per functional unit
where “carbon footprint” refers to the quantity of GHG emissions caused by a specific agricultural input. An “agricultural input” is a specific input, such as the quantity of fertilizers and insecticides used (in tons), gasoline or fuel used (in liters), or energy used (in kWh) (kilowatt hours). The CE of each input is the “emission factor.”
When we add the individual carbon costs of all the inputs utilized, it is possible to estimate the total cost CF (CFt) of producing a crop as follows.
CFt = CFF + CFN + CFP + CFIR + CFD + CFM
where CFF, CFN, CFP, CFIR, and CFD stand for the separate carbon footprints from fertilizer, direct Nitrogen fertilizer application, pesticides, irrigation, and mechanical crop-production processes. To account for methane emissions in the case of rice, another factor called CFM is utilized [103].
Globally, inventories of greenhouse gases are being conducted, and all viable means of mitigation are being identified and assessed [33]. Organizations utilize the carbon footprint, which has been marketed, to calculate their carbon footprint and take action to cut emissions. By creating multiple online calculators, this business savvy has increased public awareness of carbon emissions and made the general public aware of how much their actions contribute to global warming. The carbon footprint should be used as a potent instrument to encourage GHG reduction in organizations, activities, and the general public, and it ought to be regarded as a sign of sustainable development [33].
3.2. Carbon-Footprint Tools and Software
Here common tools and software for carbon-footprint implementation is reported.
3.2.1. AGRECALC
This is a software tool that gives visibility to farm GHGs and aids stakeholders along the food supply chain in taking assured, economic measures toward a net-zero future. It is the industry’s top farm carbon calculator. It aids agriculture’s change to a future with lower carbon emissions by benchmarking and tracking agricultural GHG. This seeks to advance the sustainability of global agriculture by lowering carbon emissions and boosting production effectiveness [104].
3.2.2. The Cool Farm Tool
The Cool Farm Tool is considered a GHG emissions calculator at the farm level that includes livestock and agricultural systems by calculating on-farm emissions of greenhouse gases and carbon sequestration. It has been utilized all over the world and enables farmers to assess various farming systems to determine the impacts on GHG emissions. Step-by-step instructions for using the tool are provided in video demos [105].
3.2.3. The Farm Carbon Toolkit
This tool was created for farmers by farmers. They have been working to increase knowledge of GHG in agriculture for more than ten years. They run programs with farmers that encourage action on the ground and offer tools and services to monitor impacts [106].
3.2.4. The Ex Ante Carbon Balance Tool (EX-ACT)
This instrument is used at the project level to calculate the net GHG effects of AFOLU initiatives and policies. Several materials that facilitate the use of the tool are available on the website, including instructions, and it is available for download from the Food and Agriculture Organization (FAO) [107].
3.2.5. COMET-Farm
This is a system for calculating carbon and greenhouse-gas emissions on all farms and ranches. It runs several models to specify the sources of GHG emissions and carbon sequestration using data on a farm’s management methods as well as spatially specific information about soil and climate conditions based on USDA databases (supplied in the tool automatically). Its foundation is a set of techniques outlined in the text “Quantifying Greenhouse Gas Fluxes in Agriculture and Forestry: Methods for Entity-Scale Inventory” [108].
3.2.6. UBB Agro-Carbon Emissions Calculator
This is a digital tool created by the United Bulgarian Bank (UBB) for agricultural sustainability that may be accessed immediately and without any cost at all on the bank’s website. The cutting-edge program enables all farmers, both clients and noncustomers of the banking institution, to determine their farm’s carbon footprint—the greenhouse gases it produces, measured in carbon dioxide equivalents—in just a few easy steps [109].
3.2.7. OpenLCA 2.0.3
OpenLCA 2.0.3 is free software with influential and elastic ways to model life-cycle systems. It can calculate social, environmental, and economic indicators; has plugins that provide several more specific elements; has an open architecture that facilitates data import and export; and is one of the best open-source and free software to model the life cycle of products [110]. Customers have a significant impact on climate-change mitigation through their lifestyle decisions, particularly eating decisions that can lower CO2 emissions. Compared to a typical “business as usual” diet, a diet high in plants generates around half the amount of greenhouse-gas emissions [111]. However, at the moment, consumers find it challenging to select a diet that is climate-friendly since they are unsure of the relative emission levels of various foods [112,113]. A decreased carbon footprint is not indicated by other ecological labels, for example, the organic label [22].
3.3. Carbon-Footprint Certification
A product’s carbon-footprint label indicates how much carbon dioxide equivalent is released during production, distribution, use, and disposal. It is expected that a carbon-footprint label will communicate to consumers the GHG emissions caused by the products they select and assist them in finding low-carbon solutions. The usefulness of carbon-labeling programs in reducing greenhouse-gas emissions over the long term is debatable, and these programs have encountered various operational challenges [60].
3.4. Standards of Carbon Labels
The techniques and benchmarks used to measure CO2 emissions differ from nation to nation, from region to region, and even within a single nation or region. Globally, there are numerous standards and accounting techniques for carbon footprints, including:
-
Life Cycle Assessment: although country-specific carbon-labeling requirements differ, the Life Cycle Assessment forms the basis of the fundamental carbon-footprint estimate. There are three different kinds of LCA: input-output LCA (top–down approach), combined process LCA, and process LCA (bottom–up approach, the Hybrid approach). The input–output LCA (top–down method) is the strategy that is most frequently utilized among them;
-
Standard 01—Publicly Available Specification (PAS): the predominant standard is PAS 2050, which was the first GHG emissions calculation standard for goods and services around the globe [114]. Initiating a uniform evaluation guide for GHG assessment at the product level is the aim of PAS2050. In general, PAS 2050 acknowledges two categories of carbon-footprint accounting techniques. The first strategy is known as the business-to-business strategy because it covers all phases of production, from the “cradle” (raw materials) through the “point of sale” (gate). The “raw material”, “production,” and “distribution to company clients” are some of these steps. The second strategy is referred to as “business to customer” and includes the whole supply chain until the product’s life ends. As a result, we also refer to it as a “cradle to grave” strategy [115];
-
Standard 02—Greenhouse Gas Protocol (GHG Protocol): the World Business Council for Sustainable Development and the World Resources Institute first formed the GHG Protocol in 1998; the most recent version was released in 2011. The initial iteration of PAS 2050 and the ISO standards for LCA serve as the foundation for the GHG Protocol, a commercial method for labeling carbon. The GHG Protocol Product-Level Standard and the GHG Protocol Corporate Standard are two sets of standards for evaluating greenhouse gases [60].
3.5. Examples of Carbon-Footprint Labels
3.5.1. Carbon-Neutral Certification
A certification that is called carbon neutral is a seal of approval provided to companies after offsetting the carbon footprint according to Scopes 1 and 2. The first step of Verus Carbon Neutral is to calculate a company’s carbon footprint that is seeking carbon-neutral certification. It then offsets the carbon footprint by buying back carbon credits. This type of offsetting permits companies to offset the GHG they cannot avoid via energy efficiency and other reduction strategies.
3.5.2. Carbon-Neutral Product Certification
To achieve carbon neutrality, we calculate the carbon footprint and reduce it to zero by combining effective in-house measures and secondary outside emission reduction projects [116]. Companies that achieve the certification have successfully annulled their carbon footprint through the internationally recognized PAS 2060 [117] carbon-neutral standard or SCS’s new Certification Standard for Carbon-Neutral Entities, Buildings, Products, and Services. To help reach carbon neutrality, SCS provides comprehensive service options that include measuring the carbon footprints of your products and advising you on how to buy verified carbon offsets from reliable suppliers that support the goals of your business [118].
3.5.3. Carbon Reduction Label
The Carbon Reduction Label serves as a public declaration that a product’s or service’s carbon footprint has been calculated and certified, and the owner has made a promise to decrease that footprint over the next two years. The computed footprint will have undergone meticulous measurement and be similar based on the PAS-2050 standard and Footprint ExpertTM. A complete life-cycle evaluation, including production, usage, and disposal, will be done for this. After two years, the certification must be repeated to demonstrate that actual reductions have been made [119].
3.5.4. CarbonCare
CarbonCare supports and acknowledges the work done by businesses, governments, and other groups to combat climate change through the three processes of measuring, reducing, and offsetting carbon footprints, or MRO. The applying entity will be given labels of various degrees of emissions decrease and/or offset compared to a specified base year. The company that applies for this should have a carbon audit report that has been confirmed in line with the CarbonCare® Label Protocol, a carbon-footprint management plan, and a statement of a minimum 5% carbon-decrease obligation in place before making a first-time application [120].
3.5.5. CarbonFree® Certified
The Certification label CarbonFree® Product is intended to inform about product emissions and to recognize businesses reducing their carbon footprint. This specific label was developed to meet the needs of the rising market for environmentally friendly products as well as consumer requests for credible, clear, and easily reachable information at the point of acquisition. Carbonfund.org has developed a credible, meaningful, and ecologically positive way for businesses to deliver carbon-neutral goods to their clients by defining a product’s carbon footprint, decreasing that footprint where feasible, and counterweighing the residual carbon emissions associated with the product [121].
When consumers are devoted to reducing CO2-e emissions and are price insensitive, labels can be very helpful in guiding purchasing decisions and encouraging suitable and voluntary modifications. Labels that provide more information about emissions can also encourage societal acceptance of more intrusive policy tools. A growing understanding of how dietary choices affect climate change would provide a chance to advance climate policy [22]. The suggested climate-score label is a straightforward, five-level front-of-package categorical label (A–E, dark green to dark red) that additionally includes the precise amount of CO2-e emissions per kilogram of a specific item. These are color-coded for quick and simple information transfer. Another front-of-package label that allows for equal placement of sustainability labels is the Nutri-Score, which was first implemented in France in 2017 [122] but faces intense criticism because it does not take into account the beneficial ingredients of olive products, and it classifies them only based on fat content. Unpackaged items like fruits and vegetables might be marked on the shelf, which is where electronic labels are being used more and more. According to different studies, absolute CO2-e figures are too intangible for the majority of persons to comprehend [123]; as the unit of emissions is typically not recognized, most customers find it challenging to use these quantities as a reference when buying. Similar issues with estimating calories and nutrients per unit of weight have been considered in the area of nutrition labeling for some time [22].
3.6. Olive-Oil Carbon Footprint
The industry of olive oil is one of the most significant agrifood sectors in the EU. Recent years have seen significant developments in this industry’s cultivation methods, extraction technology, and, most importantly, the improvement of quality and the choice of defining traits. The scientific community has focused particularly on the ecological effects related to the production of extra virgin olive oil (EVOO), in addition to those modifications principally tied to improving the quality of EVOO in terms of nutrition, organoleptic, hygiene, and typical characteristics. The olive-oil sector involves significant diversity resulting from various farming methods, production processes, and supply-chain management, as well as effects resulting from regional features [124,125].
The agricultural production phase of the system for producing olive oil has the biggest environmental impact compared to other phases [125]. Namely, the field stage of olive production might have a footprint of 460 kg CO2-e/ton of olive [126], which is higher than that of packaging and transportation [127]. When compared to the oil-extraction processing phase, 93.8% of the total CO2 produced per liter of olive oil was of fossil origin [128], which is around 1.5 to 1.6 kg CO2-e/L of olive oil [126]. The International Olive Oil Council (IOC) created an application to calculate the carbon footprint of olive oil. The tool is one of the products of the work of an expert group formed by the IOC in 2012 to quantify and report greenhouse-gas emissions based on a life-cycle assessment approach (Figure 6). According to the IOC, the effect of carbon sink (or carbon sequestration) of olive trees through biomass and soil is much larger than the GHG emissions per liter of virgin olive oil when appropriate agricultural practices (for example, no tillage, mulching of pruning residuals, cover crops, and organic fertilizers) are used. An olive grove of one hectare offsets the annual carbon footprint of one citizen; when we produce a liter of olive oil, 10.64 kg of atmospheric carbon dioxide (CO2) is captured; and global olive-oil production would captivate the emissions of a city with over seven million people. As a result, olive-oil production has the potential to aid in the fight against global warming by absorbing more CO2 from the atmosphere than it emits and storing it in the soil and biomass [129].
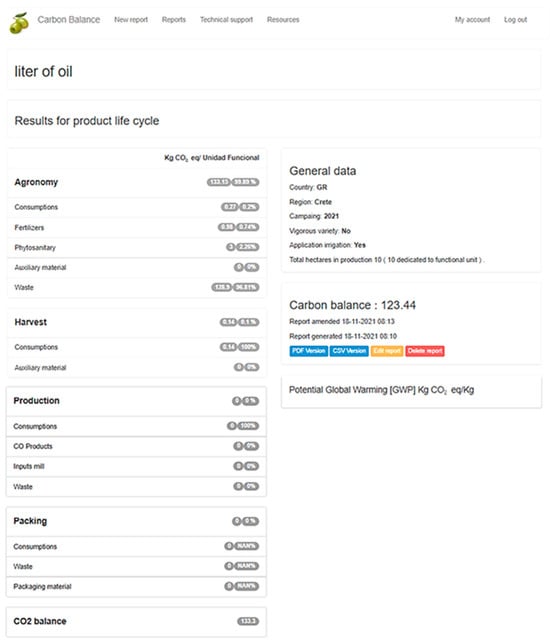
Figure 6. Example of carbon footprint results using the International Olive Oil Council’s (IOC) carbon-footprint tool [129].
The calculation and communication of the CF in the olive-oil industry can provide clients who are more and more interested in environmental produce a novel, simple indicator (such as kg of CO2 emitted/sequestered for every bottle of oil bought) [130]. Even though the CO2 sequestered is released into the environment throughout other stages of the life cycle, a mean rate of 0.25 kg of carbon per kg of olives was expected regarding the biogenic carbon stored in the olive fruits [131].
4. Water Footprint
Water makes up two-thirds of the Earth’s surface and fills 1.4 billion cubic meters of space. But only 3% of that is freshwater (Figure 7), and 69% of that is trapped in glaciers and polar icecaps [132]. Since fresh water is necessary for supporting life on our planet, just around 1% of the world’s water resources are viable freshwater.
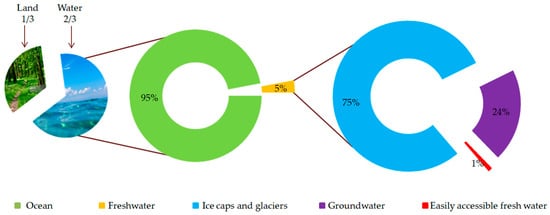
Figure 7. The earth’s water distribution, redrawn based on [132].
Due to the rise in global population over the past century, humanity is currently using resources and producing waste at a rate that is faster than the earth can replenish. The average global per-citizen consumption of products and services has increased, as has the global use of natural resources. Water is a natural resource that is becoming increasingly valuable throughout the world due to challenges like scarcity and overuse [133,134], which result in issues with society, the environment, and the economy [135,136]. Many nations in the world’s arid and semiarid regions are already at, or below, the 1000 m3 per person per year threshold for water scarcity [137]. Agriculture uses almost 70% of the world’s water resources, making it the biggest consumer of freshwater [138]. The Water Footprint (WF) method calculates the amount of water used (evaporated or absorbed into the product) and contaminated per functional unit, as per the CF. However, it can also be represented per day, month, or year, depending on the level of detail that is desired [139].
The WF is a measure that takes into account a consumer’s or producer’s direct (domestic water usage) and indirect (water needed to deliver agricultural and industrial goods) water use [140]. After Hoekstra presented the “water footprint” idea in 2002, the notion of considering supply chains for water use has grown in popularity [141]. The entire amount of freshwater utilized to generate the products and services consumed by a person or a community or delivered by a company is referred to as the WF of an individual, community, or business [140]; it may be computed for a specific good, for any clearly defined set of consumers (such as a single person, a city, a province, a state, or a whole country), or manufacturers (e.g., a private enterprise, a public organization, or economic sector) [23].
The two main methods for WF determination rely on (i) the LCA-based environmental impact [142] and (ii) the volumetric WF [141]. Within the latter, the green, blue, and grey water footprints are the three elements of water that are recorded in its calculation as water traces [23]. The term “blue water footprint” quantifies the irrigation water resources (surface and groundwater) evaporated from the soil and water body and transpired by the plant during the production cycle per unit yield. Consumption is the loss of water from the catchment area’s accessible ground-surface water body. Water losses occur when it evaporates, returns to a catchment region, the ocean, or is used to make a product. Consumption of rainwater (as long as it does not get lost via runoff or drainage) water per unit yield is referred to as the “green water footprint”. Given the usual contextual concentrations and the current ambient water-quality regulations, the amount of freshwater that is necessary to dilute the pollutants is known as the “grey water footprint” [141]. In agriculture, it is estimated as the amount of water per unit yield (m3/t) required to establish the N concentration in groundwater close to that of acceptable value (~0 mg N/L in natural body) after it has been increased due to N leaching, under the assumption that 10% of nitrogen fertilizer is leached [143]. The water footprint is an indicator of water usage that diverges from the traditional quantification of water removal in three ways (Figure 8). It does not account for the use of blue water, which goes back to its source. It also includes the use of green and grey water, and it is not just limited to blue water. Finally, it encompasses direct as well as indirect water usage, not just direct water use [141].
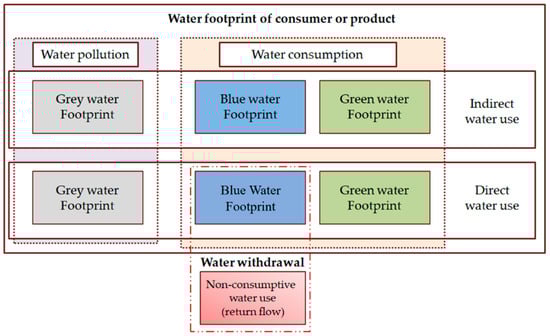
Figure 8. Schematic representation of the components of a water footprint (WF) (adapted by [141]).
The difference between a region’s WF of production (WFprod) and WF of consumption (WFcons) must be clearly defined. The first is the total amount of water used for home purposes directly and indirectly. The second is the total amount of water used domestically through domestic consumption, including both direct and indirect water use. Virtual water flows import and export (VWi and VWe), which occur from commerce in industrial and agricultural products and bring the two into balance. Either a top–down or a bottom–up calculation method can be used to determine the WFcons. The top–down method’s formula for calculating the WFcons is as follows.
WFprod + virtual water import (VWi) − virtual water export (VWe).
The bottom–up strategy is founded on raw, unfiltered, consumer data. There are three parts to the WF: blue, green, and grey water. The WF can be expressed as a single total figure, but it is a complex indicator to express water usage, displaying various forms of water consumption and contamination in relation to time and geography [139].
4.1. Water-Footprint Assessment
The chief aim of the water footprint idea is to highlight the unnoticed connections between global trade and the management of water resources and human consumption of water [23]. The Water Footprint Network (WFN) and LCA communities have established two basic approaches for the evaluation of the WF [140,144]. The WFN-based water footprint is useful in informing plans and actions in national and regional virtual water flow and trade; this approach can also aid in streamlining water management in the agriculture sector and allocating it as quantitative indicators. Blue, green, and gray water footprints consist of the three categories used in the WFN technique. Grey water footprints represent the fictitious volume of pollution, whereas green and blue water footprints represent the levels of water usage. As a result, we can use water footprints to calculate the consumption of freshwater and evaluate how industries’ wastewater discharges affect the environment [144].
A product’s influence on processes involving water resources, such as the procurement of raw materials, the supply chain, production, transference, use, and residue handling, is examined using the LCA approach’s water-footprint method. As a result, LCA-based water footprints could be employed to assess how products or companies affect aquatic habitats throughout their entire life cycle. A water footprint considers both the internal and external supply chains in addition to the enterprise’s water footprint [142]. LCA-linked methodologies for water footprint vary from straightforward water inventories to intricate impact-assessment models [145]. The methodologies mentioned above can generally be separated into quantitative and result-oriented water footprints. While impact-based water footprints try to quantify the repercussions derived from the consumption of water and need a description of separate flows before combination, volumetric approaches regulate the worldwide freshwater adoption of items on an inventory level. Characterization factors may indicate, for instance, a local freshwater shortage, depending on the methodology used [146], the quality of the water [147], ecosystem vulnerability [148], or the public’s sensitivity to harming human health [149].
According to Aldaya et al. (2012) [141], in the Network on Water Footprints (WFN), there are four major phases in a comprehensive water-footprint assessment:
-
Setting goals and scope: where is the largest WF location? What parts of the WF are unsustainable? Where can WF be cut back on?
-
Water-footprint accounting: What does the value chain’s green, blue, and grey WF represent?
-
Water-footprint sustainability assessment: Is the WF socially just, economically effective, and environmentally sustainable?
-
Water-footprint response formulation: How can WF be decreased in operations, the value chain, the sector, and the basin? Where should one start working?
4.2. Certification for Water Footprint
The quantity of water consumed both directly in the production process and indirectly throughout the supply chain is referred to as a product’s “water footprint”. Knowing precisely how much water is required to produce a good, deliver a service, or carry out an activity on behalf of an organization is necessary for effective water management (AENOR). The water footprint of olive production differs according to the various growing systems (intensive, traditional, and high density); the Water Footprint Network determined that olive production had a high WF value of 3015 L of water per kg [143], producing one ton of olive oil, accounting for olive oil’s 14,500 m3 water footprint [150].
4.3. Water-Footprint Label
The water-footprint label is a possible method to promote commerce and consumption in a way that is consistent with sustainable water use. A water-footprint label’s fundamental tenet is product openness. Customers might learn “the magnitude of contribution to the water use, pollution of water, and scarcity of water in various regions” with the help of such a label; this would allow them to differentiate between comparable products based on the various effects the supply chains of the products have on freshwater resources. A “yes” or “no” label considering if the produce meets a specific set of freshwater sustainability standards might serve as a simple water-footprint label. Additionally, it could offer additional specific details about the product’s exact water footprint and/or the effects of its manufacture on water quality, local water shortages, and ecosystems, i.e., the sustainability of the product’s water footprint [151]. The following section lists some of these water-footprint labels.
4.3.1. AENOR
The scope of the certification entitled AENOR is to validate the significance of the correct use of water in business strategies to preserve the ecological and societal worth of water, a rare and crucial resource for sustainable growth [152].
4.3.2. China Water Conservation Certification
One of the voluntary certifications offered by the China Quality Certification Centre is a resource-conservation certification, which certifies that products with the “JIE” suffix adhere to relevant certification standards for water conservation. The scope of the Water Conservation Certification includes industrial water treatment, urban water use, irrigation of agriculture, unconventional water-resource use, and more. China conducts resource-conservation certification to influence the public’s consumption of energy-saving items as well as the spread of cutting-edge technologies [153].
4.3.3. Smart Approved WaterMark (SAWM)
This is a program for certifying water efficiency that was established in 2004 at the height of the Millennium Drought. The main goal of the SAWM was to solve the problem of reducing domestic water use through the identification and certification of water-efficient technology and services, as stated in the National Water Initiative. The badge gives businesses a competitive edge in the market and encourages consumers to shop intelligently [154].
4.3.4. WaterSense
It provides labels to products that meet the EPA’s requirements for water performance and efficiency and is supported by independent, third-party certification [91].
To achieve freshwater sustainability goals, a tag giving the three diverse water footprints (green, blue, and grey WF) would be more effective compared to one presenting only the collective water footprint because offers customers the option to consider the comparative values of the water used or contaminated in the manufacturing process [151].
Governments may enforce measures like tax payment or obstacles to importation considering the footprint of water, but a label may be enough to motivate customers. This type of label could serve as the foundation for consumers to have higher awareness and for governmental policy choices [151].
4.4. Olive and Oil Production Water Footprint
The footprint of water in olive-oil and table-olive production varies depending on various factors such as plantation density, climate, irrigation practices, and production methods. Blue water usage can be significant, especially in regions where irrigation is needed to supplement rainfall. On the other hand, in the case of rainfed olives, the green water footprint is markedly higher compared to that of the irrigated ones. When we produce one ton of olive oil, we consume 257 to 3000 m3 ton−1 of green water (average value 1418), 150–1852 m3 ton−1 of blue water (average value 1245), and it generates 1400–1600 m3 ton−1 of grey water [155].
In a rainfed olive plantation (about 330 trees per ha), it was estimated a long-term mean impact of about 1.02 m3 per kg yield and 0.16 m3 kg−1 for green and grey WF, respectively [156].
According to [157], for one liter of olive oil that is bottled, over 99.5% of the water footprint is connected to the production phase, and the other components, such as the bottle, label, and cap, are responsible for less than 0.5%. The components of the olive-production water footprint are as follows. Rainfed systems have a 71% green water footprint, and irrigated systems have a 12% green water footprint, 7% blue water footprint, and 10% grey water footprint. To ensure the long-term availability of blue water, it is crucial to consider justifiable water use in olive production [158].
This entry is adapted from the peer-reviewed paper 10.3390/su16031227
This entry is offline, you can click here to edit this entry!