Resting-state fMRI and structural MRI investigations offer complementary insights into the distinctive frontal functioning associated with high hypnotizability. Reviewed studies indicate that individuals with high hypnotizability display more pronounced reductions in activation of the medial prefrontal or dorsal anterior cingulate cortex following neutral hypnotic induction than their low hypnotizable ones. Moreover, research has disclosed that induction-specific reductions in the activation of the DMN regions correspond to spontaneous changes in cognitive and perceptual states, and the state of attentional absorption during a hypnotic induction has been associated with reduced DMN activity and increased prefrontal attentional system activity.
1. Introduction
A peculiar characteristic of the human brain lies in its ability to transform endogenous mental representations into perceptual states. The construction of perceptual states involves a top-down dynamic interplay between sensory processing, memory systems, attentional mechanisms, and higher-order cognitive functions. This complex composition allows us to construct a coherent and meaningful perception of the external world based on our internal mental representations. Such a top-down process is modulated by hypnosis, a social interaction in which, in the classic instance, the participant responds to verbal suggestions for imaginative experiences conveyed by the hypnotist involving distortions in the environment awareness, e.g., conscious perception and memory, and sense of agency [
1,
2,
3,
4,
5]. Hypnosis is a special rapport between the hypnotized person and the hypnotist in which the subject becomes deeply absorbed and focused on the hypnotist’s voice with disconnection from extraneous stimuli and the letting go of thoughts [
2,
6].
In contrast, instrumental research uses hypnosis as a device to study a variety of psychological processes, including a dynamic interplay between sensory processing, memory systems, attentional mechanisms, and higher-order cognitive functions (involved, e.g., in functional amnesia, functional visual disorders, paranoia, false memories), to facilitate research in other fields (for details see [
8]). By adopting the intrinsic approach, Cardeña and Spiegel [
9] suggested three main components for hypnosis: absorption, dissociation, and hypnotic suggestibility. The term absorption refers to the degree to which one participant is intensely focused on a mental experience, while dissociation concerns the mental disengagement from the external environment [
9,
10,
11]. Hypnotic suggestibility (or hypnotizability) refers to the individual ability to respond to hypnotic suggestions involving self-orientation and automaticity, i.e., suggested responses are experienced as being produced involuntarily and effortlessly [
6,
11,
12]. Hypnotizability varies among people, with some individuals being more quickly and deeply hypnotizable while others may have more difficulty responding to suggestions. Experiential hypnotizability, i.e., a measure of experiential involvement in hypnotic suggestions, has been associated with the tendency to experience alterations in consciousness as boundary lessness, self-transcendence, and absorption [
13]. Hypnotizability is generally considered stable across the lifespan [
14]. Still, it has also been reported that it is not a stable trait and can be modified [
15,
16]. It varies across a single day [
17,
18] and between sessions [
19]. However, no one has specified the neural processes underlying behavioral responses to hypnotic suggestions, and little research has been focused on the specific factors that optimize responsiveness to hypnotic suggestions [
20,
21].
2. EEG Spectral Analysis and Functional Neuroimaging Techniques
The EEG and neuroimaging techniques involve registering electrical activity from the scalp using EEG electrodes mounted on a cap and signal processing through pre-amplification and amplification. These data are analyzed in temporal and frequency domains. Time domain analysis yields event-related potentials (ERPs) that reflect cortical activity linked to specific events and provide valuable insights into response timing of millisecond-level changes in cortical electrical activity.
In the frequency domain, the EEG oscillatory activity is quantified by its frequency (i.e., the rate of repetition of the oscillatory event), amplitude or power (i.e., the magnitude of the oscillatory signal at a given frequency), and phase (a measure of its position in time relative to a pre-defined cycle or close to a reference oscillation at the same frequency).
Resting-state oscillatory activity is traditionally defined as the superposition of oscillations falling within distinct frequency bands. The primary frequency bands of normative EEG oscillatory activity in adulthood are named delta (1–4 Hz), theta (4–8 Hz), alpha (8–13 Hz), beta (13–30 Hz), and gamma (>35 Hz). One of the most common signal frequency processing methods is a fast Fourier transform (FFT). An FFT provides the frequency power spectrum for a period, often averaged across a range of frequencies comprising a band (e.g., alpha). It also provides a phase spectrum. The power spectrum reflects the energy of each frequency determined by the squared amplitude of the wave. The phase spectrum reflects the phase in radians or degrees of the sine or cosine wave at each interval. Most frequency analyses focus exclusively on frequency power [
37].
Relatively to the spectral power measurement, recent research exploring EEG has highlighted a significant factor that might surprise or complicate results in resting EEG. Specifically, the power distribution within EEG frequency bands comprises two key components: a rhythmic, periodic aspect and an irregular, overlapping, aperiodic component. This aperiodic activity showcases power across all frequencies under a 1/f power-law pattern. It reaches its peak at lower frequencies and steadily exponentially decreases as frequency rises [
38]. The periodic component is characterized by the oscillatory peak’s bandwidth center frequency and relative amplitude.
In contrast, the aperiodic component is defined by the slope and offset or intercept (i.e., the position where this slope starts) of the power spectrum. The intercept might indicate heightened spiking in neural populations [
39,
40]. Even if aperiodic activity does not offer meaningful information to the EEG signal, mixing it with periodic activity, as has been the case in the majority of the resting-EEG studies, can introduce noise effects in conventional EEG frequency analyses, as exemplified recently by Ouyang and colleagues [
41]. These authors explored if cognitive processing speed correlated with alpha-range activity, as prior studies indicated. After separating periodic and aperiodic components within the alpha band, they found a link between mental processing speed and total alpha power before isolating them. However, this correlation vanished when considering only the actual periodic part of the signal. It persisted solely when the aperiodic portion was analyzed, i.e., measuring the aperiodic slope exponent and offset. As a result, both elements play a role in the overall power computed within distinct frequency bands, such as the alpha waves. This fact implies that the pure rhythmic activity is tied with non-oscillatory power that does not truly oscillate within that specific frequency range. This surprising outcome reshapes the understanding of earlier findings, emphasizing the psychological significance of aperiodic EEG data—challenging its classification as mere “noise.” These observations have highlighted the crucial need to differentiate between these distinct EEG activity patterns in research. Studies on EEG frequency oscillations obtained during several different behavioral tasks have outlined a link between EEG activity and various aspects of brain functions, encompassing sensory processing, perception, motor control, and cognitive activities such as attention, learning, memory, and emotional processing. These oscillations essentially serve as a functional code for the brain and are believed to facilitate communication between different brain regions and support associative processes [
42,
43,
44,
45].
2.1. EEG and Neuroimaging
The interpolation of EEG signals into scalp tomography and source analysis aids in understanding temporal resolution. However, these methods lack precision in spatial resolution, failing to pinpoint the origin of the brain’s activity. This discrepancy, known as the inverse problem, arises because diverse cortical distributions could generate identical scalp activity patterns. Additionally, variations in skull thickness influence how brain activity manifests on the scalp.
While EEG offers insights into underlying brain activity, techniques like dipole modeling simulate different brain generators to match theoretical scalp EEG patterns with actual recordings. However, for more precise localization, PET and MRI imaging techniques surpass EEG’s capabilities (for a detailed comparison, see [
46]. Various classification methods exist to distinguish distinct topographies in multichannel EEG data, aiming to describe EEG as potential maps with different time courses [
47,
48].
Understanding large-scale brain network communication has become pivotal. Analytical methods estimating connectivity in networks, applicable to both fMRI and EEG, have gained traction due to EEG’s high temporal resolution and direct measurement of synchronized neuronal activity across various frequencies. Functional connectivity measures, such as cross-correlation and phase synchronization, are standard, while newer methods assess effective connectivity, capturing causal relationships within brain circuits [
49,
50,
51].
Among multivariate methods for functional connectivity analysis, those using graph theory are providing appreciable improvement in understanding complex brain functioning. Graph theory provides the means for characterizing the available connections in the brain using a complex network model [
52]. This method assumes that the brain is represented as a ‘graph’ composed of ‘nodes’ (brain regions or electrodes) connected by ‘edges’ (links or connections between these regions). Measurement of the strength of connections between nodes usually uses measures like the weighted Phase Lag Index (wPLI) to account for volume conduction effects on brain connectivity estimation [
53].
2.2. PET and fMRI Methods
PET and fMRI methods are fundamental for understanding brain activity. Positron emission tomography (PET) explicitly measures cerebral blood flow (CBF) changes related to brain functions, deriving energy from oxygen and glucose carried through blood flow. Analyzing these flow alterations in various brain regions helps identify active areas during specific tasks. PET involves participants inhaling or being injected with a radioactive isotope, providing the tracer recorded by the PET scanner. The general procedure is to make a measurement, enabled by a gamma ray detector, during a control task, which is subtracted from the measurement taken during an experimental task. While PET’s temporal resolution might be compromised due to the time it takes for readings (minutes), it excels in pinpointing active brain regions during different processing types. Its versatility in measuring radioactively labeled molecules facilitates insights into perfusion, metabolism, and neurotransmitter turnover.
Functional magnetic resonance imaging (fMRI) also relies on blood flow changes in the cortex to identify active areas but uses a different technology from PET. An external magnet in fMRI detects local magnetic fields, analyzing hemoglobin’s magnetic properties pre- and post-oxygen absorption to map cortical blood changes and infer neuronal activity. Ogawa et al.’s groundbreaking research sparked significant enthusiasm for utilizing electrophysiology experiments to elucidate the neural basis of the blood-oxygen-level-dependent (BOLD) fMRI signal in human studies. In 1992, three distinct research groups separately achieved results in humans using the BOLD mechanism [
59,
60,
61], initiating the surge of fMRI publications that have consistently emerged in scientific journals since then (for further details, see [
62]). While fMRI boasts better spatial resolution and the ability to generate multiple images from a single individual compared to PET, its physical setup might be uncomfortable for some individuals and limits certain studies.
There are advantages to combining fMRI and PET; using fMRI gives us clear structural brain scans, while PET allows us to index blood oxygen-dependent activity throughout the brain. However, while neuroimaging can specify the activated regions during mental states or cognitive tasks, it cannot determine the ‘necessary’ brain areas for the functions of interest. Traditionally, lesion studies offered insights, but purposely inducing lesions in humans is unethical. Transcranial magnetic stimulation (TMS) emerged as an alternative, allowing brief inhibition or facilitation of specific brain areas.
3. Functional Neuroimaging Correlates of Resting Following Hypnotic Induction without Specific Suggestions
Several neuroimaging studies have demonstrated that hypnotic induction without task-specific or indirect suggestions induces plastic changes in neuronal activity by mainly engaging the frontal and thalamic areas (e.g., [
22,
30,
64,
65,
66,
67,
68,
69,
70,
71,
72]).
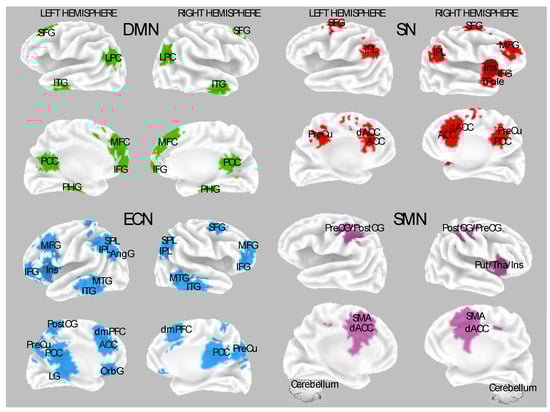
Figure 1 depicts the main neural networks, and the associated cortical brain regions found sensitive to hypnosis modulations and individual differences in hypnotizability. Above all, several reports indicate that hypnotic induction tunes higher-order neural systems involved in higher-order cognitive functions, supporting the top-down view of hypnosis. These observations are consistent across various experimental conditions, including the Stroop task, mental imagery, administration of noxious stimulations, as well as in resting state and neurophenomenological studies [
9,
64,
65,
70,
73,
74,
75,
76,
77,
78]. Dissociated control and cold control theories have resulted in being the most used models to explain experimental hypnosis data. These theoretical models served to design experiments well and formulate testable hypotheses (e.g., [
79,
80]).
Figure 1. Most reported studies used models to select spatial maps for functional connectivity. The following brain regions constitute four neural networks: default mode network (DMN, upper-left quadrant); salience network (SN, upper-right quadrant); executive control network (ECN, bottom-left quadrant); sensorimotor network (SMN, bottom-right quadrant). Abbreviations: SFG, superior frontal gyrus; LPC, lateral parietal cortex; ITG, inferior temporal gyrus; MTG, middle temporal gyrus; PHG, parahippocampal gyrus; IFG, inferior frontal gyrus; Ins, insula; MFG, middle frontal gyrus; SPL, superior parietal lobule; ACC, anterior cingulate cortex; OrbG, orbital gyrus; PreCu, precuneus; PCC, posterior cingulate cortex; LG, lingual gyrus; SMA, supplementary motor area; dACC, dorsal anterior cingulate cortex; PostCG, post-central gyrus; PreCG, precentral gyrus.
Research on the neural underpinnings of agency connects executive control to the retrospective monitoring of the fluency between intentions and actions and the resultant sense of control [
84,
85]. While the executive system effectively responds to suggestions, hypnotized individuals’ perception of a lack of ownership over their thoughts and actions is attributed to inaccurate metacognitive representations [
86]. However, it is essential to note that these theories often settle on the traditional suggestion effect (expressly, the disruption of agency) and, therefore, may have limited explanatory scope.
In a PET study, Maquet and collaborators [
69] have shown that subjects, during revivification of pleasant autobiographical memories in hypnosis, experienced significant activations of a widespread, mainly left-sided, set of cortical areas involving occipital, parietal, precentral, premotor, and ventrolateral prefrontal cortices and a few right-sided regions (occipital and ACC).
Studies that investigated functional neuroimaging correlate during rest following hypnotic induction showed increased brain activity in the anterior part of the default mode network (DMN) during rest in HH individuals. The DMN comprises active brain regions without goal-directed activity (
Figure 1). It involves the posterior cingulate cortex (PCC) and preCu (PreCu), medial prefrontal cortex (mPFC), pregenual cingulate cortex, temporoparietal regions, and medial temporal lobes. It is implicated in episodic memory retrieval, self-reflection, mental imagery, and stream-of-consciousness processing [
88,
89,
90].
Suggestions delivered within the context of hypnosis can induce dynamic changes in brain activity [
24,
32,
91,
92]. It has been observed that during hypnosis, successful suggestions to modify the sensory and emotional components of a given stimulus can enhance activity in the brain regions in which the modulation of functional connectivity between the ACC and the involved different brain regions is relevant [
2,
93].
Furthermore, in a more recent study, Rainville and colleagues [
78] assessed resting-state brain activity before and after a ‘neutral hypnotic induction’ using arterial spin labeling (ASL, a functional magnetic resonance imaging method sensitive to brain perfusion [
99]. The study disclosed a positive association of enhanced perceived self-reported automaticity during resting-state in hypnosis with the activity in the parietal operculum and the anterior part of the subcallosal anterior mid-cingulate cortex (aMCC). These findings are in line with previously reported findings that increases in self-reported automaticity at hypnotic rest (i.e., without any stimulus or task) are positively associated with the activity in the parietal operculum [
100] and with the frontoparietal network involved in phenomenological aspects of self-agency and volition [
101] and demonstrate that these effects can be evidenced at rest, in the absence of overt motor challenges.
4. Structural and Functional Neuroimaging Correlates of Hypnotizability
Although research methods on individual differences in hypnotic susceptibility or hypnotizability have mainly been criticized [
28], neuroscientific explorations of hypnotizability offer crucial evidence for constructing a reliable science of hypnosis [
154]. The HH individuals are typically identified by their ability to shape their behavior and subjective experience in line with hypnotic suggestions [
155]. Not only do they respond more strongly to suggestions, but they also encounter a broader range of unusual experiences during hypnosis compared to LHs [
156,
157].
Several studies have investigated the neural correlates of hypnotic susceptibility, focusing on comparing HH and LH individuals. Structural neuroimaging testing reveals anatomical differences in frontal sites, including a larger anterior corpus callosum for HHs, facilitating inter-hemispheric coordination [
96,
158,
159]. These volumetric disparities might be reflected in distinct patterns of frontal neural activity among HHs [
160].
More recently, as mentioned above, DeSouza and colleagues [
146] (
Table 2) reported an MRI study investigating individual differences in hypnotizability wherein GABA concentration within the ACC was positively associated with hypnotic induction profile hypnotizability scores. Additionally, an exploratory analysis of questionnaire subscales revealed a negative relationship between glutamate and absorption and individual tendency to imaginative involvement. These results provide a potential neurobiological basis for individual differences in hypnotizability, a result that is useful to guide clinical treatment through hypnosis.
Functional neuroimaging studies partially support the top-down view of hypnosis, indicating distinct cross-network interactions involving the ECN and SN networks in HHs compared to LHs [
148,
158,
164]. Baseline differences in attention-related networks may reflect the higher cognitive regulation capabilities observed in HHs during hypnosis [
12]. Further brain imaging findings have reported higher dACC amplitude during rest in HHs than LHs and significantly lower dACC activity in emotional and memory experiences during hypnosis compared to the resting state. Increased functional connectivity between the DLPFC (region of the ECN) and the insula in the SN and decoupling of the DLPFC (part of ECN) and the PCC (part of DMN) have been found during hypnosis [
67].
Neurophysiological investigations reported distinct frontal oscillatory patterns linked to hypnotic susceptibility, suggesting that structural neural differences underlie functional activity differences [
6]. However, one study challenges this interpretation, demonstrating increased functional connectivity without corresponding structural differences among HHs [
148]. In a neuropsychological review, Kihlstrom and colleagues [
165] found limited evidence that frontal dysfunction increases hypnotic susceptibility. Nevertheless, the findings suggest that structural and functional differences in the frontal brain contribute partially to hypnotic susceptibility.
Several of the original research suggests that the level of susceptibility to hypnosis primarily relates to variations in top-down regulation. The HH individuals are believed to possess a unique ability to exercise control—via both inhibition and facilitation—over cognitive functions [
166,
167,
168,
169].
In line with these observations are those detected in a study comparing analgesic placebo responses that highlighted distinct differences in the DLPFC activity between HHs and LHs without observable behavioral differences between the groups [
162].
The hypothesis connecting hypnotizability to differences in cognitive processing has roots in the research of the eighties and nineties [
178,
179,
180,
181]. Rather than emphasizing enhanced attention, this framework suggests that HH individuals employ effective cognitive strategies to process suggestions, resulting in better hypnotic responding [
182].
Interestingly, Santarcangelo and colleagues [
187], starting on postural control findings showing that HHs exhibited a less strict postural control, conceptualized hypnotizability as an individual trait responsible for relative variability in postural and visuomotor control and suggested hypnotizability as being involved in constructing individual sensorimotor selves. More recent structural MRI findings have provided evidence of reduced GM volume in the cerebellum of HHs than LHs [
161].
The model reserved a leading role of the cerebellum in hypnotic responding and suggested the involuntariness in hypnotic responding to sensorimotor suggestions as a natural effect rather than merely experienced by an HH individual [
187,
189]. The morphological variations discovered by these authors expand the conventional focus on the cortex’s role in hypnotizability to include cerebellar regions. This inclusion suggests that unique features in the cerebellum might contribute to differences in sensorimotor integration and emotional regulation related to hypnotizability.
This new conceptualization of hypnotizability seems very interesting and deserves further validation and extensions.
Interestingly, research has shown that disrupting the activity of the left DLPFC using repetitive transcranial magnetic stimulation (rTMS) can enhance hypnotic responsiveness [
108]. However, it is worth noting that in the first experiment reported by Coltheart et al. [
190], which was an exact replication of Dienes and Hutton’s study [
108], the authors did not find any significant change in hypnotic responsiveness after applying rTMS to the left DLPFC. However, in a second experiment by the same authors, wherein hypnotic response was measured objectively, they observed increased hypnotic responsiveness with right-sided DLPFC stimulation.
5. EEG Oscillations and Their Associations with Hypnotizability and Hypnosis
Early investigations into EEG patterns during hypnosis reported an increased occurrence of occipital alpha waves in HHs compared to LHs [
193,
194,
195,
196,
197,
198]. Later studies have reported increased alpha activity in HHs during hypnosis [
199], as well as after the hypnotic induction procedure [
200,
201,
202]. However, findings from later studies failed to detect an increase in alpha activity with hypnosis [
165,
203]. However, Franz and co-workers [
204] re-processed their-own EEG data from a previously published ERP odd-ball study [
205] to investigate whether hypnotic suggestions of a visual obstruction would influence the amplitude of ERP components (N1, P2, and P3b amplitudes). The study also provided source reconstruction and spectro-temporal connectivity analysis of the P3b-related frequency oscillations within the conventional frequency bands (i.e., 1−30 Hz). In response to targets, P3b amplitudes and P3b source were significantly reduced in occipital and parietal brain areas (related to categorization and attention to stimuli).
Additionally, both frontal and parietal electrodes were significantly reduced in effective connectivity within the sole P3-related alpha frequencies (10.5–12 Hz) during hypnosis compared to the control condition. These results provide preliminary evidence that hypnotic suggestions of a visual blockade are associated with a disruption of the coupling within the frontoparietal network implicated in top-down control.
The most consistent relationship between EEG activity and hypnosis is reported in the theta band (4–8 Hz) [
32,
33,
91]. Several studies have reported increased spectral power in the EEG-theta band during hypnosis [
200,
203,
206,
207,
208]. Crawford and collaborators [
209] said that HHs, compared to LHs, had significantly more significant hemispheric asymmetries (right greater than left) in the parietal region for all frequency bands usually associated with sustained attentional processing, in high-theta (5.5–7.45 Hz), high-alpha (11.5–13.45 Hz), and beta activity (16.5 and 25 Hz). Later, De Pascalis et al. [
207] found that only HHs exhibited a higher low-band theta (4–6 Hz) amplitude in bilateral frontal and right posterior areas and a smaller alpha (8.25–10 Hz) amplitude bilaterally in the frontal cortex.
There is also evidence of increased gamma activity (above 35 Hz) under hypnosis [
213,
214]. In an early study, Ulett and colleagues [
198] measured a decrease in theta and an increase in alpha, beta, and gamma (40 Hz) activity in the right occipital cortex during hypnotic induction. Further, De Pascalis and colleagues [
215,
216] reported that HHs exhibited greater 40-Hz EEG amplitude density during emotional states than LHs in nonhypnotic and hypnotic conditions. However, these results were not confirmed by Crawford and coworkers’ [
209] observations, although these authors reported a significant beta power increase in the right parietal region.
Notably, the most pronounced differences in EEG patterns related to hypnotizability have been reported in the theta spectrum. However, these differences are primarily observed between HHs and LHs, excluding medium hypnotizable individuals (MHs). Crawford [
219] proposed a dynamic neuropsychophysiological model of hypnosis involving the activation of the frontal-limbic attentional system. This model posits that attentional and disattentional processes are crucial in experiencing hypnosis, with low theta (3–6 Hz) and high theta (6–8 Hz) rhythms linked to these processes.
Sabourin et al. [
203] observed that during hypnosis, both LHs and HHs increased mean theta power (4–7.75 Hz), indicating intensified attentional processes and imagery enhancement. Further research consistently found that HHs tend to exhibit more significant slow-wave theta activity than LHs, both at baseline and during hypnosis, and both groups showed an increase in slow-wave activity after hypnotic inductions [
202,
206].
Despite these observations, recent studies have not found significant power changes in EEG frequency bands during hypnosis, questioning the hypothesis of theta rhythm as a definitive neurophysiological signature of hypnosis (e.g., [
220,
221]). Terhune and colleagues [
127] also reported increased alpha2 (10.5–12 Hz) power during hypnosis but no significant differences in other EEG bands. Even studies comparing HHs to LHs in the waking state have shown mixed results, with some studies reporting higher theta power in HHs [
6,
200,
222] and others noting no theta differences between the groups [
168].
Williams and Gruzelier [
202] reported increases in alpha power (7.5–13.5 Hz) in HHs at posterior regions during the transition from pre-hypnosis to hypnosis conditions, with decreases observed after hypnosis. The reverse pattern was seen in LHs. Schnyer and Allen [
217] reported that HHs exhibited a greater density in the 36–44 Hz frequency band during posthypnosis recognition amnesia, indicating their enhanced ability to maintain focused attention outside hypnosis. Later, De Pascalis et al. [
207] reported higher 40 Hz EEG amplitudes in HHs during resting hypnosis conditions compared to LHs.
6. EEG Connectivity of Hypnosis and Hypnotizability
6.1. EEG Functional Connectivity Measure
The brain’s electrical activity results from dynamic interactions among distributed neural networks, displaying transient and quasi-stationary processes. The statistical dependency of physiological time series recorded from different brain areas, known as “functional connectivity”, encompasses synchronous oscillatory activity crucial for neural coordination across various cell assemblies involved in multiple systems and representations [
237,
238]. It is widely accepted that neural synchrony is pivotal in integrating information essential for perception, cognition, emotion, and the representation of consciousness aspects such as body ownership, self-consciousness, and identity [
239,
240]. One prevalent assumption in hypnosis-suggestion research is that induced alterations in experiential content are associated with distinct changes in functional connectivity. EEG functional connectivity and fMRI research have provided consistent findings showing that HH individuals exhibit distinctive patterns of neural network connectivity.
Measures of dependence between multiple time series, whether linear (coherence, COH) or nonlinear (phase synchronization), can be expressed as combinations of lagged and instantaneous dependence. These measures, with values ranging from 0 to 1, indicate independence when they are zero. They are defined in the frequency domain and apply to stationary and non-stationary time series. These measures find utility in various fields, including neurophysiology, where they assess the connectivity of electric neuronal activity across different brain regions. However, it is essential to note that any measure of dependence in this context may include non-physiological contributions from volume conduction and limited spatial resolution [
241]. A conventional measure of functional connectivity between two cortical regions is EEG coherence, believed to reflect the strength of interconnections between cortical areas [
242]. EEG coherence between pairs of scalp locations offers valuable insights into brain states, indicating the competition between functional segregation and integration in brain dynamics. However, scalp-recorded EEG coherence has limitations, as even focal brain activity generates widespread EEG voltage patterns.
6.2. EEG Functional Connectivity Findings under Resting Hypnosis
In a single case study by Fingelkurts and co-workers [
248] using a sophisticated EEG functional connectivity measure (Index of Structural Synchrony), the study provided evidence of local and long-distance functional connectivity changes within the cortex after a neutral hypnotic induction and disruption in the functional synchronization among neural assemblies in the left frontal cortex and these changes remained stable even a year later.
Cardeña and co-workers [
156] recorded resting EEG during hypnosis by adopting a neurophenomenological approach to investigate neutral hypnosis (involving no specific suggestion other than to go into hypnosis). They found that hypnotic depth correlated positively with spectral power and power heterogeneity (i.e., the raw power of the Global Field Power curve) for the fast EEG frequencies of beta2 (18.5–21.0 Hz), beta3 (21.5–30 Hz), and gamma (35–44 Hz), but only among HHs, a finding seen consistent with the position reported in previous studies that hypnosis is associated with increased 40 Hz gamma activity, particularly among HHs (e.g., [
249]). Following the neutral hypnotic induction, they observed that HHs had spontaneous imagery, positive affect, and anomalous perceptual states that were also associated with lower global functional connectivity during hypnosis. Imagery correlated positively with gamma power heterogeneity and negatively with alpha1 power heterogeneity. Generally, the HHs displayed an opposite pattern of correlations to that found for the Lows.
6.3. EEG Functional Connectivity Correlates with Hypnotizability
Gruzelier [
167] has proposed a working neurophysiological model of hypnosis and hypnotizability in which HHs under hypnosis are characterized by a reduced upper alpha band coherence between the left frontal and medial electrode pairs. In contrast, increased upper alpha coherence between the same electrode pairs marks the LHs, and decreased coherence within left frontal brain activity during hypnosis delineates the HHs.
Advanced research by Egner and collaborators [
64] used a combination of event-related fMRI and EEG coherence recordings with the Stroop task to test predictions from the dissociation theory that hypnosis dissociates executive control and monitoring processes [
82,
252]. These authors evaluated neural activity in the Stroop task after hypnotic induction without task-specific suggestions. The fMRI results revealed that conflict-related ACC activity interacted with hypnosis and hypnotizability since HHs displayed increased conflict-related neural activity in the ACC during hypnosis compared to baseline and LHs. Interestingly, activity in the DLPFC, associated with cognitive control, did not differ between hypnotizability groups and conditions. HHs exhibited a decrease in EEG gamma band coherence, from baseline to hypnosis, between frontal midline and left lateral scalp sites, while LHs showed a gamma band coherence increase. These findings indicate a decoupling between conflict monitoring and control processes during hypnosis and suggest a negative link between hypnotizability and efficiency of the frontal attention system. These findings align with the view that HH individuals are particularly prone to focusing attention at baseline. However, after hypnosis, their attention control ability appears weakened due to a disconnection between the conflict monitoring and cognitive control processes of the frontal lobe became disconnected.
The study mentioned above findings by Egner and colleagues [
64] fit well with the general model proposed by Jamieson and Woody [
109], in which breakdowns in the functional integration between different components of executive control networks account for core features in the phenomenology of the hypnotic condition. Alternatively, these findings can also be explained as dissociation or shifts in subjective evaluations of one’s agency during the hypnotic experience, as proposed by the Cold Control theory of hypnosis [
83]. The Cold Control theory suggests that hypnosis primarily involves a change in metacognition, where hypnotic responses occur due to a lack of awareness regarding the intentions that drive cognitive or sensorimotor actions, i.e., the activation of sensorimotor network.
7. Conclusions
Resting-state fMRI and structural MRI investigations offer complementary insights into the distinctive frontal functioning associated with high hypnotizability. Reviewed studies indicate that individuals with high hypnotizability display more pronounced reductions in activation of the medial prefrontal or dorsal anterior cingulate cortex following neutral hypnotic induction than their low hypnotizable ones [
9,
67]. Moreover, research has disclosed that induction-specific reductions in the activation of the DMN regions correspond to spontaneous changes in cognitive and perceptual states, and the state of attentional absorption during a hypnotic induction has been associated with reduced DMN activity and increased prefrontal attentional system activity [
73]. Furthermore, fMRI and EEG research using diverse functional connectivity methods has underscored the complexity of neural mechanisms during hypnosis. Specifically, HH individuals, who usually feel the most hypnotized, have shown the highest connectivity between the bilateral DLPFC (i.e., ECN) and ipsilateral insula (i.e., SN) during hypnosis compared to rest. At the same time, for LHs, there are no differences between conditions. This enhanced connectivity during hypnosis is accompanied by reduced connectivity within DMN regions, contributing to altered agency and self-consciousness [
67,
148]. The intricate relationship between SN, ECN, and DMN further delineates the neural correlates of hypnotizability. Some authors have reported the uncoupling of connectivity between the ECN and the DMN during hypnosis [
67].
In contrast, others have found the contrary true [
9]. Spiegel and colleagues’ work explained the dissociation between ECN and DMN in response to hypnotic induction as an engagement in the hypnotic state and the associated detachment from internal mental processes such as mind wandering and self-reflection. This explanation reinforces the idea of resting hypnosis as a different state of consciousness rather than a reduced level of arousal [
96].
According to Demertzi and colleagues’ conceptualization [
123], hypnosis alters resting-state fMRI networks by diminishing “extrinsic” lateral frontoparietal cortical connectivity, which might reflect a decreased sensory awareness. In this altered state, the default mode network (DMN) exhibits increased connectivity in its lateral parietal and middle frontal regions but reduced connectivity in its posterior midline and parahippocampal structures [
74,
123]. However, other studies reported that connectivity in hypnosis is not limited to the DMN, depending on the depth of hypnosis and the ongoing emotional involvement and mental content, making this conceptualization questionable [
95,
180]. Furthermore, the assessment of neuroimaging assays of hypnosis using the Activation Likelihood Estimation (ALE) method by Landry et al.’s [
22] findings did not align with this perspective. Instead, the study demonstrated a stronger correlation between hypnotic responses and activation of the lingual gyrus, suggesting a potential association with mental imagery. Nevertheless, several encouraging research paths point to associations between hypnosis, hypnotizability with neuroimaging functional connectivity and EEG non-oscillatory aperiodic activity that may shed light on individual differences in hypnotic suggestibility and the mechanisms of suggestion. For example, DeSouza et al. [
146], using structural neuroimaging measures, have reported a significant positive association between γ-aminobutyric acid (GABA) concentration in the anterior cingulate cortex (ACC) and hypnotizability [
146], as well as an inverse relationship between trait hypnotizability and perseveration (served by executive control and the salience systems) [
267]. This novel outcome indicates that hypnotizability is a temperamental trait predisposing individuals to be more or less responsive to suggestions. These observations would be highly beneficial for improving clinical treatments with hypnosis.
This entry is adapted from the peer-reviewed paper 10.3390/brainsci14020115