Your browser does not fully support modern features. Please upgrade for a smoother experience.
Please note this is an old version of this entry, which may differ significantly from the current revision.
Blood speckle tracking echocardiography (BSTE) is a new, promising 4D flow ultrafast non-focal plane imaging technique. BSTE is highly feasible, fast, and easy for visualization of normal/abnormal flow patterns in healthy children and in those with congenital heart disease (CHD). BSTE allows for visualization and basic 2D measures of normal/abnormal vortices forming the ventricles and in the main vessel. Left ventricular vortex characteristics and aortic flow patterns have been described both in healthy children and in those with CHD.
- blood speckle tracking
- echocardiography
- children
- 4D echocardiography
1. Background
Four-dimensional flow imaging is an evolving cardiovascular imaging technique allowing for revolutionary flow imaging visualization and characterization whose main fields of application are cardiac magnetic resonance imaging (cMRI) and echocardiography [1][2][3][4][5]. Four-dimensional flow echocardiography was introduced in the late 2000s/beginning of the 2010s [4][5][6][7]. The first 4D echocardiographic techniques were contrast-enhanced ultrasound echocardiographic particle image velocimetry (EPIV) (e.g., the speckle tracking of injected microbubbles using contrast echocardiography) [6] and color-Doppler-based vector flow mapping (e.g., a technique combining information on speckles emerging naturally from the blood and color Doppler information on unidirectional flow along the axial axis of ultrasound beam in an angle dependent way) [7]. Potentialities of these preliminary 4D flow echocardiographic techniques were first tested for the study of the direction of septal shunts [7], for the evaluation of vortices within systemic ventricles [4], and for the understanding of complex flow dynamics in stenotic pulmonary valve [5].
More recently (2019), a new echocardiographic technique was introduced [8][9][10][11][12][13][14][15][16][17][18][19]: high-frame-rate blood speckle tracking (BST), using ultrafast ultrasound imaging for blood visualization. BST uses a new non-focal plane wave ultrafast (e.g., 2500–5000 frames per second, reduced on the display to 400–600 frames per second) ultrasound technology [12][13][14][15]. BST offers the advantages of being fast, angle-independent, non-invasive, and very easy to use [12][13][14][15]. BST echocardiography may be helpful in the evaluation of complex flow patterns in congenital heart diseases (CHDs) [12][13][14][15]. BST acquisition requires just a few seconds, like common color Doppler, and imaging re-elaboration is also extremely fast [12][13][14][15]. Compared to conventional color Doppler, BST allows for a more direct and intuitive visualization of complex flow dynamics and for visualization of vortices that are not identified by conventional Doppler techniques [12][13][14][15]. Thus, in complex CHD, the use of BST in conjunction with color Doppler may allow a deeper understanding of the physiology of the cardiac defect, without a significant loss of time [12][13][14][15].
2. Feasibility of BST in Children
2.1. BST Imaging Acquisition Technique
BST acquisition is like common color Doppler, very fast and totally non-invasive [12][13][14][15]. To acquire a BST movie, it is sufficient going on the color Doppler function, select the BST icon on the screen, and save the image. Re-elaboration of BST saved frames is also very fast and easy. One just needs to press the bottom “show the particles” and the software automatically generates the vortex movie [12][13][14][15]. The whole process (e.g., imaging acquisition and re-elaboration) will take just a few seconds [12][13][14][15]. Good-quality BST images may be acquired in normal conditions, without the need for sedation [12][13][14][15].
2.2. Feasibility in Different Conditions
Feasibility of BST in healthy children and in those with different congenital heart diseases has been proven in studies with good sample sizes [11][13][17]. Extremely high (e.g., >99%) feasibility of BST [11] in visualizing flow patterns in the area of interest was firstly proved in 2019 in a study over a mixed population of healthy subjects and fetuses and children with cardiac disease (e.g., 102 subjects, 21 weeks to 11.5 years of age, 4 fetuses, 51 healthy children and 47 children with CHD) [11]. Blood speckle tracking echocardiography furthermore provided accurate for velocity measurements down to 8 cm/s, but compared with pulsed-wave Doppler, BST displayed lower velocities [11]. In another series of 20 infants with CHD [13], BST echocardiography showed its potentialities for a better visualization and deeper understanding of flow dynamics in complex CHD [13] in adjunction with conventional color Doppler. Furthermore [13], it was remarked that BST was highly feasible, reproducible, fast, and easy to use. Other studies [15][18] have proved how feasibility of BST for LV vortex analysis was also very high, varying from 95.6% to 98% [15][18] in healthy children to 93.7% for children with CHD [18]. BST, furthermore, was highly feasible in the evaluation and characterization of aortic flow patterns [8][19], as well as for the quantification of 2D of the left ventricle [15][18] and aortic [19] vortex dimensions. BST offered the advantage of accurate and reproducible quantification of complex and new parameters, such as vorticity [8] and energy loss [8][10], but only with dedicated research software [8][10]. Research software has recently employed (2023) [14] for BST evaluation of left ventricular intraventricular pressure difference (IVPD) in healthy children and in those with different cardiomyopathies with a good feasibility (e.g., feasibility of 88.3% in controls, 80% in children with dilated cardiomyopathy (DCM), and 90.4% in hypertrophic cardiomyopathy) [14].
2.3. Summary of Current Evidence
BST analysis is very easy, fast, reproducible, and accurate for blood flow visualization across the heart chambers and main vessels [8][11][13][17][19]. Analysis of left ventricular vortex [15][18] and aortic flow patterns [8][19] is very feasible in both healthy neonates and children [8][15][18][19] and in those with CHD. Two-dimensional quantification of vortexes is feasible with current technology [18][19], while more complex analysis (e.g., energy loss, intraventricular pressure difference, vorticity) [8][14] are feasible, but only with dedicated research software.
3. BST for the Evaluation of Vortex in Ventricular Chambers
3.1. Vortex in the Left Ventricle
Vortices naturally form in all cardiac chambers, but have been studied most extensively in the left ventricle (LV) [12][15][18], where they have supposed to have the function of a reservoir of kinetic energy facilitating systolic ejection of blood flow into the left ventricular outflow tract. The geometry and anatomical locations of vortices are different in healthy adult subjects and in those with cardiac disease [2][3]. Preliminary observations by contrast-enhanced ultrasound echocardiographic particle image velocimetry (EPIV) in a small sample of 9 adults with a Fontan circulation (mean age 31.5 ± 12 years) [4] showed how height and sphericity index of the vortex in the systemic ventricle were significantly smaller and vortex width larger when compared to 15 age-matched controls. The limited data available in children by BST also demonstrate that LV vortex may differ in children with CHD compared to healthy counterparts [19]. A study in 50 preterm infants (weight 500–2020 g) [15] showed how LV vortex area positively correlated with cardiac dimensions including LV diameters (p < 0.01), and mitral annulus (p < 0.01). In a study [19] of over 60 children with different congenital heart diseases (median age 1.28 years, interquartile range 0.2–6.82 years) and 193 age-matched healthy children, limited differences were noted in vortex distance to apex, distance to interventricular septum, height, width, and sphericity index among CHD and healthy children. Vortex area indexed by body surface area (Vai), however, was significantly higher in children with CHD than healthy subjects (p < 0.0001) [18]. Differences in vortex position among different CHDs were furthermore noted in CHD characterized by left ventricle volume or pressure overload associated with vortices localized closer to the interventricular septum [18] Table 1.
Table 1. Vortex characteristics in healthy subjects and in those with congenital heart diseases. From Marchese P. et al. [18].
| Healthy (n = 118) | Healthy Age-Matched (n = 48) | CHD (n = 43) | P° | |
|---|---|---|---|---|
| Age, years | 6.84 (2.94–10.5) | 1.53 (0.37–6.84) | 0.99 (0.10–6.82) | 0.473 |
| Height, cm | 121 (89.2–142) | 80.0 (62.5–114) | 75.0 (58.5–116) | 0.613 |
| Weight, kg | 25.0 (14.3–37.2) | 11.0 (6.55–24.0) | 7.95 (4.22–19.0) | 0.327 |
| Distance to apex, mm | 21.2 (16.0–28.0) | 17.9 (13.7–21.0) | 16.5 (12.1–23.9) | 0.766 |
| Distance to apex/distance from apex to mitral valve, % | 39 (32–49) | 38 (30–51) | 39 (30–48) | 0.742 |
| Distance to IVS, mm | 11.0 (8.42–13.5) | 9.41(6.49–13.4) | 8.70 (6.10–13.3) | 0.526 |
| Distance to IVS/distance from IVS to LV free wall, % | 31 (25–41) | 37 (27–45) | 34 (25–40) | 0.309 |
| Height/BSA, mm/m2 | 10.7 (7.95–15.4) | 15.3 (10.3–20.5) | 18.6 (11.4–28.3) | 0.142 |
| Height/LVEDA, mm/cm2 | 0.75 (0.54–1.31) | 0.74 (0.50–1.03) | 0.51 (0.40–0.73) | 0.429 |
| Width/BSA, mm/m2 | 9.18 (6.86–11.9) | 12.4 (9.25–15.6) | 16.7 (10.2–22.5) | 0.051 |
| Width/LVEDA, mm/cm2 | 0.66 (0.48–0.98) | 0.57 (0.44–0.81) | 0.43 (0.34–0.57) | 0.235 |
| Sphericity Index | 1.20 (1.05–1.39 | 1.24 (1.06–1.50) | 1.18 (1.00–1.33) | 0.437 |
| Area/BSA, cm2/m2 | 0.67 (0.51–0.95) | 0.82 (0.63–1.08) | 1.01 (0.75–1.64) | 0.096 |
| Area/LVEDA, cm2/cm2 | 0.03 (0.02–0.05) | 0.04 (0.03–0.06) | 0.04 (0.03–0.08) | 0.349 |
BSA = body surface area, CHD = congenital heart disease, LVEDA = left ventricle end-diastolic area, IVS = interventricular septum, LV = left ventricle. P° CHD vs. healthy age-matched.
Examples of physiological and pathological left ventricular vortices are provided in Figure 1).
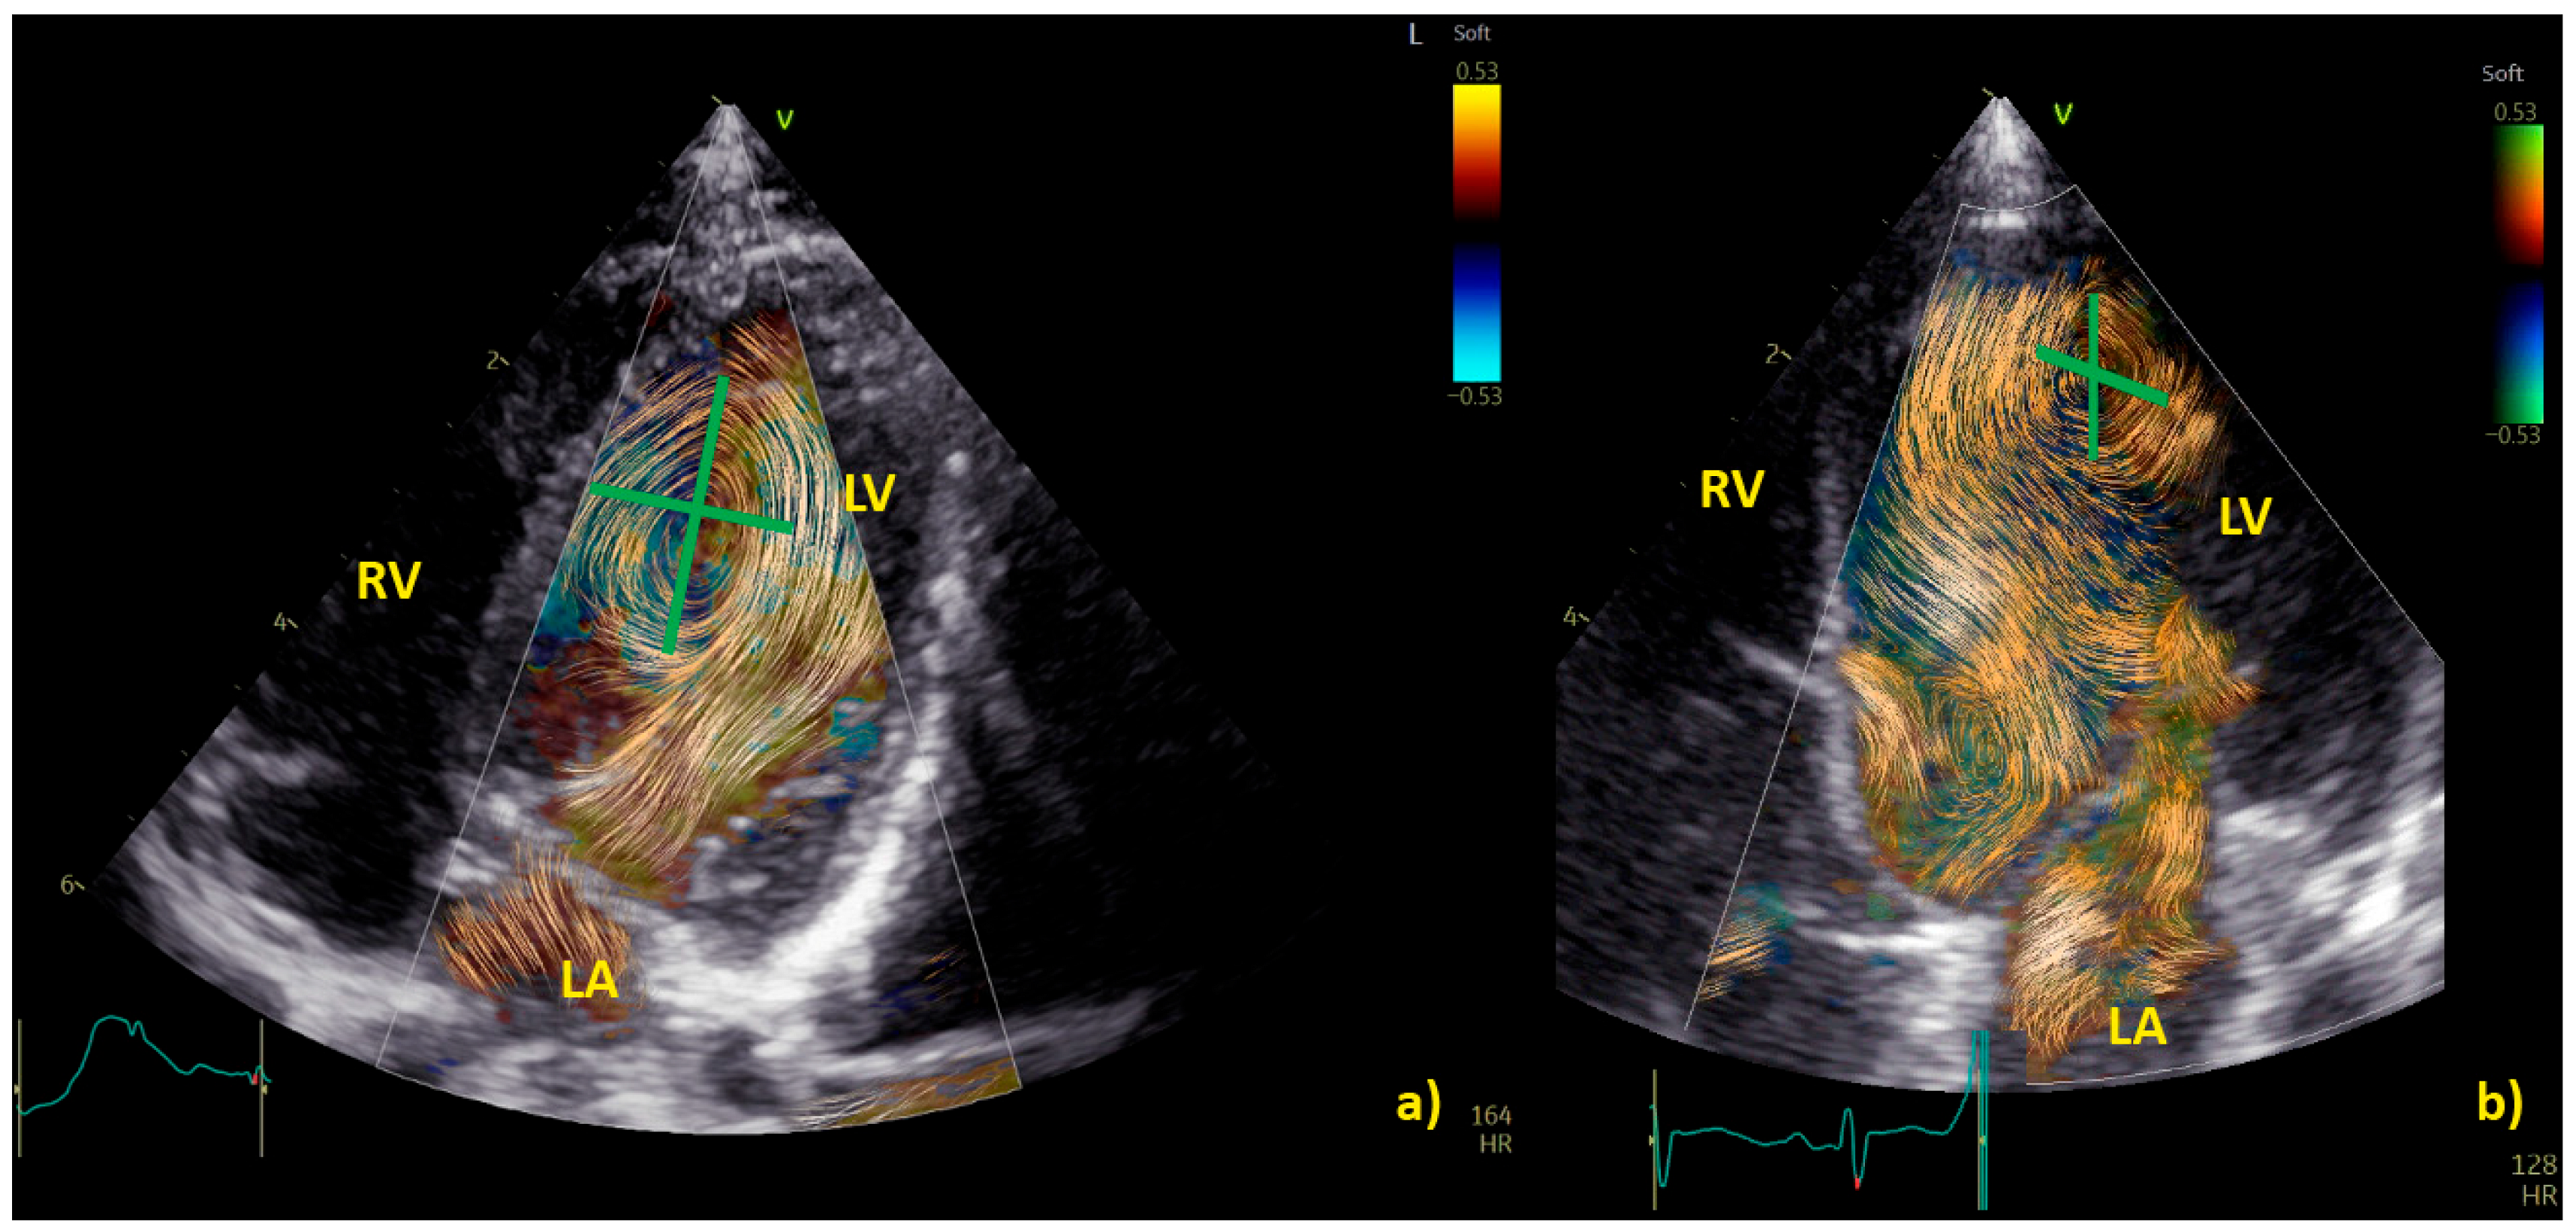
Figure 1. Comparison of left ventricle (LV) diastolic vortex in a healthy heart (a) and in a heart with left ventricular volume overload due to a significant patent arterial duct (b). BST images were acquired by zoom on an apical 4-chamber view, including both the interventricular septum and the mitral valve. Position of the vortex was calculated in relation to two lines: (1) a line from the ventricular apex to the mitral valve, and (2) a line from the IVS to the LV free wall. Vortex height was determined by measuring the longitudinal dimension of the main vortex relative to LV length, and vortex width as the horizontal dimension of the vortex relative to LV width. The vortex in (b) has a different size and position (further from the interventricular septum and with a larger area) compared to the healthy counterpart. LA = left atrium; LV = left ventricle; RA = right atrium; RV = right ventricle.
3.2. Right Ventricle Flow Dynamics
BST echocardiography may be applied not only to the study of the left ventricle but also of the right ventricle (RV), which is often stressed by pressure and/or volume overload in children with congenital heart diseases, particularly those with cono-truncal defects [10][20]. Mawad and colleagues [10] compared right ventricular flow dynamics of 57 children with repaired tetralogy of Fallot (rTOF) with severe pulmonary regurgitation, 11 children with large atrial septal defect (ASD), and 25 healthy controls. Right ventricular diastolic energy loss was similar in repaired tetralogy of Fallot and atrial septal defects, but both were greater than in controls. Locations of high energy loss were also similar in children with repaired tetralogy of Fallot and atrial septal defects, at the level of the right ventricle outflow tract in systole, and around the tricuspid valve in early diastole [10]. An additional apical early diastolic area of energy loss was noted in repaired tetralogy of Fallot, corresponding to colliding tricuspid inflow and pulmonary insufficiency [10] (Table 2).
Table 2. Degree and regions of energy loss in healthy children and in those with dilated right ventricles. From Mawad W. et al. [10].
| Diastole | Systole | |
|---|---|---|
| Controls (n = 25) Age: 42 (26–76) mo Weight:15.8 (12.3–23.6) kg |
1.34 (0.55–2.06) (mJ/m) Site: TV |
0.17 (0.10–0.48) (mJ/m) Site: RVOT |
| ASD (n = 11) Age: 66 (33–99) mo Weight: 17.9 (10.5–27.3) kg |
2.86 (1.47–3.65) * (mJ/m) Site: TV |
0.44 (0.29–0.68) (mJ/m) Site: RVOT |
| r-TOF (n = 21) Age: 41 (21–74) mo Weight: 12.2 (10.0–19.5) kg |
1.93 (1.46–2.74) * (mJ/m) Site: TV, Apical (where TR and PR colloid) |
0.29 (0.07–0.51) (mJ/m) Site: RVOT |
ASD = atrial septal defect, PR = pulmonary regurgitation, RVOT = right ventricle outflow tract, r-TOF = repaired tetralogy of Fallot, TR = tricuspid regurgitation, TV = tricuspid valve, p-value < 0.05: * ASD or rTOF versus CTL.
3.3. Summary of the Current Evidence
BST echocardiography may be used for the detection of normal and abnormal vortex formation in the left and right ventricle. Normal, physiological LV vortices are usually smaller than those observed in children with cardiac defects [18]. Data on normal 2D dimensions for LV vortices have been published for neonates and infants (including pre-term neonates) [15][18], while those on RV are still lacking. Data on energy loss [10] and intraventricular pressure [14] may add important additional information to conventional echocardiographic data, but their use is limited to research.
4. BST for a Deeper Understanding of Aortic and Pulmonary Flow Dynamics
BST may be employed as a complementary tool to color Doppler for a better and more intuitive understanding of flow dynamics across the cardiac chamber and main vessels [11][13]. BST may be helpful to understand the turbulence occurring at the level of the main vessel’s due stenosis, the formation of vortex after the stenosis, and their contribution to the post-stenotic dilatation [5][11][13][16][17]. Similarly, BST may be helpful for a deeper understanding of vortex formation and energy loss in heart chambers due to regurgitant flow [16]. Vortices in the stenotic vessels by vector flow imaging were first described by Honda and colleagues in 2014 in a 15-month-old baby with pulmonary stenosis and post-stenotic dilatation [5]. The authors demonstrated that after percutaneous valvuloplasty, the main pulmonary artery diameter, the vortex dimension, and the energy loss all diminish [5]. More recently, BST has been applied for the evaluation of stenotic and regurgitant semilunar valve disease, with a special focus on aortic disease [8][19]. In Figure 2, the researchers provide an example of vortex propagation in a child with pulmonary stenosis after pulmonary valvuloplasty. BST echocardiography has been also applied to study the characteristic of pulmonary artery blood flow in children with pulmonary hypertension [21]. In 18 children < 10 years with pulmonary hypertension [21], the energy loss vector complexity and diastolic vorticity in the main pulmonary artery were significantly higher in both systole and diastole compared to age-matched controls (e.g., systolic energy loss 4.84 vs. 2.42 mW/m; p = 0.01, systolic vorticity 0.21 vs. 0.04, p = 0.003; diastolic energy loss 0.69 vs. 0.14 mW/m; p = 0.01, diastolic vorticity 0.13 vs. 0.05, p = 0.04). Vorticity in the main pulmonary artery (15.2 vs. 4.4 Hz; p = 0.001) was also higher in children with pulmonary hypertension compared with controls [21].
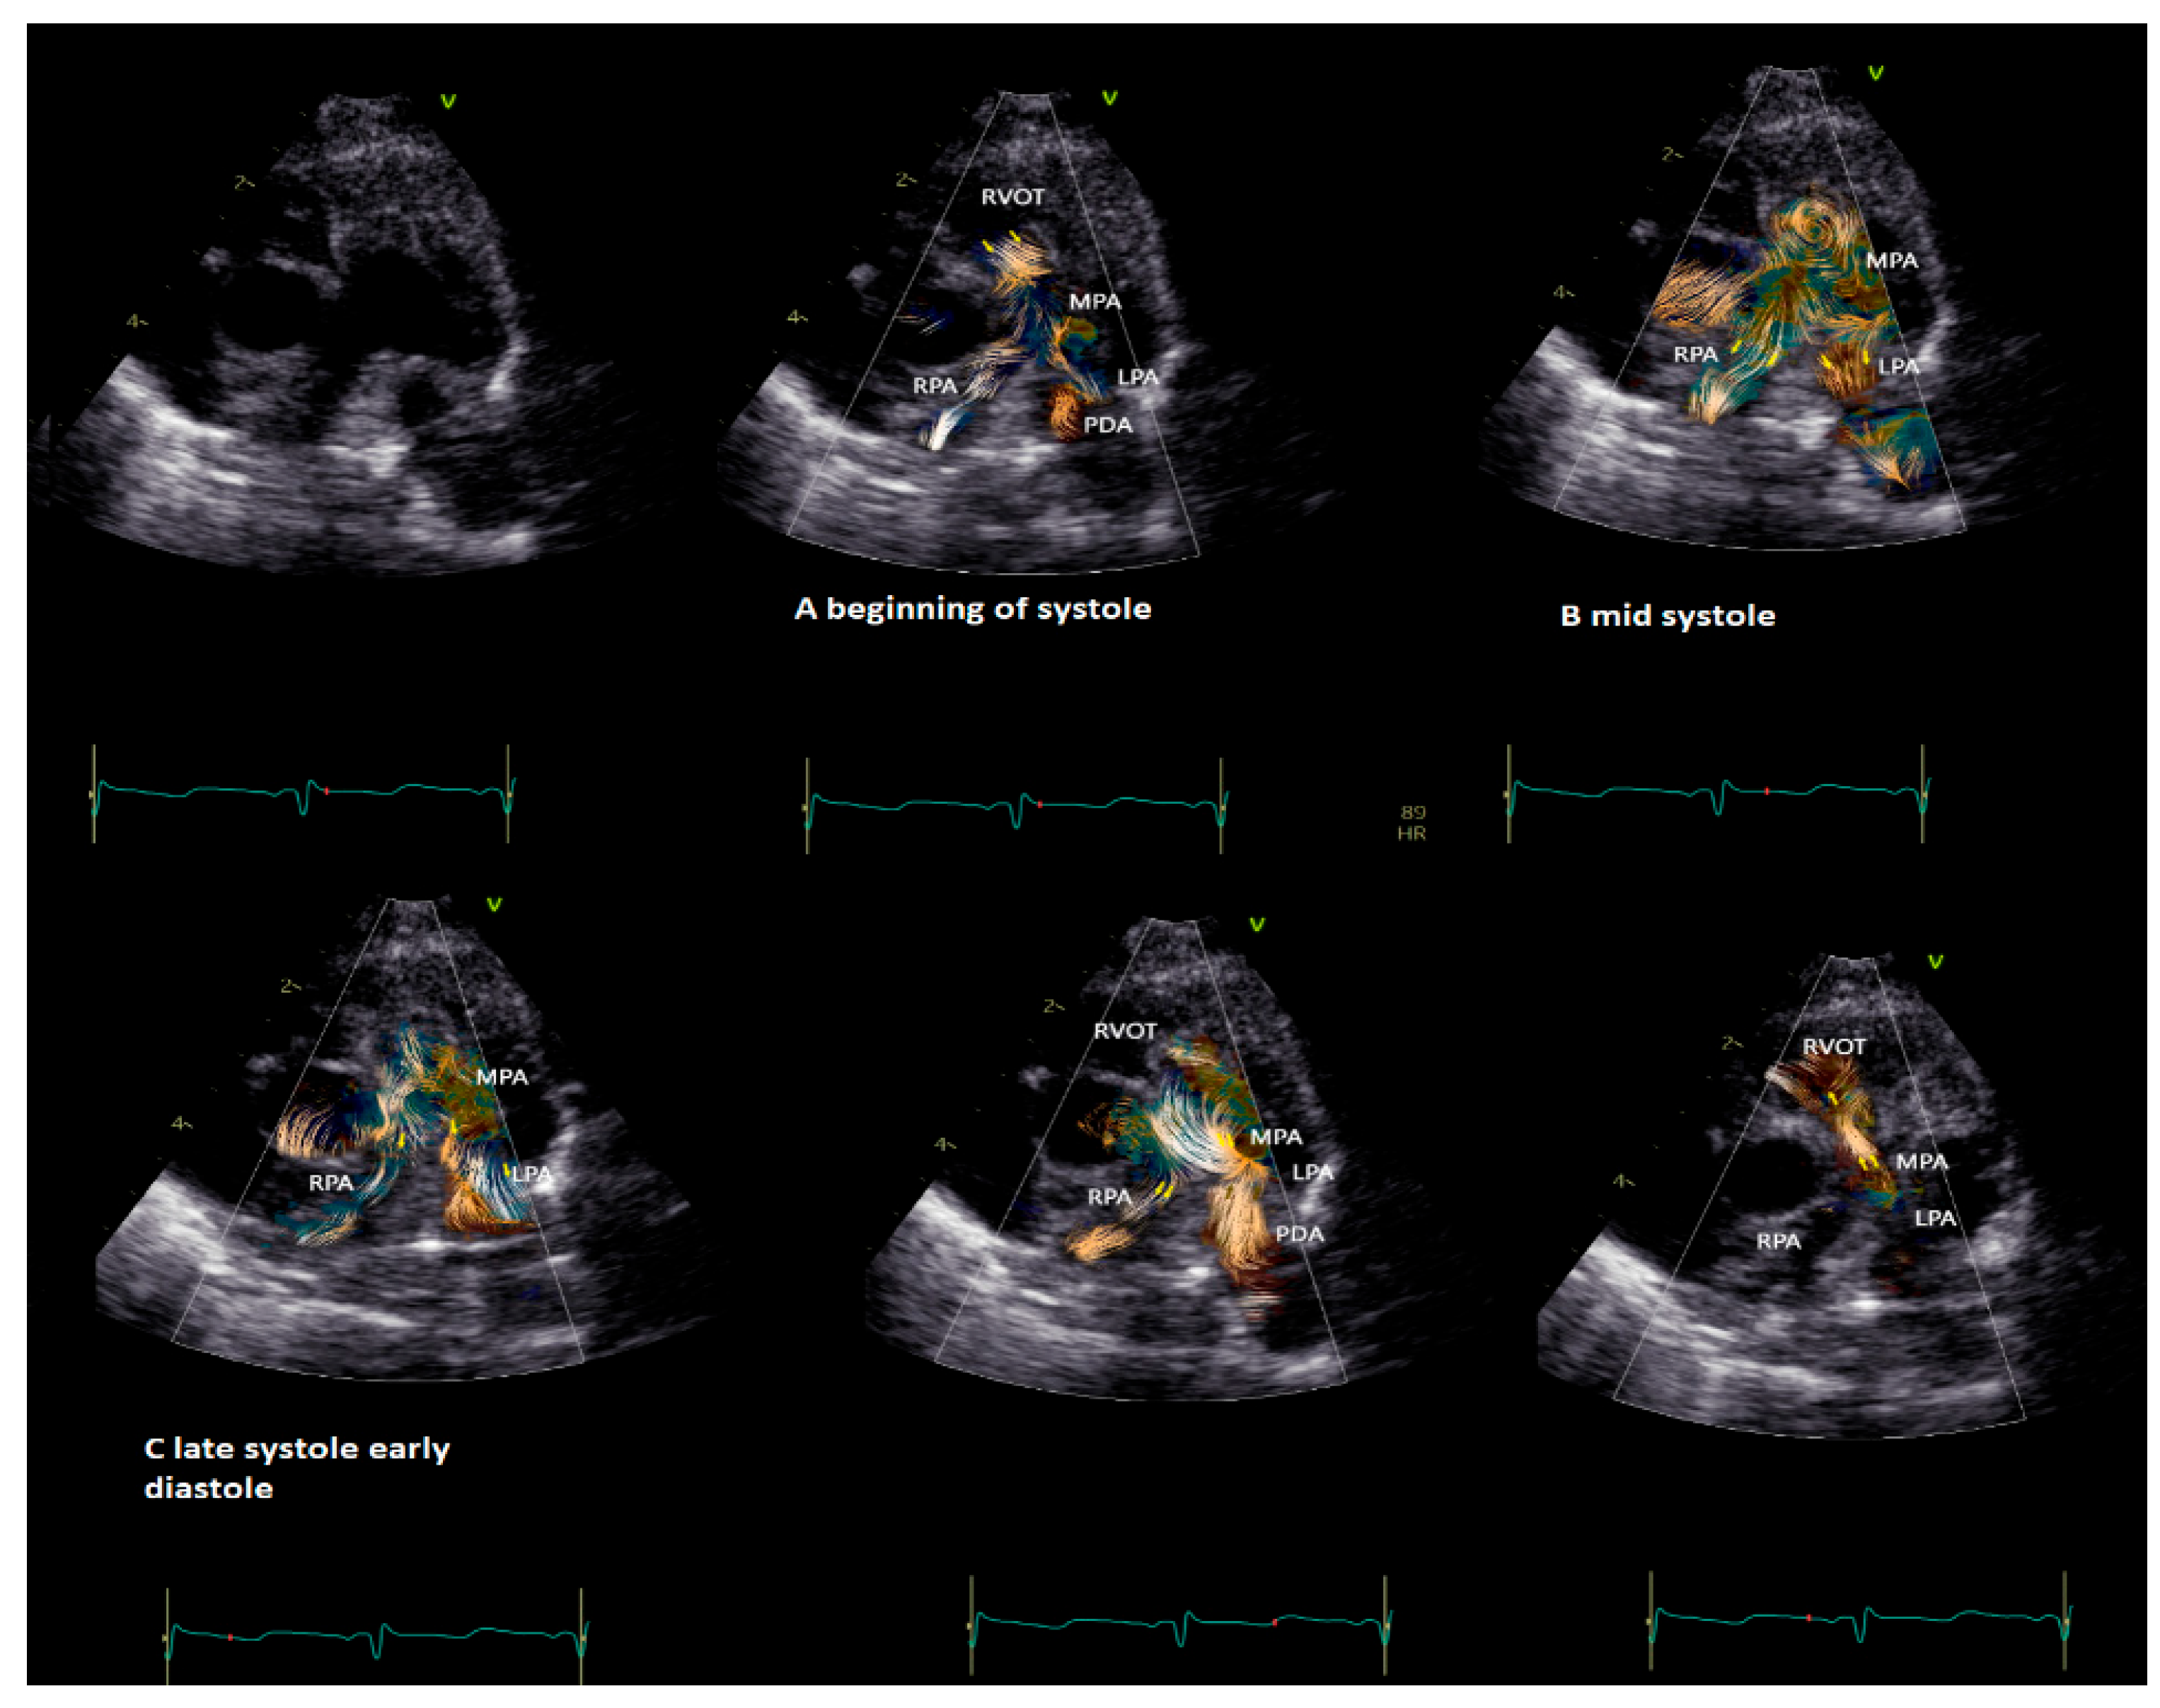
Figure 2. Vortex in the pulmonary valve in a neonate (4.5 kg weight) with pulmonary stenosis after valvuloplasty. The short-axis view shows vortex propagation into the pulmonary arteries during the cardiac cycle. (A) The vortex at the level of the pulmonary valve (beginning of the systole), (B) propagating into the main pulmonary artery (mid-systole) and into (C) pulmonary artery branches (late systole and early diastole). In the last two images, it is possible to observe the flow coming from the patent ductus arteriosus (PDA) that impacts the antegrade pulmonary flow and subsequently the flow coming from the PDA only that directly reaches the RVOT through the insufficiency of the pulmonary valve. The BST movies were acquired at frame rates ranging from 400 to 500 fps in non-sedated infants. Clips of 2 cardiac cycles were stored using medium (66 cm/s), to low (53 cm/s) Nyquist limits.
This entry is adapted from the peer-reviewed paper 10.3390/healthcare12020263
References
- Rose, M.J.; Rigsby, C.K.; Berhane, H.; Bollache, E.; Jarvis, K.; Barker, A.J.; Schnell, S.; Allen, B.D.; Robinson, J.D.; Markl, M. 4-D flow MRI aortic 3-D hemodynamics and wall shear stress remain stable over short-term follow-up in pediatric and young adult patients with bicuspid aortic valve. Pediatr. Radiol. 2019, 49, 57–67.
- Hong, G.R.; Pedrizzetti, G.; Tonti, G.; Li, P.; Wei, Z.; Kim, J.K.; Baweja, A.; Liu, S.; Chung, N.; Houle, H.; et al. Characterization and quantification of vortex flow in the human left ventricle by contrast echocardiography using vector particle image velocimetry. JACC Cardiovasc. Imaging 2008, 1, 705–717.
- Villeman, J.; Baranger, M.K.; Friedberg, C.; Papadacci, A.; Dizeux, A.; Messas, E.; Tanter, M.; Pernot, M.; Mertens, L. Ultrafast Ultrasound Imaging in Pediatric and Adult Cardiology: Techniques, Applications, and Perspectives. JACC Cardiovasc. Imaging 2020, 13, 1771–1791.
- Lampropoulos, K.; Budts, W.; Van de Bruaene, A.; Troost, E.; van Melle, J.P. Visualization of the intracavitary blood flow in systemic ventricles of Fontan patients by contrast echocardiography using particle image velocimetry. Cardiovasc. Ultrasound. 2012, 10, 5.
- Honda, T.; Itatani, K.; Miyaji, K.; Ishii, M. Assessment of the vortex flow in the post-stenotic dilatation above the pulmonary valve stenosis in an infant using echocardiography vector flow mapping. Eur. Heart J. 2014, 35, 306.
- Tang, C.; Zhu, Y.; Zhang, J.; Niu, C.; Liu, D.; Liao, Y.; Zhu, L.; Peng, Q. Analysis of left ventricular fluid dynamics in dilated cardiomyopathy by echocardiographic particle image velocimetry. Echocardiography 2018, 35, 56–63.
- Fadnes, S.; Nyrnes, S.A.; Torp, H.; Lovstakken, L. Shunt flow evaluation in congenital heart disease based on two-dimensional speckle tracking. Ultrasound Med. Biol. 2014, 40, 2379–2391.
- Henry, M.; Fadnes, S.; Løvstakken, L.L.; Mawad, W.; Mertens, L.; Nyrnes, S.A. Flow Dynamics in Children with Bicuspid Aortic Valve: A Blood Speckle Tracking Study. Ultrasound Med. Biol. 2023, 10, 2354–2360.
- Sørensen, K.; Fadnes, S.; Mertens, L.; Henry, M.; Segers, P.; Løvstakken, L.; Nyrnes, S.A. Assessment of Early Diastolic Intraventricular Pressure Difference in Children by Blood Speckle-Tracking Echocardiography. J. Am. Soc. Echocardiogr. 2023, 36, 523–532.e3.
- Mawad, W.; Løvstakken, L.; Fadnes, S.; Grønli, T.; Segers, P.; Mertens, L.; Nyrnes, S.A. Right Ventricular Flow Dynamics in Dilated Right Ventricles: Energy Loss Estimation Based on Blood Speckle Tracking Echocardiography—A Pilot Study in Children. Ultrasound Med. Biol. 2021, 47, 1514–1527.
- Nyrnes, S.A.; Fadnes, S.; Wigen, M.S.; Mertens, L.; Lovstakken, L. Blood Speckle-Tracking Based on High-Frame Rate Ultrasound Imaging in Pediatric Cardiology. J. Am. Soc. Echocardiogr. 2020, 33, 493–503.e5.
- Meyers, B.; Nyce, J.; Zhang, J.; Frank, L.H.; Balaras, E.; Vlachos, P.P.; Loke, Y.H. Intracardiac Flow Analysis of the Right Ventricle in Pediatric Patients with Repaired Tetralogy of Fallot Using a Novel Color Doppler Velocity Reconstruction. J. Am. Soc. Echocardiogr. 2023, 36, 644–653.
- Cantinotti, M.; Marchese, P.; Koestenberger, M.; Giordano, R.; Santoro, G.; Assanta, N.; Kutty, S. Intracardiac flow visualization using high-frame rate blood speckle tracking echocardiography: Illustrations from infants with congenital heart disease. Echocardiography 2021, 38, 707–715.
- Daae, A.S.; Wigen, M.S.; Fadnes, S.; Løvstakken, L.; Støylen, A. Intraventricular Vector Flow Imaging with Blood Speckle Tracking in Adults: Feasibility, Normal Physiology and Mechanisms in Healthy Volunteers. Ultrasound Med Biol. 2021, 47, 3501–3513.
- De Waal, K.; Crendal, E.; Boyle, A. Left ventricular vortex formation in preterm infants assessed by blood speckle imaging. Echocardiography 2019, 36, 1364–1371.
- Borrelli, N.; Avesani, M.; Sabatino, J.; Ibrahim, A.; Josen, M.; Paredes, J.; Di Salvo, G. Blood speckle imaging: A new echocardiographic approach to study fluid dynamics in congenital heart disease. Int. J. Cardiol. 2021, 2, 100079.
- Xu, R.; Hou, M.; Zhou, D.; Liu, Y.; Xie, L.; Zeng, S. Visualizable intracardiac flow pattern in fetuses with congenital heart defect: Pilot study of blood speckle-tracking echocardiography. Ultrasound Obstet Gynecol. 2023, 62, 688–694.
- Marchese, P.; Cantinotti, M.; Van den Eynde, J.; Assanta, N.; Franchi, E.; Pak, V.; Santoro, G.; Koestenberger, M.; Kutty, S. Left ventricular vortex analysis by high-frame rate blood speckle tracking echocardiography in healthy children and in congenital heart disease. Int. J. Cardiol. Heart Vasc. 2021, 37, 100897.
- Cantinotti, M.; Marchese, P.; Scalese, M.; Giordano, R.; Franchi, E.; Assanta, N.; Koestenberger, M.; Barnes, B.T.; Celi, S.; Jani, V.; et al. Characterization of Aortic Flow Patterns by High-Frame-Rate Blood Speckle Tracking Echocardiography in Children. J. Am. Heart Assoc. 2023, 12, e026335.
- Schäfer, M.; Mawad, W. Advanced Imaging Technologies for Assessing Tetralogy of Fallot: Insights into Flow Dynamics. CJC Pediatr. Congenit. Heart Dis. 2023, 2, 380–392.
- Mawad, W.; Fadnes, S.; Løvstakken, L.; Henry, M.; Mertens, L.; Nyrnes, S.A. Pulmonary Hypertension in Children is Associated with Abnormal Flow Patterns in the Main Pulmonary Artery as Demonstrated by Blood Speckle Tracking. CJC Pediatr. Congenit. Heart Dis. 2022, 1, 213–221.
This entry is offline, you can click here to edit this entry!