The disease concept of “dysuricemia” includes hyperuricemia and hypouricemia. Both influence diseases in humans. Uric acid plays dual roles in oxidative stress: it has both an anti-oxidative protective effect and a pro-oxidative and/or a harmful crystal-forming effect. Extensive research on the relationship between the serum urate (SU) level and several common disease risks show characteristic patterns that are broadly classifiable into three patterns: the “gout pattern,” “neurodegenerative disease (ND) pattern,” and “chronic kidney disease (CKD) and cardiovascular disease (CVD) pattern”. In short, “the lower, the better” is incorrect; the ideal is to maintain normouricemia, or an optimal SU level, to reduce the risks of the common diseases associated with dysuricemia.
1. Introduction
Uric acid, which is ionized as urate in serum, tends to be regarded as simply a metabolic waste product since uric acid is the end metabolite of purine bodies in humans [
2,
3]. It has a pathogenic effect on gout flare, caused by the formation of monosodium urate (MSU) crystals after prolonged hyperuricemia, that is, an elevated serum urate (SU) level [
4,
5]. The conventional wisdom tends to be “the lower, the better”, similar to advice on low-density lipoprotein (LDL) cholesterol levels [
6].
However, uric acid is also known to have a dual role in oxidative stress in humans: both an anti-oxidative protective effect and a pro-oxidative and/or a harmful crystal-forming effect [
7]. Indeed, a hereditary disease, renal hypouricemia (RHUC), is sometimes accompanied by exercise-induced acute kidney injury (EIAKI), which is estimated to be caused by not-scavenged oxidative stress [
8].
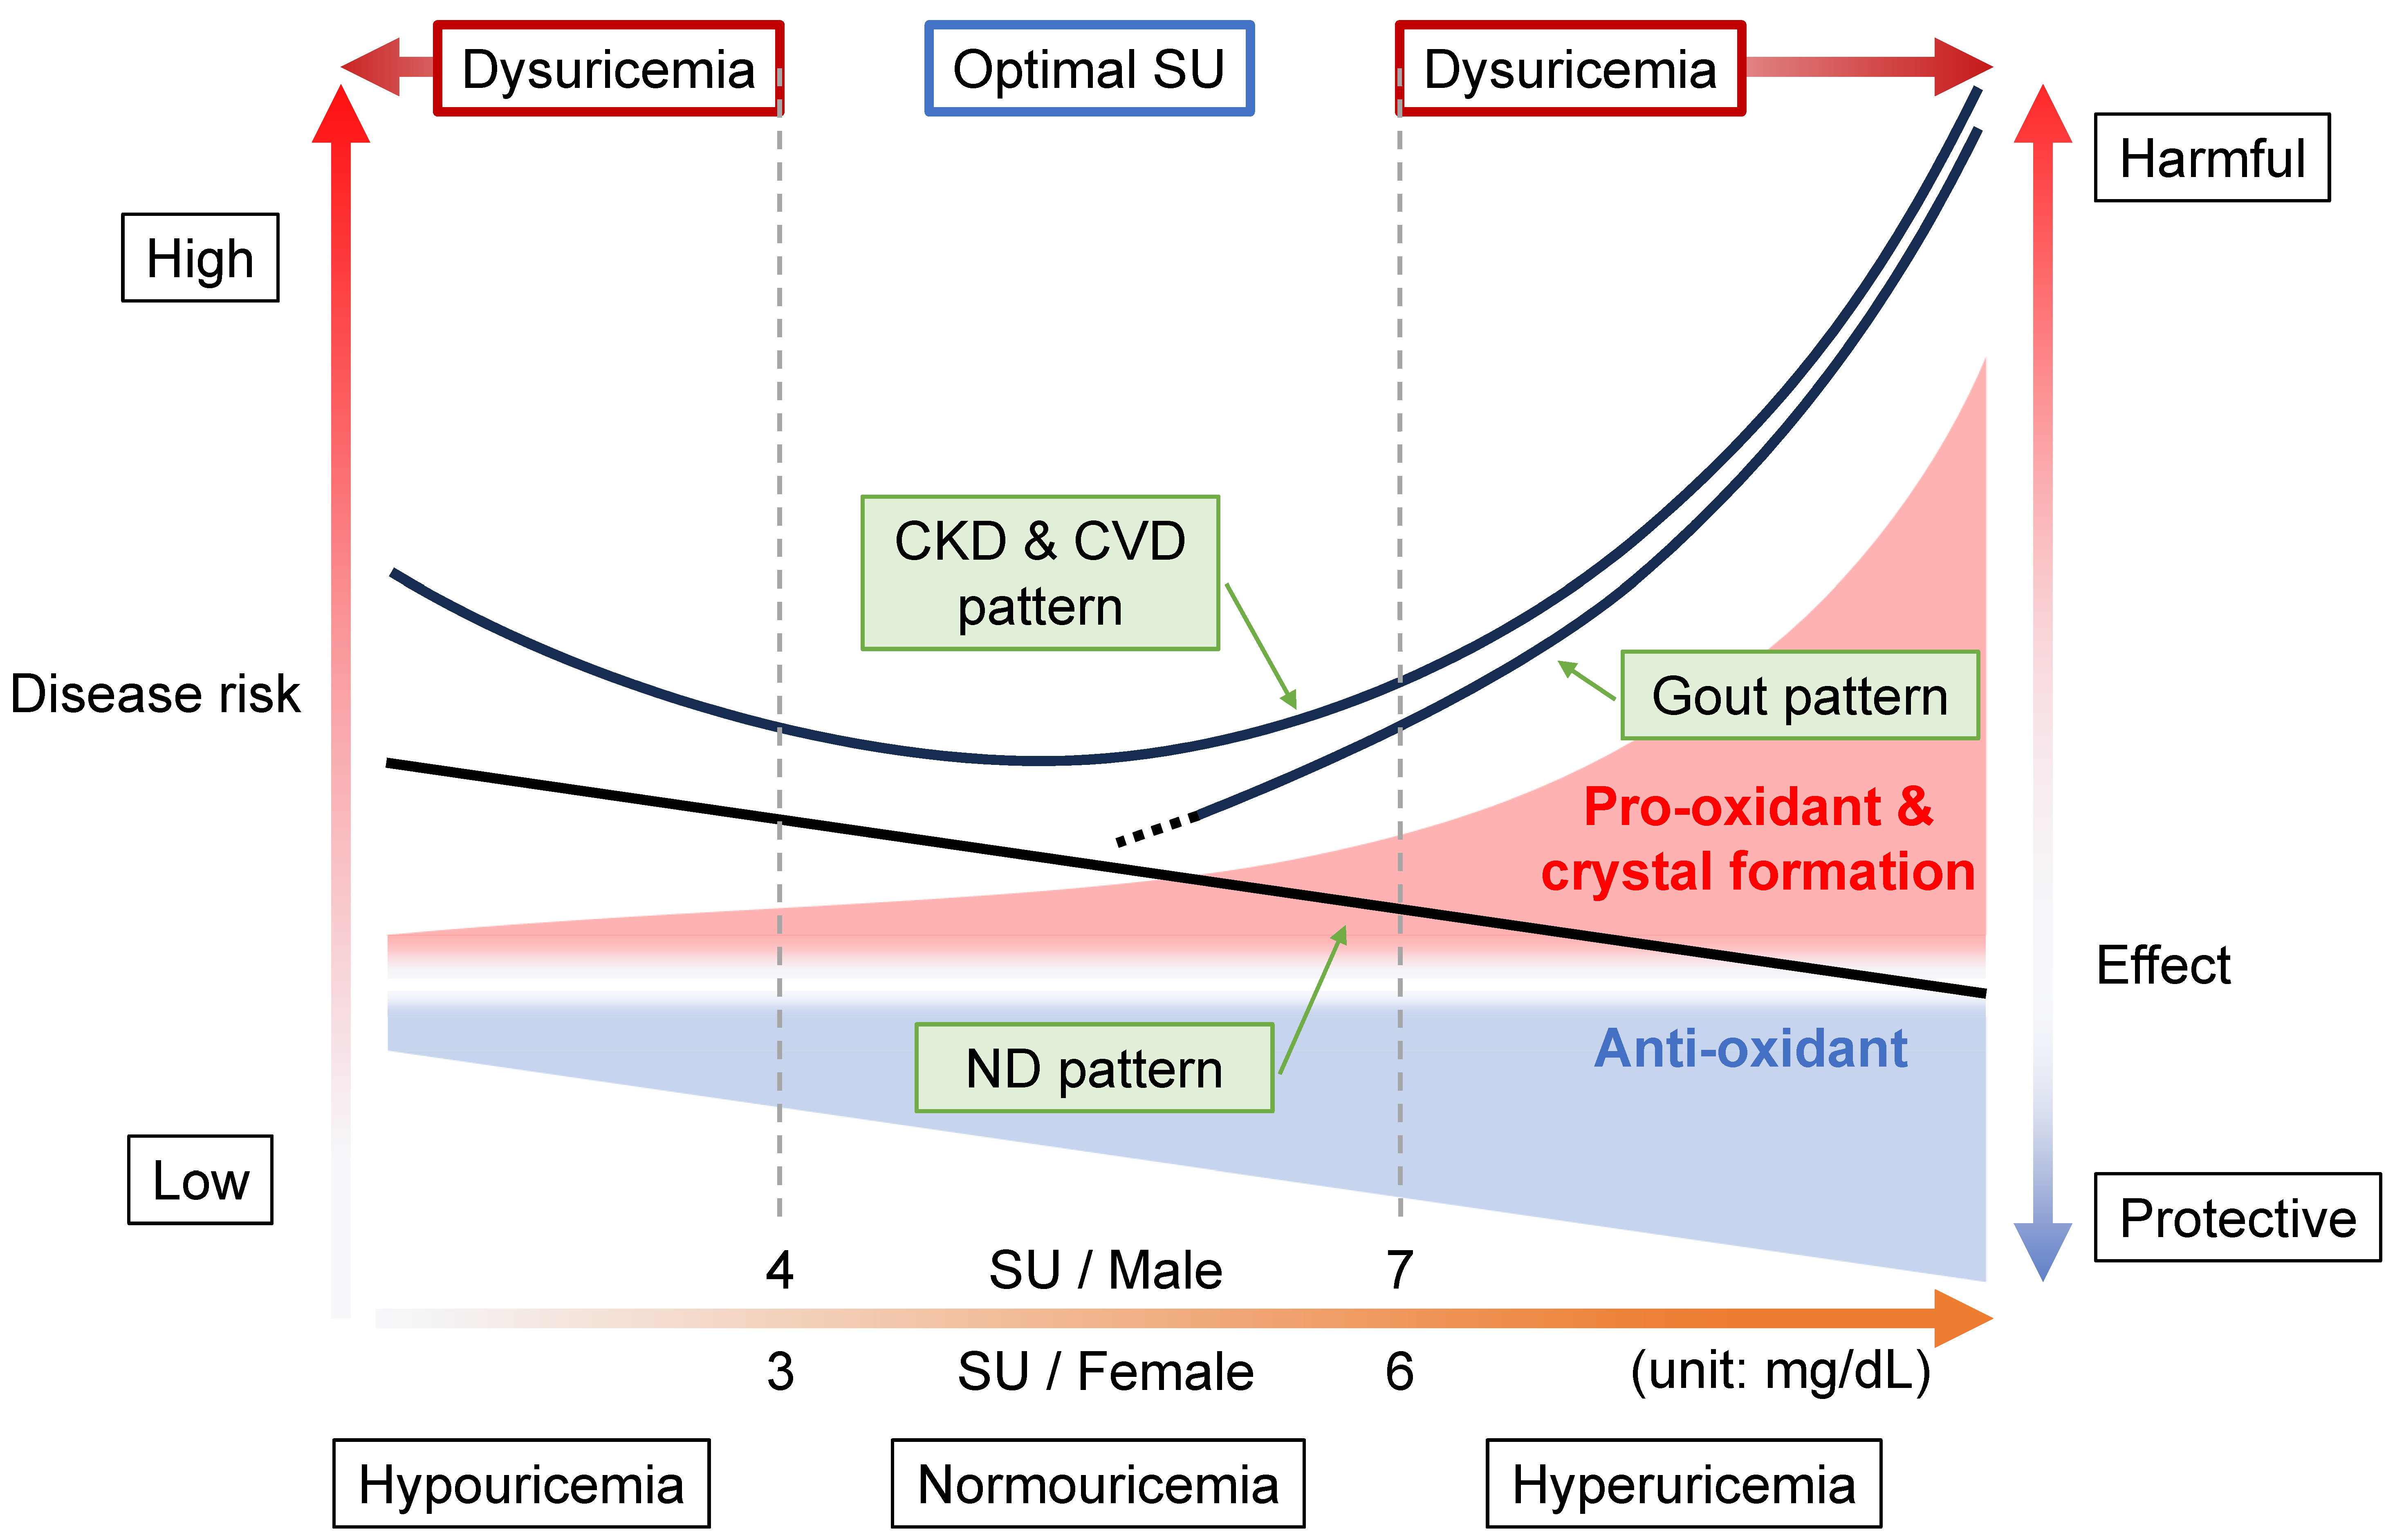
Figure 1 shows why the concept of “dysuricemia”, which consists of hyperuricemia and hypouricemia, is necessary.
SU levels have been epidemiologically proven to be related to several common diseases. Figure 1 is the summary of three patterns of such relationships between SU levels and other diseases: gout pattern, ND pattern, and CKD and CVD pattern.
Figure 1. Disease concept of dysuricemia. The horizontal axis indicates serum urate (SU) level. The vertical axes on the left side and right side, respectively, indicate the disease risks and harmful/protective effect sizes of uric acid (ionized as urate in serum). Because uric acid has a dual role (providing an anti-oxidative protective effect and a pro-oxidative and/or crystal-forming harmful effect), both of these effect sizes increase as a function of rising SU level. The harmful effects increase more steeply with increasing SU level than the increase in protective effect due to the formation of monosodium urate crystals, which are deposited due to the low solubility (6.8 mg/dL, or approximately 400 μmol/L) of urate in human serum. There are three typical patterns of disease risk associated with SU level. In the “gout pattern”, increasing SU results in a higher disease risk of gout due to crystal formation, while neurodegenerative diseases (NDs) such as Parkinson’s disease show the “ND pattern”, indicating a lowered disease risk with rising SU level due to its neuroprotective effects. The risks for chronic kidney disease (CKD) and cardiovascular disease (CVD) generate a J-curve due to the combination of gout and ND patterns, the “CKD & CVD pattern”. As shown here, “dysuricemia” includes both hyperuricemia and hypouricemia. To reduce the burdens of several common diseases, the dual nature of uric acid should be exploited by maintaining normouricemia, with the optimal SU level being 4 < SU ≤ 7 mg/dL (240 < SU ≤ 420 μmol/L) for males and 3 < SU ≤ 6 mg/dL (180 < SU ≤ 360 μmol/L) for females.
2. Relationship between Diseases and Dysuricemia
2.1. Gout Pattern: Crystal Formation and Pro-Oxidative Effects
Diseases showing gout patterns (
Figure 1) cause the formation and deposition of urate crystals. Because gout is caused by MSU crystal formation after prolonged hyperuricemia, the relationship between SU and gout is clearly high in the hyperuricemic area (SU > 7 mg/dL, or 420 μmol/L) [
5], which results from the low solubility (6.8 mg/dL, or 400 μmol/L) of uric acid in human serum [
9]. In other words, the gout pattern will depend upon the physical state of uric acid. This pattern appears to be the basis of the idea of “the lower, the better”, but it is incorrect because there are two more patterns as described below.
2.2. ND Pattern: Anti-Oxidative Effects
In contrast to the gout pattern, the ND pattern (
Figure 1) indicates a relationship of “the higher, the better”, likely due to the anti-oxidative effect of uric acid. NDs such as Alzheimer’s disease (AD) and Parkinson’s disease (PD) are common diseases that can result in dementia. Two nationwide studies, from the U.K. and Taiwan, reported a lower incidence of AD and non-vascular dementia, respectively, in patients with and without gout [
78,
79,
80]. ABCG2 dysfunction indeed hastened gout onset but was also significantly associated with later PD onset [
81]. This report proposed a model in which ABCG2 dysfunction in the blood–brain barrier (BBB) plays an important neuroprotective role against increased urate levels in the central nervous system (CNS), together with higher SU levels due to ABCG2 dysfunction in the kidney and intestine [
81]. In addition to a cohort study with over 18,000 males, which showed that high SU decreased PD risk [
82], meta-analyses report low SU to increase the risk of AD and PD with dementia but not vascular dementia [
83]. Another meta-analysis revealed a significant relationship with a large effect size for lower SU in amyotrophic lateral sclerosis (ALS) patients [
84]. A prospective controlled inception cohort study indicated that gout patients had a lower risk of death due to dementia [
85]. Meta-analyses of cerebral stroke also showed the ND pattern [
86,
87]. Based on these and other data, the European League Against Rheumatism (EULAR) recommended, in its 2016 gout management guideline, not to lower the SU level to <3 mg/dL (<180 μmol/L) continuously for several years [
88].
While these epidemiological reports prove the ND pattern to have neuroprotective effects, not all studies reach this conclusion. For example, three Mendelian randomization (MR) studies, which modeled randomized controlled tests (RCTs) using a genetic approach, did not demonstrate any causality between SU or gout on the susceptibility of PD [
89,
90] or AD [
91], respectively. An RCT of the effect of urate-elevating inosine on early PD progression did not result in a significant difference in the rate of clinical disease progression [
92]. Further research is necessary to elucidate the effects of uric acid on NDs.
2.3. CKD and CVD Pattern: Combination with Gout and ND Patterns
The “CKD & CVD pattern” generates a J-curve or a U-curve (
Figure 1), which indicates “the more normal, the better”. This pattern results from a combination of gout and ND patterns, that is, a balance between crystal formation and the pro- and anti-oxidative effects described above. Vascular-focused common diseases such as CKD and CVD tend to follow this pattern, probably because the xanthine oxidoreductase (XOR) function as described below has effects on and around the vascular endothelium: (1) XOR produces reactive oxygen species (ROSs) as a pro-oxidant (
Figure 2); (2) uric acid reduces ROSs, acting as an anti-oxidant (
Figure 2); (3) the nitrite reductase activity of XOR generates nitric oxide (NO), which contributes to vasodilation and regulation of blood pressure [
7]; (4) the NADH oxidase activity of XOR produces ROSs [
7]; and (5) urate crystals can be deposited in blood vessels, possibly acting as a component of atherosclerotic plaque [
93]. There are, however, some inconsistent reports on the harmful effects on the vascular system via xanthine oxidase (XO), which produces ROSs. For example, Kusano et al. [
94] produced xanthine dehydrogenase (XDH)-stable and XO-locked knock-in mice and found no noticeable difference in survival rates between XOR mutant mice and wild-type mice. Further studies will be needed on this point.
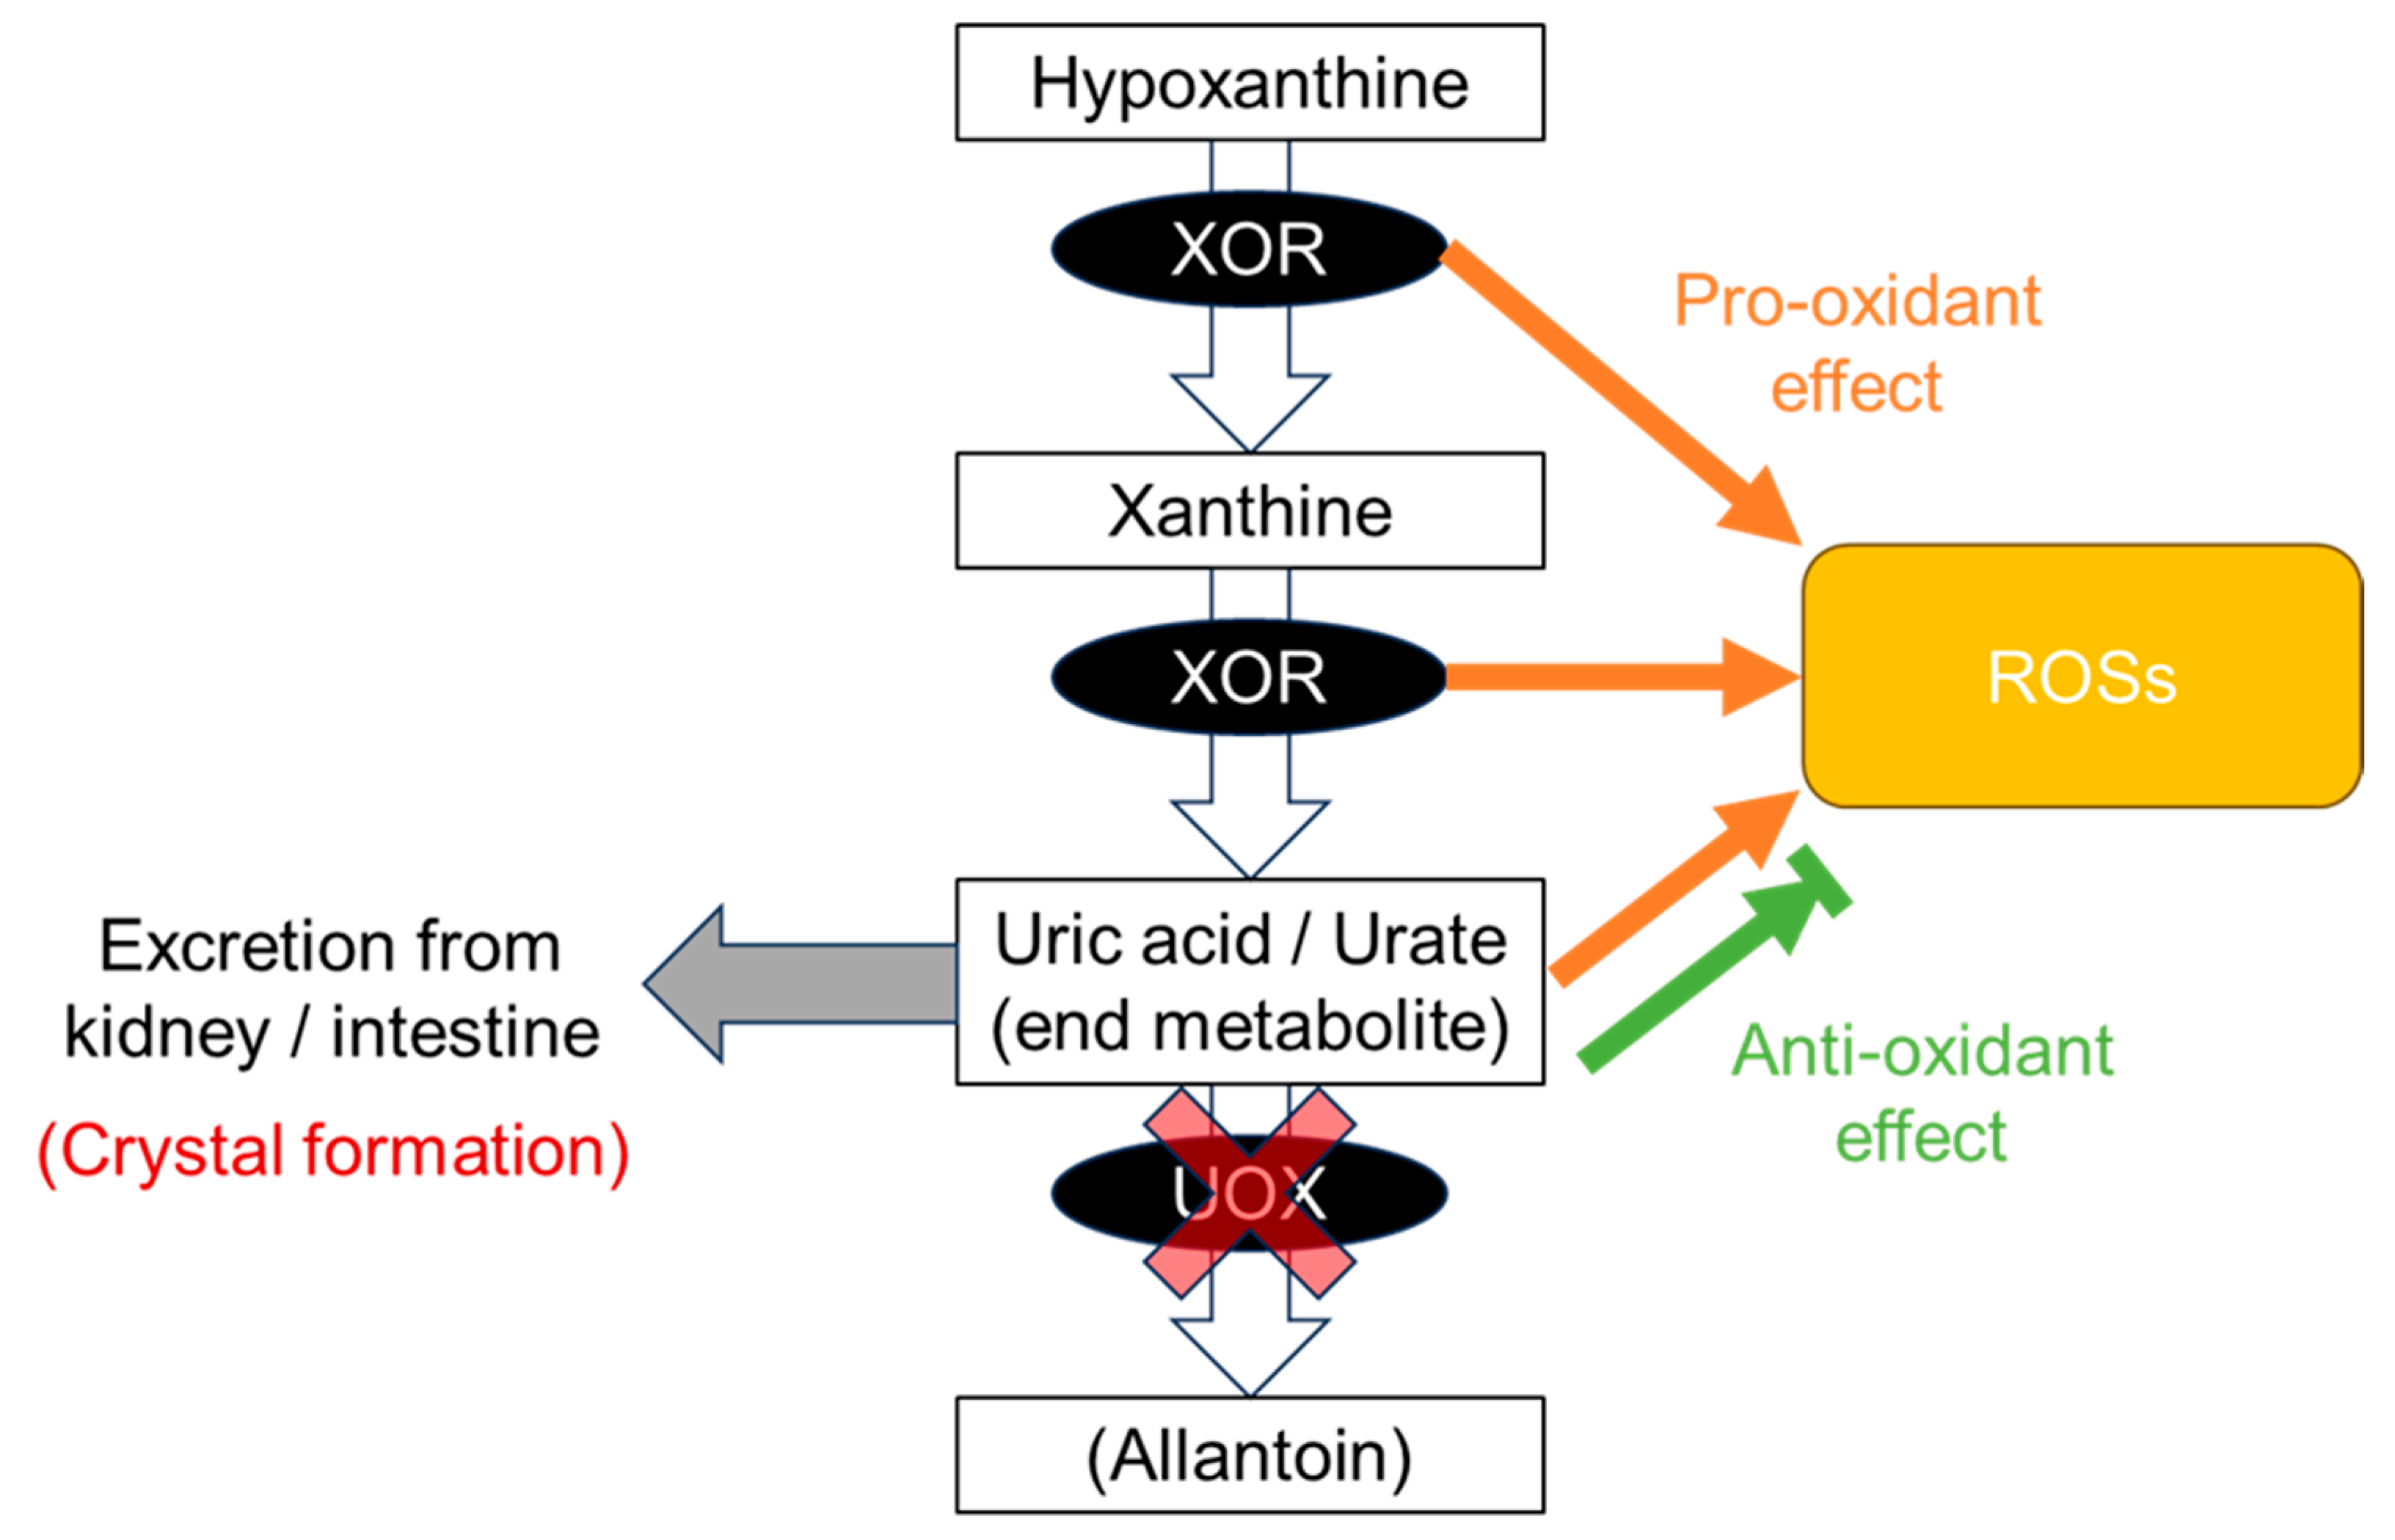
Figure 2. Production of uric acid. At the end of the purine metabolic pathway, uric acid is produced from hypoxanthine and xanthine by xanthine oxidoreductase (XOR). Uric acid is an end product in humans due to a defect in urate oxidase (UOX) and is excreted from the kidney and intestine. Along this pathway, XOR produces reactive oxygen species (ROSs) as a pro-oxidative effect. Uric acid has both anti-oxidative and pro-oxidative effects against ROS. Slightly soluble uric acid, which has low solubility in human serum, occasionally forms crystals before being excreted from the body.
Nevertheless, Nardi et al. [
93] also revealed the increasing risk of cerebrovascular events with rising SU levels, suggesting that the deposition of urate crystals in carotid plaques could participate in the mechanism of stroke. Indeed, Konta et al. [
95] reported all- and CVD-caused mortality to show a J-shaped association with SU level using a Japanese nationwide database of 500,511 subjects, followed up for seven years. J-curve results were also obtained from the PIUMA Study of 1720 CVD patients with hypertension [
96] and from a nationwide community-based cohort study of 2081 nonfatal strokes in 155,322 subjects [
97]. Nakayama et al. [
98] identified both high and low SU levels as risk factors for CKD incidence in a sample of 138,511 middle-aged men and women. Kuwabara et al. also showed hypouricemia to be associated with a history of kidney disease in males, using 90,143 Japanese outpatients [
99].
The CKD and CVD pattern might be predictive of mortality. With a South Korean cohort of 375,163, Cho et al. found a U-shaped association between all-, CVD-, and cancer mortality [
100]. In addition to these mortalities, Hu et al. also revealed a similar association in respiratory-disease mortality from 9118 U.S. adults in the National Health and Nutrition Examination Survey (NHANES) dataset [
101]. Hyperuricemia is reportedly a risk factor for cardiovascular and all-cause mortality in addition to kidney dysfunction in patients at cardiovascular risk [
102], suggesting that CKD, together with hyperuricemia, might raise the risk of CVD progression.
It is of interest that a U-shape was also generated for COVID-19 severity, i.e., the risks inherent in invasive mechanical ventilation, in 1523 Japanese patients [
103]. However, MR studies revealed the causality of SU and gout on COVID-19 in the Japanese population but not in Europeans, suggesting a difference in genetic backgrounds between these ancestries [
104]. Further analyses will be necessary.
2.4. Range of Normouricemia as Optimal SU Level
Considering these patterns above, how should we range normouricemia or “optimal SU”? From the viewpoint of “gout pattern”, the definition of hyperuricemia is set at SU of >7.0 and >6.8 mg/dL (>420 and >400 μmol/L), irrespective of gender in the Japanese [
63] and American College of Rheumatology (ACR) [
105] guidelines, respectively, due to the low solubility (6.8 mg/dL, or 400 μmol/L) of uric acid in human serum [
9]. From the “ND pattern”, maintaining SU at ≥3 mg/dL (≥180 μmol/L) would be better, as EULAR recommends [
88]. Research on the “CKD & CVD pattern” [
95,
96,
97,
98,
100,
101] indicates that the SU range at the lowest disease risks depended on sex and was estimated to be approximately 4–7 mg/dL (240–420 μmol/L) for males and 3–6 mg/dL (180–360 μmol/L) for females, although set SU ranges differed in each study and were impossible to integrate. Furthermore, the RHUC guidelines strongly recommend that individuals with an SU of ≤2.0 mg/dL (120 μmol/L) should be considered to have RHUC from epidemiological evidence [
8], and an additional genetic and epidemiological report [
26] suggests that males and females with SU of ≤3.0 and ≤2.0 mg/dL (≤180 μmol/L and ≤ 120 μmol/L), respectively, should be considered to have RHUC.
Taken together, scholars propose that 4 < SU ≤ 7 mg/dL (240 < SU ≤ 420 μmol/L) for males and 3 < SU ≤ 6 mg/dL (180 < SU ≤ 360 μmol/L) for females should be regarded as normouricemia, or optimal SU, to take best advantage of both the roles played by uric acid (Figure 1).
This entry is adapted from the peer-reviewed paper 10.3390/biomedicines11123169