Your browser does not fully support modern features. Please upgrade for a smoother experience.
Please note this is an old version of this entry, which may differ significantly from the current revision.
Subjects:
Regional & Urban Planning
The ever-increasing use of motor vehicles causes a number of traffic safety and community issues, which are particularly severe in cities, accompanied by a scarcity of parking spaces and challenges encountered in road layout alteration projects. The commonly applied solutions include the designation of through streets, the implementation of on-street parking on residential streets, and retrofitted traffic calming measures (TCMs).
- pedestrian refuges
- refuge islands
- reduce speed
- traffic calming measures
1. Speed-Reducing Effect of Horizontal Deflections Located on the Refuge Island Approach Sections
The efficacy of various TCMs used on city streets, i.e., their slowing effect, has been studied by many researchers. In most cases, these studies analyse TCMs in relation to traffic safety improvement [17,18,19,20]. The article by Le et al. [12] is different in this respect in that it also considers the environmental and public health impacts of the analysed TCMs.—the study involved in situ tests conducted using a special test vehicle. Le et al. [12] used a comparative analysis technique to demonstrate the superiority of chicanes among the analysed TCMs, except in terms of vehicle emissions. That said, most studies are limited to analysing the efficacy of speed humps, speed tables, and chicanes in terms of speed reduction on the approach to pedestrian crossings. Some authors took into account landscape features and visibility of the pedestrian crossing and the road ahead, relating the obtained speed reduction not only to the TCMs but also to various factors of the townscape surrounding the refuge island [21,22]. For example, Balant and Lep [22] analysed the improvement in community life thanks to the implemented traffic calming scheme. Other researchers noted the slowing effect of repeating the speed humps or speed tables and the length of slowed driving [23,24,25,26,27].
The efficacy of various TCMs was analysed, for example, by Gonzalo-Orden et al. [28]. They compared through comparative analyses the speed reductions obtained with the applied raised crossings, lane narrowings or chokers, speed cameras, and speed camera signs. These analyses led to the conclusion that the obtained speed reductions depended on the TCM type, its geometric features, and emplacement in the street. Distefano & Leonardii [29,30] arrived at similar conclusions on the efficacy of chicanes and horizontal deflections in city streets. They compared speed profiles (85th percentile and average values) on local streets before and after installation of speed tables and up to 1 m wide chicanes on a one-way street and road narrowing treatment accompanied by a horizontal deflection on a two-way street. The before-and-after study results presented by Distefano & Leonardi [29] show the highest percentage reduction of operating speed for a single-lane chicane installed on a narrow one-way street with an on-street parallel parking configuration. The lowest percentage reduction was, in turn, noted on a two-way street with a carriageway narrowing treatment on one side, accompanied by a horizontal deflection (with parallel on-street and pavement parking). In this case, very good visibility of the road past the narrowing treatment was ensured. Kruszyna & Matczuk-Pisarek [31] arrived at different conclusions in their study on speed reduction obtained with a refuge island, speed table on the approach section, or a raised pedestrian crossing. The comparative analyses showed that raised pedestrian crossings offered the highest speed reductions. Sołowczuk [32] studied speed reductions obtained with raised pedestrian crossings in a downtown Tempo 30 zone, relating the obtained values not only to the TCM geometry and the townscape surrounding the street but also to the specific traffic volume in a given street.
Akgol et al. [33] and Aydin et al. [34] conducted a driving simulator study to investigate the effect of chicanes installed near pedestrian crossings. The factors they considered in their study included the effective lane width, the shapes of islands, and vehicle trajectories. In conclusion [33], it is stated that effective speed reduction may be obtained with a set of three chicanes located at the refuge island on streets with a 3-m effective lane width or with a more economical option of two chicanes on streets with a 2.7-m effective lane width. Hussain et al. also used a driving simulator, yet with a different approach, as presented in their article [35] investigating the effect of roadway narrowing, horizontal deflection, and various road markings and upright signs. These studies confirmed the highest efficacy of road narrowing used in combination with horizontal deflection and carriageway narrowing obtained by zigzag markings or variable message signs.
The first study that related speed reduction to the travel path deflection by a median island or chicanes was conducted in the UK by Sayer and Parry [36,37]. In the test track trials, the test vehicles navigated through artificially simulated horizontal deflection and chicanes. Experienced drivers were employed for these trials. The output of the study confirmed that the primary speed reduction factors were the stagger length, free view through the chicane, deflected path angle, and the visual obstruction type (Figure 1). In this study, the free view width “a” had a positive value if the median island between opposing lanes allowed the driver to see the travel lane behind it at the road surface level. If, on the contrary, the driver approaching the island could not see the whole lane width at the road surface level past the island, “a” acquired a negative value. The wider the median island, and thus, the less of the travel lane at the road surface level was visible to the driver, the greater the obtained speed reduction. These findings were confirmed by Zhang et. al. [38], who, in addition, investigated reductions in noise and vehicle emissions.
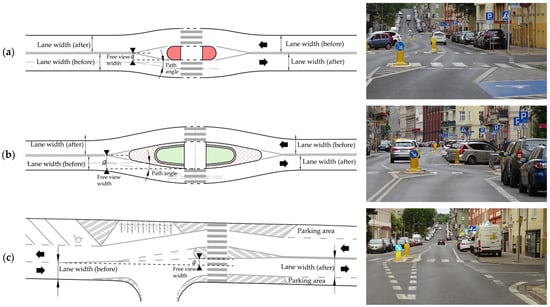
Figure 1. Free view and path angle illustration: (a) “a”—small; (b) “a”—larger; (c) “a” +.
Figure 2 compares the calculated 85th percentile and mean speeds noted just before the pedestrian crossing or chicane. Figure 2 shows a high degree of inconsistent data obtained by different researchers due to different locations (test tracks, transition zone, village centre, suburban two-lane, single-carriageway streets) and data selection. As regards the data selection, the researchers chose to analyse free traffic flow only or use the steady traffic flow data with varying hourly volumes and separately the free traffic flow data.
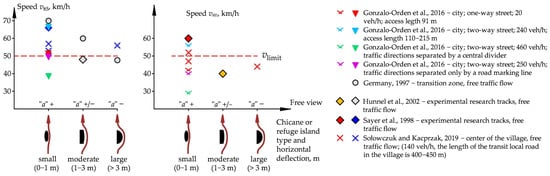
Figure 2. Comparison of v85 and vav values ahead of a refuge island or median island in different locations.
2. Previous Before-And-After Speed Studies with the Use of the Heuristic Method
Heuristic methods are used in management analyses when dealing with complex situations and lots of information. They allow us to assess the efficacy of the analysed parameters based on the established determinants. The principles of this method were described by different scholars, including Juran (first edition in 1951) [41,42,43] and Deming [44] (first edition in 1982), and were elaborated by Kaoru Ishikawa, who proposed seven basic quality tools for the Total Quality Management (TQM) system [45,46,47] and their researchers [48,49,50,51,52,53]. Quality management principles may be used successfully for assessments of other issues, including road maintenance [54,55], road operating speed management [56,57,58,59,60], or very specific applications, such as analysing fluid velocity variations in medical equipment [61]. The seven tools developed by Kaoru Ishikawa [45,46,47] are:
-
flow chart presenting the steps of the analysis,
-
check sheet, specifically statistical tests to check speed consistency among the consecutive survey sites deployed on the street under analysis,
-
normal distribution histograms,
-
scatter diagram showing relationships,
-
control chart showing speed changes along the analysed street,
-
cause-and-effect diagram (diagram fishbone diagram or Ishikawa diagram) for defining the primary and secondary factors,
-
Pareto chart to define the final identified speed reduction determinants.
These allow the determination of factors that contributed to attaining the final effect in consideration.
In traffic speed studies, the heuristic method allows us to estimate the influence of the different determinants on the final operating speed reduced by various treatments, including TCMs. The abovementioned seven tools of the heuristic method to assess the efficacy of different TCMs implemented in the analysed downtown street section.
This entry is adapted from the peer-reviewed paper 10.3390/su152115265
This entry is offline, you can click here to edit this entry!