Your browser does not fully support modern features. Please upgrade for a smoother experience.
Please note this is an old version of this entry, which may differ significantly from the current revision.
Plantar vein thrombosis is a venous disorder affecting deep plantar veins that can manifest with non-specific localized pain, plantar foot pain, swelling, and sensation of fullness. Plantar veins are not routinely assessed during sonographic scans for deep venous thrombosis, which makes plantar venous thrombosis a commonly missed diagnosis.
- thrombophlebitis
- deep venous thrombosis
- foot pain
- MRI
- Doppler
- DVT
- metatarsalgia
1. Imaging Evaluation
The most common imaging method used to evaluate deep venous thrombosis (DVT) is ultrasound (US), and this may be applied to plantar vein thrombosis (PVT) as well. Regarding PVT, in general, the scanning protocols for thrombosis of lower limbs are limited to the distal leg and do not extend to the foot [1][2]. Thomas and O’Dwyer recommend the inclusion of at least one view of the foot veins in a standard phlebogram in patients with suspicion for DVT or pulmonary embolism [3]. Findings with US are similar to that of a DVT in other segments, including loss of venous compressibility, venous dilatation, lack of flow on Doppler study, and intraluminal content leading to filling defects (Figure 1, Figure 2 and Figure 3) [1][2][4][5].
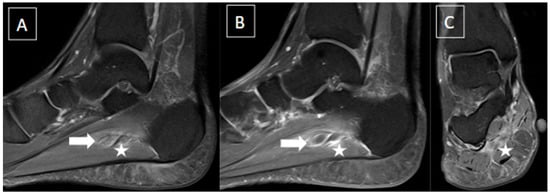
Figure 1. 48-year-old female presenting with pain in the plantar aspect of the right ankle for 4 days. Ankle MR images in sagittal T2 fat-suppressed (A), post-gadolinium T1 fat-suppressed (B), and coronal T2 fat-suppressed (C) demonstrate thrombosis of the lateral plantar vein, characterized by venous enlargement with intraluminal thrombus (arrow in (A)), venous filling defect (arrow in (B)), and perivascular soft tissue edema and enhancement (stars from (A) to (C)).
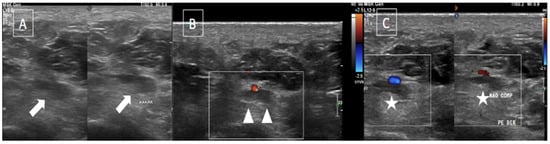
Figure 2. The same patient from Figure 1 underwent an ultrasound with color Doppler showing enlargement of the lateral plantar vein due to an internal thrombus (arrows in (A)) and absence of flow on Doppler assessment (arrowheads in (B)) associated with loss of compressibility (stars in (C)).
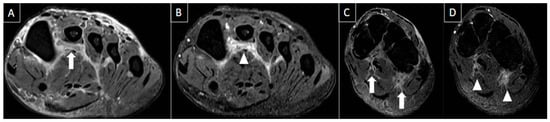
Figure 3. 50-year-old female patient with a history of pain in the foot for 12 days. MR images of the forefoot in the short axis (T2 weighted fat-suppressed short axis in (A,C) and T1 fat-suppressed post-gadolinium short axis in (B,D)) show acute thrombosis of the plantar venous arch and medial and lateral plantar veins, with perivascular edema (arrows in (A,C)) and perivascular enhancement and venous filling defects (arrowhead in (B,D)).
2. Differential Diagnosis
There are numerous differential diagnoses for foot pain, as clinical findings are often nonspecific, with complaints sometimes being broad and vague, or even in locations where other conditions are more common. These include plantar fasciitis, plantar fibromatosis, tendon pathologies, ganglion/synovial cysts, crystal deposition disease, Baxter neuropathy, Morton’s neuroma, intermetatarsal bursitis, sesamoiditis, plantar plate injuries, and metatarsal stress fractures [4][6]. In fact, commonly, the possibility of PVT diagnosis is not raised due to lack of awareness and familiarity with the entity, and this is reflected clinically and in the literature [7].
Metatarsalgia diagnostic reasoning, strategy, and subsequent management involve a series of clinical steps to arrive at the cause and the appropriate treatment [8]. Due to its lower frequency, PVT is often not included among the differentials for foot pain. And considering that PVT can occur in basically any region of the foot, depending on where it is located, it has the potential to simulate various causes of foot pain. Thus, differential diagnoses are related to surrounding anatomical structures. For example, thrombosis of the lateral plantar vein may simulate plantar fasciitis and peroneal tendinopathy. Medial plantar vein thrombosis, on the other hand, may mimic posterior tibial tendinopathy. Thrombosis affecting the plantar venous arch, metatarsal veins and digital veins can have similarities with metatarsal stress fracture, Morton’s neuroma, intermetatarsal bursitis and sesamoiditis.
2.1. Intermetatarsal Bursitis
Intermetatarsal bursitis is a common cause of metatarsalgia and frequently associated with Morton’s neuroma and plantar plate tears. It is characterized by fluid distension of the bursa between the metatarsal heads. Bursal distension smaller than 3 mm in the transverse diameter may be physiological and not clinically relevant [9].
Ultrasound findings in acute bursitis include a thin-walled bursa distended with hypoechoic fluid and peribursal hyperemia. In chronic bursitis, a thickened bursal wall, synovial proliferation, more echogenic content, and intra-bursal hyperemia can be present. Sometimes, chronic intermetatarsal bursitis can simulate soft tissue mass or abscess if marked synovial thickening is seen. On MRI, intermetatarsal bursitis is hypointense on T1-weighted and hyperintense on T2-weighted fat-suppressed sequences. Peripheral enhancement may be seen with gadolinium administration [7]. Figure 4 exemplifies a case of intermetatarsal bursitis.
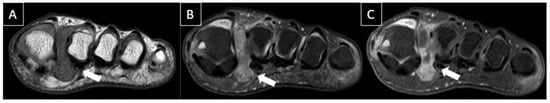
Figure 4. 44-year-old female patient with history of rheumatoid arthritis and chronic pain in the left foot. T1-weighted (A) and T2-weighted fat-suppressed (B) and T1-weighted post-gadolinium (C) MR images of the forefoot in the short axis show intermetatarsal bursitis of the 1st interdigital space (arrows), abutting to the plantar fat pad.
2.2. Morton’s Neuroma
Morton’s neuromas are focal areas of symptomatic perineural fibrosis around the plantar digital nerve of the foot. It does not represent a true neuroma [9], and the most accepted hypothesis is thought to be related to chronic entrapment of the nerve by the intermetatarsal ligament [10], leading to perineural fibrosis [11]. They occur more often in middle-aged women [11]. The third intermetatarsal space is the most affected site, followed by the second intermetatarsal space, and the remaining spaces are rarely involved. Larger lesions (>5 mm) tend to be more symptomatic [9].
Ultrasound findings include well-defined ovoid mass with variable echogenicity and continuity with the interdigital nerve in the long axis. The mass can be tender and mobile when compressed, with vascularity on power Doppler [7]. The sonographic Mulder sign can be used to increase diagnostic accuracy, with compression of the metatarsal heads leading to exposure of the neuroma and a possible click felt by the examiner [12].
MRI findings include an ovoid or teardrop-shaped mass in the plantar aspect of the intermetatarsal space, located inferiorly to the intermetatarsal ligament, that is most clearly visualized in the prone position [11]. The mass is generally hypointense to isointense on T1-weighted images and hypointense to hyperintense on T2-weighted fat-suppressed images. Signal intensity can vary according to the degree and maturity of the fibrosis. Post-contrast images can improve the visualization of the neuroma, which can enhance variably, with most demonstrating little to no enhancement [7]. When enhancement is present, it is generally due to the enhancement of the bursal tissue surrounding the neuroma [7]. The decision to inject the contrast medium for this diagnosis is controversial [13]. Figure 5 illustrates a case of Morton’s neuroma.
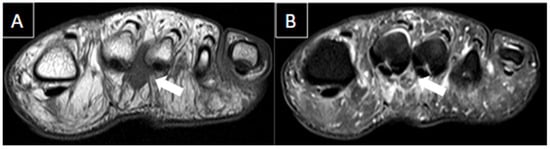
Figure 5. 56-year-old female patient with a 6-month history of pain. Short axis T1-weighted (A) and T2 fat-suppressed (B) MR images show Morton’s neuroma in the plantar aspect of the 2nd intermetatarsal space (arrows).
2.3. Sesamoiditis
Sesamoiditis is a painful mechanical-related inflammatory condition involving the sesamoid bone caused by repetitive injury to the plantar aspect of the forefoot, with this term being used almost exclusively for the hallux sesamoid. It may manifest as an acute entity presenting with bone marrow edema of the sesamoid, while in chronic phase, it will show volumetric decrease and sclerosis. Medial sesamoids are more commonly injured than the lateral [14]. Other conditions affecting the hallux sesamoids are osteonecrosis and trauma, the latter leading to sesamoiditis, acute fracture, or diastasis of a bipartite sesamoid [14]. Figure 6 illustrates a case of sesamoiditis of the forefoot.
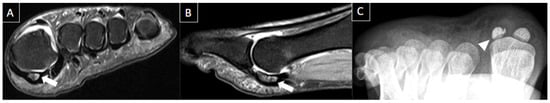
Figure 6. 30-year-old female patient with pain in left foot for one month. Short axis T2-weighted fat-suppressed (A) and sagittal T2-weighted fat-suppressed (B) MR images and axial sesamoid radiographic views (C) present bone edema of the medial sesamoid on MRI (arrows) and irregular and sclerotic appearance of the lateral sesamoid with reduced dimensions (arrowheads). Findings are consistent with sesamoiditis.
2.4. Plantar Fasciitis
The plantar fascia is a thick band of connective tissue that originates in the medial tubercle of the calcaneus and inserts in three different places in the forefoot, thus creating three distinct bands: medial, central, and lateral [15].
Plantar fasciitis (PF) is the most common cause of unilateral heel pain [2] and refers to the inflammation of the fascia of the foot. On ultrasound, PF appears as thickening and hypoechogenicity of its fibers. MRI is considered the most sensitive imaging modality for diagnosing PF [16], characterizing the exact location and the extent of alterations.
Ultrasound is reliable and accurate to assess the plantar fascia, and the longitudinal scan is the best plane for imaging [17]. Ultrasound findings include thickening greater than 4.5 mm (the most useful sign), hypoechogenicity of the plantar fascia, and loss of normal fibrillar reflective echotexture. Increased stiffness on elastography has been reported [18]. A plantar calcaneal spur is commonly seen deep to the proximal fascia [17].
MRI findings of plantar fasciitis include hypointense or isointense fascial thickening at its calcaneal insertion on T1-weighted images, with its thickness greater than 4.5 mm and in most of the cases associated with subcutaneous or perifascial edema [18]. Insertional bone marrow edema can be present in some of the cases and may be related to mechanical changes or inflammatory enthesitis [19]. Figure 7 presents main findings of plantar fasciitis.
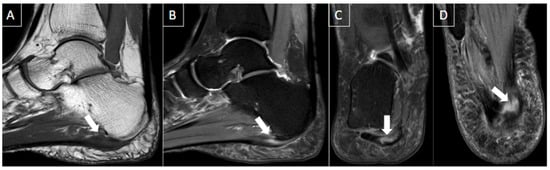
Figure 7. 55-year-old female patient with heel pain during walking for 4 months. Ankle MR images in sagittal T1-weighted (A), sagittal T2-weighted fat-suppressed (B), coronal T2-weighted fat-suppressed (C), and axial T2-weighted fat-suppressed (D) show significant plantar fasciitis of the proximal central bundle (arrows), characterized by thickening and partial tear of interstitial fibers. Bone edema at the calcaneal attachment and surrounding soft tissue inflammatory changes are also seen.
2.5. Plantar Fibromatosis
Also known as Ledderhose disease, plantar fibromatosis is a rare and benign entity presenting with ill-defined infiltrative heterogeneous masses in the deep aponeurosis (plantar fascia), adjacent to the plantar muscles. These nodules can be locally aggressive. This condition has an increased prevalence in men and is more frequent in patients with diabetes and epilepsy. Ultrasound has advantages over MRI in the assessment of plantar fibromatosis, since fibromas are easy to detect on US due to the contrast between the poorly reflective fibroma and the fibrillar appearance of the normal fascia, as well as the possibility of direct contralateral comparison [10][16].
Ultrasound findings include diffuse fusiform-shaped nodules of plantar fascia separated from the calcaneal insertion that are hypoechoic or isoechoic to the plantar fascia. Either posterior acoustic enhancement or shadowing can be seen, as well as hypervascularity on Doppler. The majority are located within midsubstance or superficial to the plantar fascia. If large with infiltrative margins, consider aggressive plantar fibromatosis [10].
MRI findings include isointense plantar fascia nodules on T1-weighted images and on T2-weighted fat-suppressed images, with contrast enhancement after the administration of gadolinium [10]. A case of plantar fibromatosis is demonstrated in Figure 8.
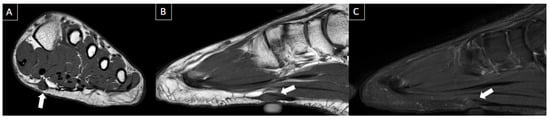
Figure 8. 41-year-old male with swelling and pain in the left foot. Short axis T1-weighted (A), sagittal T1-weighted (B), and sagittal fat-suppressed T2-weighted (C) MR images present a fusiform nodule in the central band of the plantar fascia, at the midfoot level (arrows), consistent with plantar fibroma. The nodule correlates with the patient’s symptom location (cutaneous marker).
2.6. Tendon Pathologies
Foot tendon pathologies are common and seen in a wide range of patients from young athletes to older patients. These pathologies include tendinosis (tendinopathy), tenosynovitis and peritendinitis, partial and complete tears, subluxation and dislocations, and, rarely, tendon entrapments. Tendinosis represents tendon degeneration and manifests as enlargement and increased intrasubstance signal on T2-weighted images. Tendon tears appear with higher signal intensity or even fluid signal intensity on T2-weighted images. Partial tears may show tendon enlargement due to longitudinal splits or thinning, caused by partial disruption of the tendon fibers. Full-thickness tears are represented by complete disruption, generally with retraction and tendon gap. Tenosynovitis is the inflammation of the tendon sheath, with an increased amount of fluid and inflammation of the surrounding soft tissues. Peritendinitis is the inflammation of the peritenon, and paratendinitis refers to inflammation of the adjacent tissues [20][21][22].
Ultrasound demonstrates intra and peritendinous alterations, with increase in tendon thickness and different degrees of hypoechogenicity. MRI demonstrates enlargement and signal alterations of the tendon affected. High signal intensity can be seen involving the tendon and peritendinous soft tissues. Insertional tendinopathy (enthesopathy) can be associated with bone spurs and calcifications [20][21][22]. Tendon pathologies are presented in Figure 9 with illustrative images.
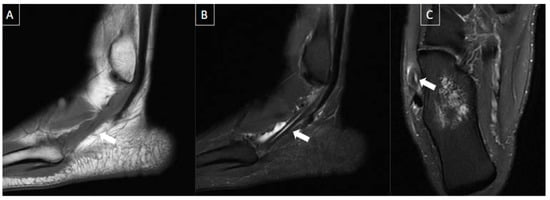
Figure 9. 41-year-old male patient with pain in the left foot for four days after intense running exercise. MR images of the forefoot in sagittal T1 (A), sagittal T2-weighted fat-suppressed (B), and axial T2-weighted fat-suppressed (C) show tendinopathy of the retro and inframalleolar segment of peroneous brevis tendon with split tear extending to its insertion at the fifth metatarsal base (arrows).
2.7. Ganglion/Synovial Cysts
Synovial cysts are caused by the herniation of the synovial membrane through the joint capsule, and typically there is a persistent communication with the joint with synovial tissue lining. Ganglion cysts are a discontinuous layer of pseudo-synovial cells, surrounded by non-synovial connective tissue and not always communicating with the joint. They may be in or associated with joint capsules, ligaments, tendon sheaths, bursa, or bone [9].
These cysts are easily seen on ultrasound as well defined, uni, or multilocular fluid-filled anechoic masses, with posterior acoustic enhancement. The stalk can be identified, indicating a communication with the adjacent joint or tendon sheath of origin [7].
On MRI, the cyst can be seen as a mass with water equivalent signal, with uniformly hyperintense and the walls can show enhancement after gadolinium administration. Narrow stalk connecting cyst to joint can also be visualized [9]. Figure 10 shows a case of ganglion/synovial cyst.
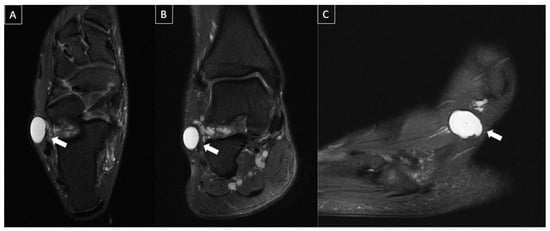
Figure 10. 54-year-old male with localized pain in the lateral aspect of the ankle. MR images in axial (A), coronal (B), and sagittal (C) T2-weighted fat-suppressed show multi lobulated and septated cyst in communication with sinus tarsi ligaments and posterior subtalar joint (arrows), extending into the lateral subcutaneous layer, consistent with synovial/ganglion cyst.
2.8. Stress Fractures
Stress fractures occur due to a mismatch of strength and mechanical stress on the bone. They are the most common bony cause of metatarsalgia [13]. Fatigue stress fractures occur in athletes, especially runners and military recruits, by overload of normal bone. Insufficiency stress fractures are more common in women and older patients, even with normal loads on demineralized bone [7]. Metatarsal shafts are the most common site for stress fractures, especially of the second or third rays [23]. Initial radiographs can be negative for up to 2 to 3 weeks.
Although ultrasound has low sensitivity to detect stress fractures, it can show thickening and hypervascularity of the periosteum, cortical irregularities, and subcutaneous edema [14]. Cortical fracture lines and callus formation are better evaluated by radiographs [7]. MRI is the modality of choice, demonstrating periosteal thickening and bone marrow and surrounding reactive soft tissue edema [23]. MRI findings include jagged and irregular, incomplete or complete low signal fracture line through bone, characterized by a band of low signal intensity contiguous with the cortex on both T1 and T2-weighted images. The bone marrow edema may be feathery, stellate, or band-shaped [7]. Figure 11 nicely demonstrates an example of stress fracture.
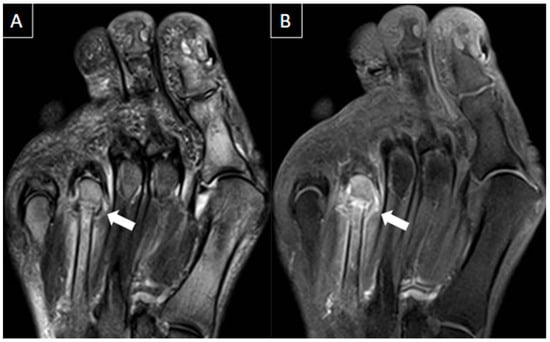
Figure 11. 54-year-old female with history of bulimia and recent pain in the left foot after walking. MR images in the long axis (T2-weighted fat-suppressed in (A), and T1 fat-suppressed post gadolinium in (B)) show stress fracture of the 4th metatarsal neck associated with bone edema, periostitis, and edema of the surrounding soft tissues (arrows).
2.9. Plantar Plate Injuries
Plantar plate injuries are a type of tear of the metatarsophalangeal joint capsule, occurring most frequently at the distal aspect of the plantar plate, either medial or lateral. When they involve the hallux, they are known as “turf toe”. Most of the lesser plantar plate tears occur in the second metatarsophalangeal joint [9]. They may affect the plantar plate itself, the collateral ligaments, or interosseous tendons [13].
Ultrasound findings include thickening, hypoechogenicity, discontinuity, and entheseal irregularity at the base of the proximal phalanx [10]. Ultrasound has the advantage of allowing dynamic evaluation to the plantar plates, especially assessing its integrity or retraction during dorsiflexion stress of the toes. Ideally, the ultrasound scan should be performed with focused high-frequency probes, such as the “hockey stick” probe.
MRI findings include insertion rupture, retraction, laxity, and redundancy, with inflammatory changes related to the age of the tear. Bone marrow edema in the metatarsal head can be seen due to abnormal motion and biomechanical changes of the forefoot. Since tears usually happen to the lateral or medial distal insertion sites, the flexor tendon and the plantar plate can shift laterally or medially in relation to the metatarsal base [14][24]. Figure 12 presents a case of plantar plate injury with corresponding imaging features.
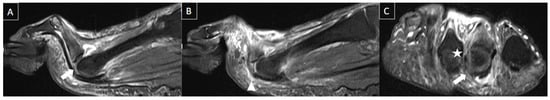
Figure 12. 51-year-old male patient with acute forefoot pain during physical activities that happened months ago. MR images in sagittal T2-weighted fat-suppressed (A,B) and short axis post-gadolinium T1-weighted fat-suppressed (C) demonstrate complete tear of the distal insertion of the second metatarsophalangeal plantar plate (arrows), with proximal retraction (arrowhead) with associated lateral collateral ligament (star), with edema and enhancement of adjacent soft tissues.
2.10. Freiberg’s Infraction
Freiberg’s infraction is a subchondral fracture that usually affects the second metatarsal head and generally occurs in young patients. They have a multifactorial cause that includes mechanical stress, impaction fracture, vascular insult, and following osteonecrosis and collapse [7].
MRI findings appear before they are seen radiographically and include bone marrow edema, with tiny subarticular and serpentine low signal linear abnormality representing the fracture line, associated with adjacent bone marrow edema. Fragmentation of the articular surface and flattening of the metatarsal head articular surface can be seen in advanced cases [25][26]. Refer to Figure 13 for a typical case of Freiberg's infraction.
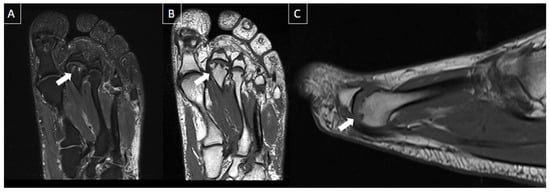
Figure 13. 56-year-old male patient with metatarsalgia for 6 months. MR images of the forefoot in the long axis (T2-weighted fat-suppressed (A) and T1-weighted (B)) and sagittal T1-weighted (C) present chronic deformity and depression of the second metatarsal head, with small subchondral cysts (arrows) suggestive of Freiberg’s infraction.
2.11. Crystal Arthropathies
Crystals can deposit in and around the joints, with the two main causes described below.
Calcium pyrophosphate deposition disease (CPPD) is a common arthropathy caused by the deposition of the crystals in hyaline cartilage, fibrocartilage, synovium, ligaments, and tendons. Prevalence increases with age, being common and asymptomatic in the elderly. The joints most commonly affected include the knee, pubic symphysis, and wrist [27].
Hydroxyapatite crystal deposition (HADD) disease is caused by the deposition of basic calcium phosphate crystals in joints or periarticular soft tissues, predominantly in tendons and ligaments. It typically occurs in middle-aged patients and can present with acute and severe symptoms, or it may be asymptomatic and incidentally detected on radiographs [27].
MRI is an excellent modality to assess the extent and severity of crystal arthropathies, but the findings may be nonspecific. MRI can be used to assess erosions, chondral defects, and periarticular edema. Calcium hydroxyapatite deposition, for example, appears as hypointense signal areas on both T1 and T2-weighted images. In the acute phase, there may be surrounding soft tissue and joint inflammation, with hyperintense signal in bone and adjacent muscles. Intraosseous migration or rapidly destructive arthritis of joints may occur, characterized by joint destruction, effusions, calcific deposits, and debris [27]. Figure 14 shows a case of crystal arthropathy.
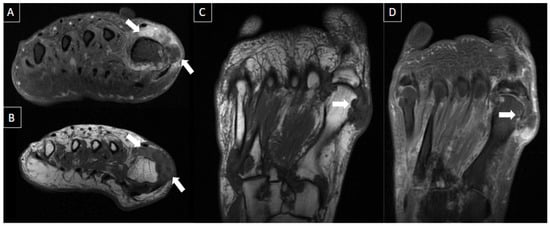
Figure 14. 47-year-old male presenting with swelling and pain at the base of greater toe. MR images in short axis T1 fat-suppressed post-gadolinium (A), short axis T1-weighted (B), long axis T1-weighted (C), and T1 fat-suppressed post-gadolinium (D) show multiple foci of cortical erosions with edema and contrast enhancement, with associated synovial thickening and amorphous low signal intensity tissue suggestive of crystal deposits (arrows), notably at the metatarsophalangeal joint but also seen at the tarsometatarsal joints. Classic imaging features of gout.
2.12. Baxter Neuropathy
Baxter neuropathy is a term that defines nerve entrapment syndrome resulting from the compression of the inferior calcaneal nerve (Baxter nerve), which is the first branch of the lateral plantar nerve. Since it innervates the abductor digiti minimi, imaging findings include edema-like signal intensity changes within the affected muscle and in the long term lead to fatty atrophy [28]. Figure 15 shows a case of Baxter neuropathy.
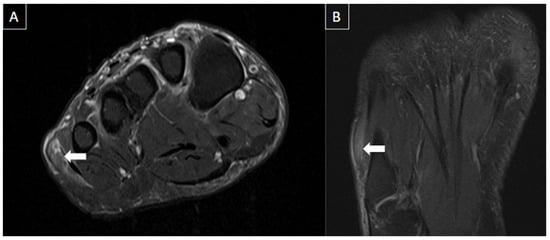
Figure 15. 53-year-old female presenting with paresthesia in the lateral plantar region. MR images of the forefoot in T2-weighted fat-suppressed short axis (A) and long axis (B) show mild edema of the abductor digiti minimi muscle (arrows), suggesting acute denervation due to compressive neuropathy (Baxter’s neuropathy).
This entry is adapted from the peer-reviewed paper 10.3390/diagnostics14020126
References
- Kruger, P.C.; Eikelboom, J.W.; Douketis, J.D.; Hankey, G.J. Deep vein thrombosis: Update on diagnosis and management. Med. J. Aust. 2019, 210, 516–524.
- Edwards, S.R.; Wood, O.D. Plantar vein thrombosis. Phlebol. J. Venous Dis. 2021, 36, 26–31.
- Thomas, M.L.; O’Dwyer, J.A. A phlebographic study of the incidence and significance of venous thrombosis in the foot. Am. J. Roentgenol. 1978, 130, 751–754.
- Miranda, F.C.; Carneiro, R.D.; Longo, C.H.; Fernandes, T.D.; Rosemberg, L.A.; Funari, M.B.D.G. Plantar thrombophlebitis: Magnetic resonance imaging findings. Rev. Bras. Ortop. 2012, 47, 765–769.
- Vansevenant, M.; Vanhoenacker, F.M. Plantar Vein Thrombosis: An Unusual Cause of Plantar Pain. J. Belg. Soc. Radiol. 2015, 99, 98–101.
- Fabro, M.; Fabro, S.R.M.; Sales, R.S.O.; Machado, C.A.; de Araújo, G.L. Plantar vein thrombosis: A rare differential diagnosis in patients with plantar pain. Radiol. Bras. 2015, 48, 399–400.
- Hodes, A.; Umans, H. Metatarsalgia. Radiol. Clin. N. Am. 2018, 56, 877–892.
- Lopez, V.; Slullitel, G. Metatarsalgia: Assessment Algorithm and Decision Making. Foot Ankle Clin. 2019, 24, 561–569.
- Afonso, P.D.; Britto, S.V.; Spritzer, C.E.; Martins e Souza, P. Differential Diagnosis of Metatarsalgia. Semin. Musculoskelet. Radiol. 2023, 27, 337–350.
- Ganguly, A.; Warner, J.; Aniq, H. Central Metatarsalgia and Walking on Pebbles: Beyond Morton Neuroma. Am. J. Roentgenol. 2018, 210, 821–833.
- Galley, J.; Sutter, R.; Germann, C.; Pfirrmann, C.W.A. The Vulcan salute sign: A non-sensitive but specific sign for Morton’s neuroma on radiographs. Skeletal Radiol. 2022, 51, 581–586.
- Torriani, M.; Kattapuram, S.V. Technical innovation. Dynamic sonography of the forefoot: The sonographic Mulder sign. Am. J. Roentgenol. 2003, 180, 1121–1123.
- Hulstaert, T.; Shahabpour, M.; Provyn, S.; Lenchik, L.; Simons, P.; Vanheste, R.; De Maeseneer, M. Forefoot Pain in the Lesser Toes: Anatomical Considerations and Magnetic Resonance Imaging Findings. Can. Assoc. Radiol. J. 2019, 70, 408–415.
- Hallinan, J.T.; Statum, S.M.; Huang, B.K.; Bezerra, H.G.; Garcia, D.A.; Bydder, G.M.; Chung, C.B. High-Resolution MRI of the First Metatarsophalangeal Joint: Gross Anatomy and Injury Characterization. Radiographics 2020, 40, 1107–1124.
- Latt, L.D.; Jaffe, D.E.; Tang, Y.; Taljanovic, M.S. Evaluation and Treatment of Chronic Plantar Fasciitis. Foot Ankle Orthop. 2020, 5, 2473011419896763.
- Draghi, F.; Gitto, S.; Bortolotto, C.; Draghi, A.G.; Ori Belometti, G. Imaging of plantar fascia disorders: Findings on plain radiography, ultrasound and magnetic resonance imaging. Insights Imaging 2017, 8, 69–78.
- Khammas, A.S.A.; Mahmud, R.; Hassan, H.A.; Ibrahim, I.; Mohammed, S.S. An assessment of plantar fascia with ultrasound findings in patients with plantar fasciitis: A systematic review. J. Ultrasound 2023, 26, 13–38.
- Drake, C.; Whittaker, G.A.; Kaminski, M.R.; Chen, J.; Keenan, A.M.; Rathleff, M.S.; Robinson, P.; Landorf, K.B. Medical imaging for plantar heel pain: A systematic review and meta-analysis. J. Foot Ankle Res. 2022, 15, 4.
- Jeswani, T.; Morlese, J.; McNally, E.G. Getting to the heel of the problem: Plantar fascia lesions. Clin. Radiol. 2009, 64, 931–939.
- Scott, A.; Backman, L.J.; Speed, C. Tendinopathy: Update on Pathophysiology. J. Orthop. Sports Phys. Ther. 2015, 45, 833–841.
- Abat, F.; Alfredson, H.; Cucchiarini, M.; Madry, H.; Marmotti, A.; Mouton, C.; Oliveira, J.M.; Pereira, H.; Peretti, G.M.; Romero-Rodriguez, D.; et al. Current trends in tendinopathy: Consensus of the ESSKA basic science committee. Part I: Biology, biomechanics, anatomy and an exercise-based approach. J. Exp. Orthop. 2017, 4, 18.
- Taneja, A.K.; Simeone, F.J.; Chang, C.Y.; Kumar, V.; Daley, S.; Bredella, M.A.; Torriani, M. Peroneal tendon abnormalities in subjects with an enlarged peroneal tubercle. Skeletal Radiol. 2013, 42, 1703–1709.
- Jungmann, P.M.; Schaeffeler, C. Bone Stress Injuries at the Ankle and Foot. Semin. Musculoskelet. Radiol. 2023, 27, 283–292.
- Bajaj, S.; Chhabra, A.; Taneja, A.K. 3D isotropic MRI of ankle: Review of literature with comparison to, 2D MRI. Skeletal Radiol. 2023, 1–22.
- Lee, S.; Saifuddin, A. Magnetic resonance imaging of subchondral insufficiency fractures of the lower limb. Skeletal Radiol. 2019, 48, 1011–1021.
- Enge, D.J.; Fonseca, E.K.U.N.; Baptista, E.; Santos, D.D.C.B.; Rosemberg, L.A. Avascular necrosis: Radiological findings and main sites of involvement-pictorial essay. Radiol. Bras. 2019, 52, 187–192.
- Teh, J.; McQueen, F.; Eshed, I.; Plagou, A.; Klauser, A. Advanced Imaging in the Diagnosis of Gout and Other Crystal Arthropathies. Semin. Musculoskelet. Radiol. 2018, 22, 225–236.
- Jaring, M.R.F.; Khan, A.Z.; Livingstone, J.A.; Chakraverty, J. A Case of Bilateral Baxter’s Neuropathy Secondary to Plantar Fasciitis. J. Foot Ankle Surg. 2019, 58, 771–774.
This entry is offline, you can click here to edit this entry!