Your browser does not fully support modern features. Please upgrade for a smoother experience.
Please note this is an old version of this entry, which may differ significantly from the current revision.
Half-Heusler alloys are among the most promising thermoelectric materials.
- Half Heusler alloys, physical properties, Figure of merit
1. Introduction
In this chapter, all data from references [1][2][3][4][5][6][7][8][9][10][11][12][13][14][15][16][17][18][19][20][21][22][23][24][25][26][27][28][29][30][31][32][33][34][35][36][37][38][39][40][41][42][43][44][45][46][47][48][49][50][51][52][53][54][55][56][57][58][59][60][61][62][63][64][65][66][67][68][69][70][71][72][73][74][75][76][77][78][79][80][81][82][83][84][85][86][87][88][89][90][91][92][93][94][95][96][97][98][99][100][101][102][103][104][105][106][107][108][109][110][111][112][113][114][115][116][117][118][119][120][121][122][123][124][125][126][127][128][129][130][131][132][133][134][135][136][137][138][139][140][141][142][143][144][145][146][147][148][149][150][151][152][153][154][155][156][157][158][159][160][161][162][163][164][165][166][167][168][169][170][171][172][173][174][175][176][177][178][179][180][181][182][183][184][185][186][187][188][189][190][191][192][193][194][195][196][197][198][199][200][201][202][203][204][205][206][207][208] were used for figures and discussions. The references [19][20][21][22][23][24][25][26][27][28][29][30][31][32][33][34][35][36][37][38][39][40][41][42][43][44][45][46][47][48][49][50][51][52][53][54][55][56][57][58][59][60][61][62][63][64][65][66][67][68][69][70][71][72][73][74][75][76][77][78][79][80][81][82][83][84][85][86][87][88][89][90][91][92][93][94][95][96][97][98][99][100][101][102][103][104][105][106][107][108][109][110][111][112][113][114][115][116][117][118][119][120][121][122][123][124][125][126][127][128][129][130][131][132][133][134][135][136][137][138][139][140][141][142][143][144][145][146][147][148][149][150][151][152][153][154][155][156][157][158][159][160][161][162][163][164][165][166][167][168][169][170][171][172][173][174][175][176][177][178][179][180][181][182][183][184][185][186][187][188][189][190][191][192][193][194][195][196][197][198][199][200][201][202][203][204][205][206][207][208] are numbered by the publication year, within one year, in alphabetical order.
Looking at the highest ZTs published during the last 25 years, one can see in Figure 1 that, as already mentioned in the introduction, considerably more n-type half-Heusler alloys were investigated than p-type. It is also clearly visible that the trend of high peak ZTs increases almost linearly from 2004 to 2018. There are exceptions for the n-type, such as (i) the work of Sakurada et al. [33], who published already in 2005 outstanding high values (ZT = 1.25 to 1.5) for Ti0.5Zr0.25Hf0.25NiSn doped with small amounts of antimony, or (ii) from Shen et al. [8][23] and Kawasaki et al. [27], who reached almost ZTs = 1 at 800 K in 2001 and 2004 for ZrNiSn0.99Sb0.01. It is also worth mentioning that Yu et al. [140] reached ZT = 1.6 at 1200 K for his p-type HH series (Nb1−xTax)0.8Ti0.2FeSb. Furthermore, it seems that after a boom during 2015–2020, the number of half-Heusler publications has dropped significantly.
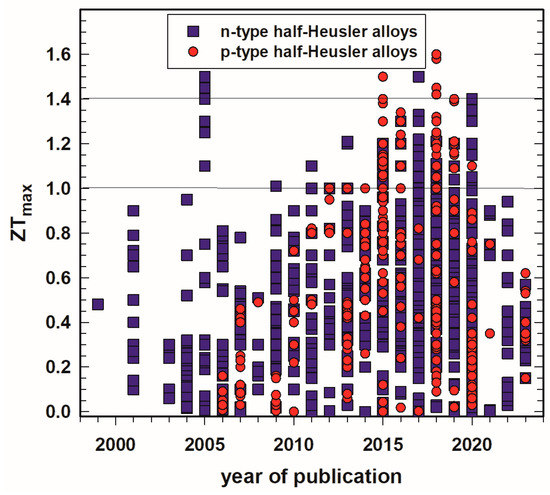
Figure 1. Peak ZT, ZTmax, of p- and n-type half-Heusler alloys vs. year of publication.
Figure 2 displays the highest ZTs as a function of temperature. It is necessary to point out that in some cases ZTmax is not really the peak ZT of the respective sample but the ZT at the highest measured temperature. This is especially the case for publications earlier than 2005. Besides that, in most cases ZTmax is published for temperatures between 700 K and 1000 K; the highest temperatures for ZTmax for p- as well as n-type are around 1200 K.
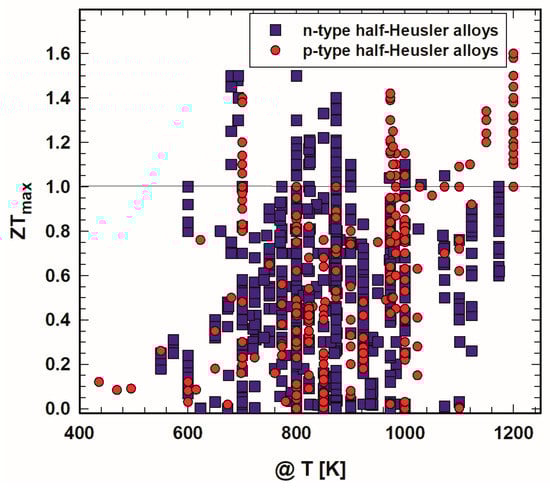
Figure 2. Peak ZT, ZTmax, of p- and n-type half-Heusler alloys vs. temperature, T.
Figure 3 and Figure 4 depict the dependence of the power factor on the thermal conductivity at 300 K and 800 K, respectively. Figure 3 shows that at 300 K, almost all power factor values for the n-type are within the range of 4 mW/mK2 for thermal conductivities up to 250 mW/cmK, whereas the p-type displays much higher power factors, reaching values higher than 10 mW/mK2 for thermal conductivities up to about 150 mW/cmK, e.g., for the Nb1−xTixFeSb-series of He et al. [121] or for Nb0.95Hf0.05FeSb and Nb0.95Zr0.05FeSb of Ren and colleagues [150].
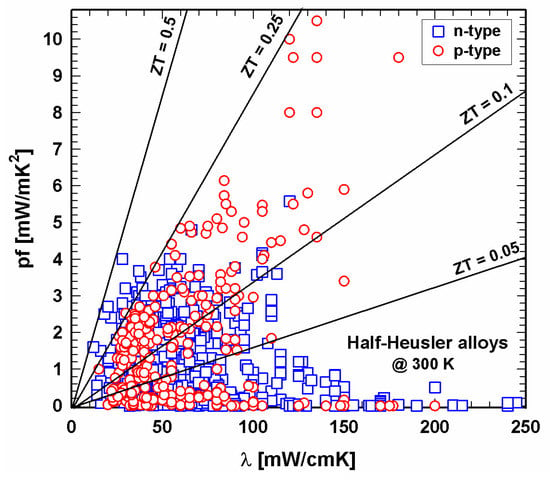
Figure 3. P- and n-type half-Heusler alloys: power factor, pf, vs. thermal conductivity, λ, at 300 K.
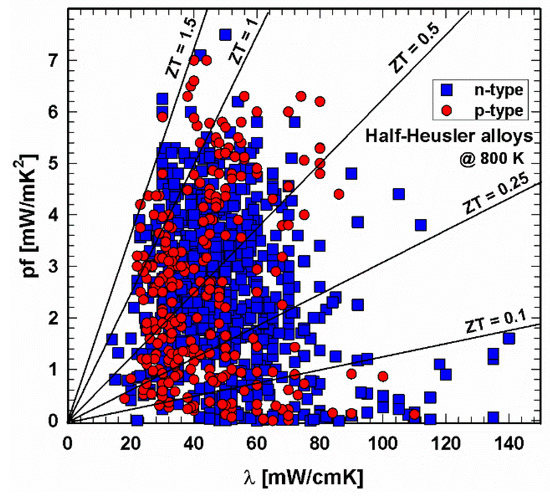
Figure 4. P- and n-type half-Heusler alloys: power factor, pf, vs. thermal conductivity, λ, at 800 K.
The situation has changed comparing this figure now with the one for 800 K (Figure 4), and as for p- and n-type, all data are mainly evenly distributed within a power factor–thermal conductivity window of almost 0–5.5 mW/mK2 by 20–80 mW/cmK.
Lines for the resulting ZT values are drawn in both Figure 3 and Figure 4, revealing that at 300 K, no compound exceeds ZT = 0.5. Whilst many of the p-type compounds range between ZT = 0.1 and 0.25 or have values as low as almost 0, one can find the values for the n-type all over, the very low values due to high thermal conductivities. At 800 K, both p- and n-type exceed the ZT = 1.5 line. The majority of data can be found for thermal conductivities between 20 and 80 mW/cmK, representing ZTs from almost 0 to ZT = 1.5. This figure also illustrates that p-type HH materials generally exhibit lower thermal conductivities than the n-type.
Figure 5 and Figure 6 depict the relation between electrical resistivity and ZT at 300 K and 800 K, respectively. It shows that, especially in the 300 K temperature region, individual specimens have very high resistivities, resulting, as a consequence, in very low ZTs. Generally, the electrical resistivity decreases with increasing temperature. Figure 6 displays lower resistivity values. Still, here one can find ZTs in the range of 10−3 or even lower. The insert, a cutout, in each ZT-resistivity figure, gives a better overview, indicating that, especially for 800 K, most data can be found between 500 and 2500 µΩcm. In this region are also the highest ZTs.
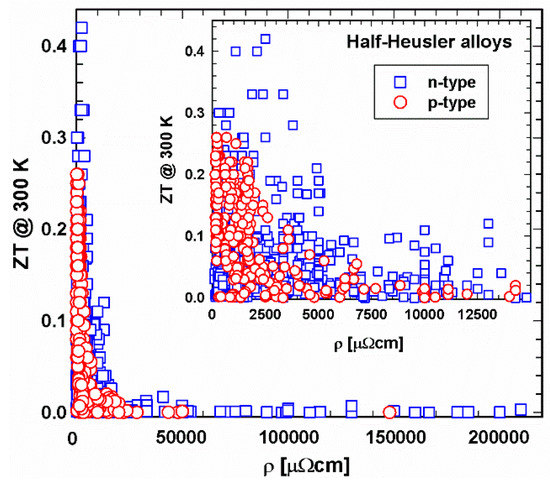
Figure 5. ZT at 300 K vs. electrical resistivity, ρ, for p- and n-type half-Heusler alloys. Insert: cutout for ρ < 15000 µΩcm.
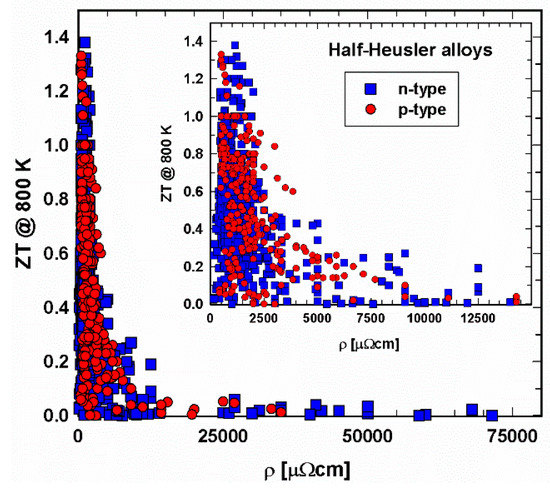
Figure 6. ZT at 800 K vs. electrical resistivity, ρ, for p- and n-type half-Heusler alloys. Insert: cutout for ρ < 12000 µΩcm.
Figure 7 and Figure 8 present the dependence of ZT on the Seebeck coefficient. Especially at 300 K, the area of Seebeck values is much wider for the n- than for the p-type. Generally, it seems that an absolute Seebeck value of 200 ± 20 µV/cm leads to high ZTs, a great finding for the production of new half-Heuslers.
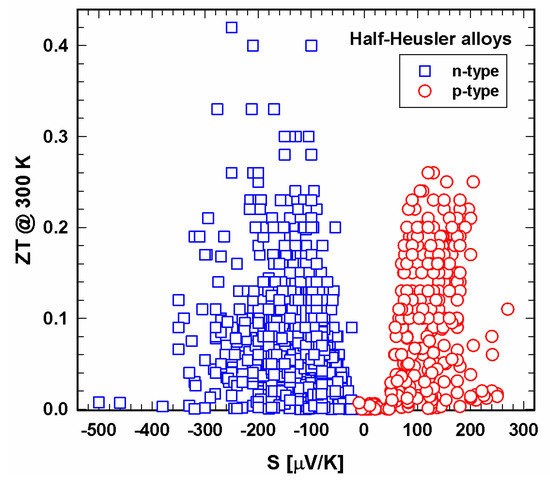
Figure 7. ZT at 300 K vs. Seebeck coefficient, S, for p- and n-type half-Heusler alloys.
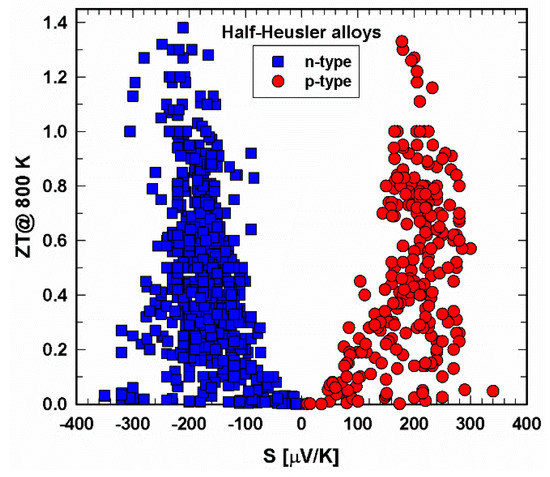
Figure 8. ZT at 800 K vs. Seebeck coefficient, S, for p- and n-type half-Heusler alloys.
Whereas for the high-temperature regime (Figure 9), the data ZT vs. λ are more or less evenly mixed at 300 K (insert in Figure 9), most p-type half-Heuslers have thermal conductivities between 20 and 70 mW/cmK. Of course, in both regions, ZTs are high for low thermal conductivities. Comparing the total and the lattice thermal conductivities in Figure 9 and Figure 10, the distribution of the data looks very similar, indicating that the electron part of the thermal conductivity is rather low, and, as a consequence, the phonon part is in the range of the total thermal conductivity.
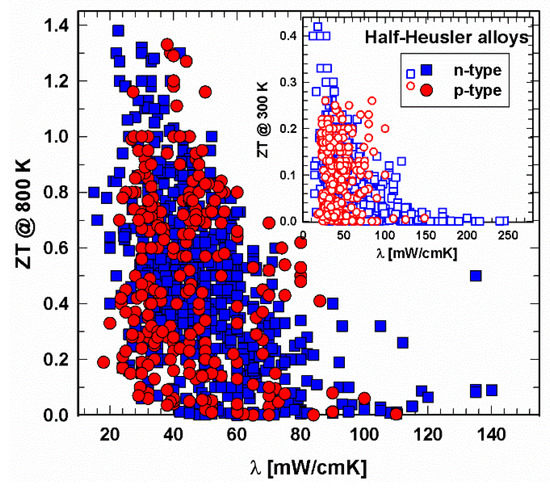
Figure 9. ZT at 800 K vs. thermal conductivity, λ, for p- and n-type half-Heusler alloys. Insert: ZT at 300 K vs. thermal conductivity, λ.
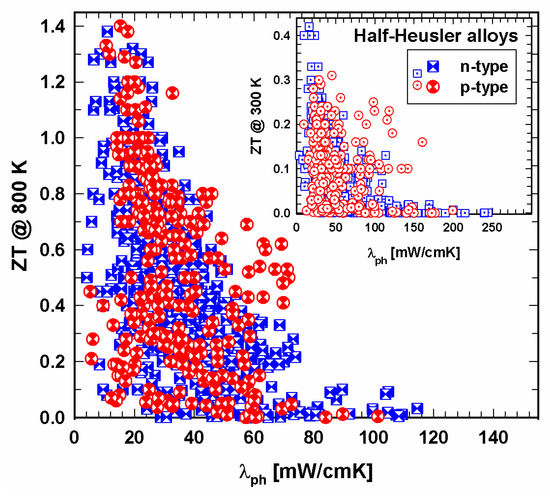
Figure 10. ZT at 800 K vs. lattice thermal conductivity, λph, for p- and n-type half-Heusler alloys. Insert: ZT at 300 K vs. lattice thermal conductivity, λph.
2. N-Type Half-Heusler Alloys
2.1. (Ti,Zr,Hf)NiSn-System
Comparing the ZT values of TiNiSn, ZrNiSn and HfNiSn, as shown in Figure 11 and Figure 12, one can immediately see that ZrNiSn is the most investigated alloy of these three, whereas HfNiSn is not so popular. It is evident from Figure 11 and Figure 12 that the highest ZTs at 300 K as well as at 800 K in this system are for (Zr,Hf)NiSn and (Ti,Zr,Hf)NiSn and even more so when Sb-doped at the Sn site.
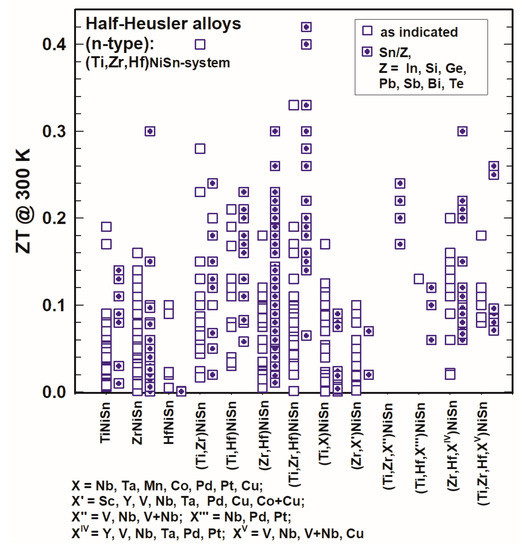
Figure 11. ZT at 300 K for the HH n-type (Ti,Zr,Hf)NiSn-system.
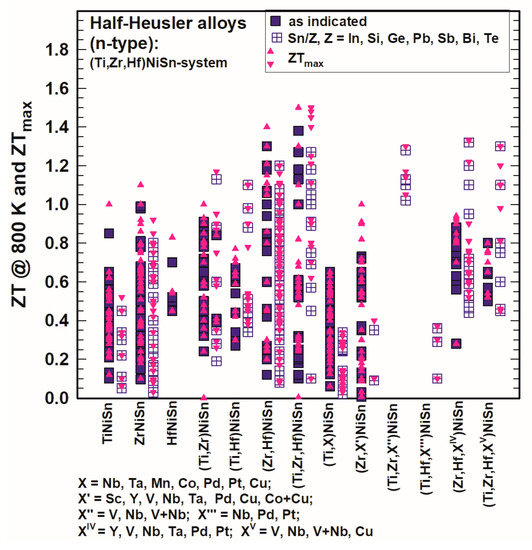
Figure 12. ZT at 800 K and ZTmax for the HH n-type (Ti,Zr,Hf)NiSn-system.
Gürth et al. [119] published ZT = 1 at 823 K for TiNiSn and for ZrNiSn, Misra et al. [96] ZT = 0.9 at 773 K for ZrNiSn and Liu et al. [109] ZT = 0.8 at 1000 K for HfNiSn. In comparison to these values, those for compounds with Ti and Zr, Ti and Hf, Zr and Hf or with Ti and Zr and Hf reach much higher values, such as for Zr0.7Hf0.3NiSn ZT = 1.2 at 873 K (Chauhan et al. [144]), for Ti0.5Zr0.25Hf0.25NiSn ZT = 1.3 at 693 K (Sakurada and Shutoh [33]; Shutoh and Sakurada [37]) or even ZT = 1.5 at 800 K (Rogl et al. [136]).
Doping in the (Ti,Zr,Hf)NiSn-system with X (X = Sc, Y, V, Nb, V + Nb, Ta, Mn, Co, Cu, Co + Cu, Pd, Pt, Pb) was not really successful as generally, all these alloys did not have higher ZTs; however, from Figure 11 as well as from Figure 12 it is obvious that with an additional substitution of Sn in many cases ZT is enhanced. Usually, Sn is substituted by a very small amount of Sb or Ge, but also, in rarer cases, In, Si, Pb, Bi or Te was used. The highest ZT values were reached for Ti0.5Zr0.25Hf0.25NiSn0.998Sb0.002 at 700 K (ZT = 1.5, Shutoh and Sakurada [37]) and Ti0.5Zr0.25Hf0.25NiSn0.99Sb0.01 at 825 K (ZT = 1.45, Rogl et al. [136]). Besides that, there are several compounds with ZT ∼ 1.3, such as (Hf0.6Zr0.4)0.99V0.01NiSn0.995Sb0.005 at 900 K (Chen et al. [130]) or Ti0.49Zr0.49V0.02NiSn0.98Sb0.02 at 823 K (Rogl et al. [136]) (see also Figure 12).
Various groups used additions, mainly nanoparticles, to reduce the thermal conductivity and to enhance ZT. Schwall and Balke [70] incorporated Nb into Zr0.5Hf0.5NiSn but presented data only below room temperature. Akram et al. [98] admixed La with ZrNiSn: the enhancement in ZT was within the error bar of ZT (from 0.52 to 0.54), which also applies to Visconti et al. [139], who used HfO2 for Ti0.5Zr0.5NiSn0.994Sb0.006 (ZT rises from 0.9 to 1). A better result was achieved by Chauhan et al. [143] by mixing ZnO with ZrNiSn (highest ZT = 1). Nanoparticles of ZrO2 were added to ZrNiSn (Huang et al. [25]) as well as to Zr0.5Hf0.5Ni0.8Pd0.2Sn0.99Sb0.01 and Zr0.25Hf0.6Ti0.15NiSn0.995Sb0.005 (Chen et al. [39] and [117], respectively). For ZrNiSn, the “enhancement” of ZT was within the error bar; however, it was much better for the other two compounds with ZTmax = 0.74 and even ZTmax = 1.3 for the Ti-doped half-Heusler alloy.
2.2. (Ti,Zr,Hf)CoSb-System, (V,Nb,Ta)FeSb-System, 19-Electron System and Other N-Type Half-Heusler Alloys
In Figure 13 and Figure 14, the ZTs are shown for the (Ti,Zr,Hf)CoSb-system, the (V,Nb,Ta)FeSb-system, the 19-electron system and of all those half-Heuslers, which do not fit into any of the so-far mentioned categories. For all these systems, only a few half-Heuslers with Sb/Sn substitutions were published; generally, ZTs are much lower in comparison with the (Ti,Zr,Hf)NiSn-system for 300 K as well as for 800 K.
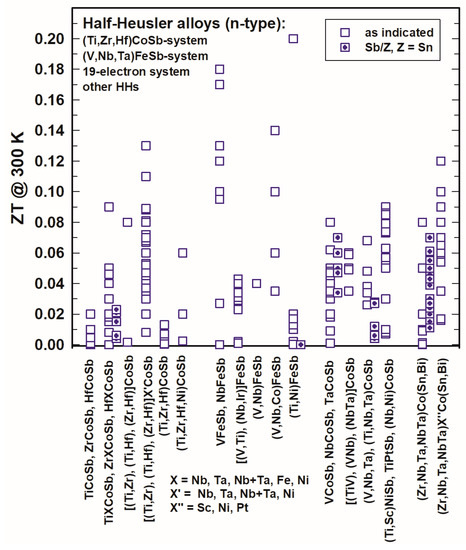
Figure 13. ZT at 300 K for the HH n-type (Ti,Zr,Hf)CoSb-system, (V,NbTa)FeSb-system, 19-electron system and other half-Heuslers.
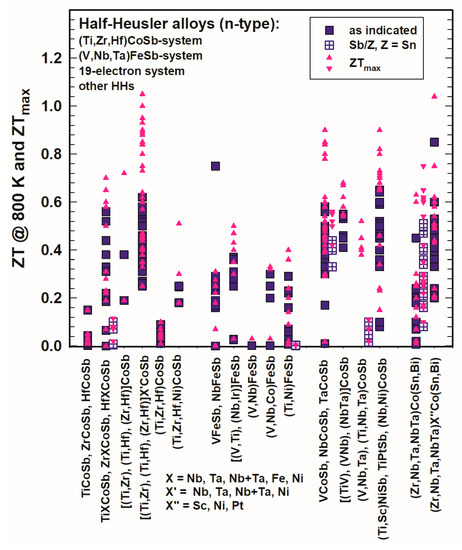
Figure 14. ZT at 800 K for the HH n-type (Ti,Zr,Hf)CoSb-system, (V,NbTa)FeSb-system, 19-electron system and other half-Heuslers.
At 800 K (Figure 14), almost all ZTs are lower than 0.7 and also ZTmax rarely exceeds 1. He et al. [131] reached ZT > 1 for Zr0.5Hf0.5Co0.9Ni0.1Sb at 1073 K, Liu et al. [148] acquired ZTs of almost 1 and around 1 for the series (Zr1−xHfx)0.88Nb0.12CoSb. Xia et al. [106][155] investigated Nb1−xCoSb and Nb0.8Co1−xNixSb with ZT = 0.8–0.9. Zhu et al. [177] obtained ZT = 0.85 at 800 K with a peak ZT = 1.04 at 972 K for ZrCo0.9Ni0.1Bi0.85Sb0.15.
3. P-Type Half-Heusler Alloys
In some cases, measurements were only performed below room temperature. Figure 15 and Figure 16 represent the ZTs for p-type half-Heusler alloys at 300 K and 800 K as well as the peak ZTs, respectively.
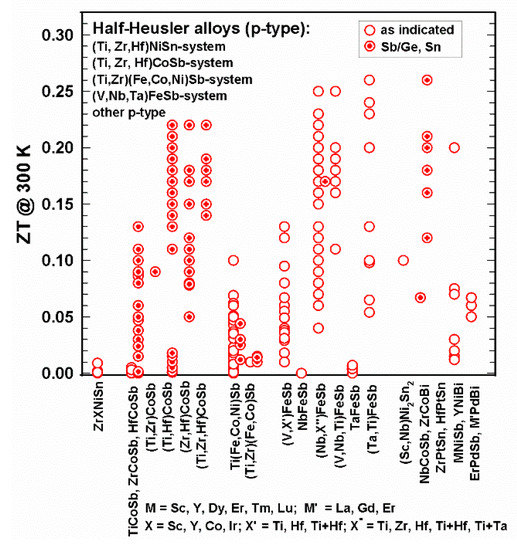
Figure 15. ZT at 300 K for the p-type HH alloys.
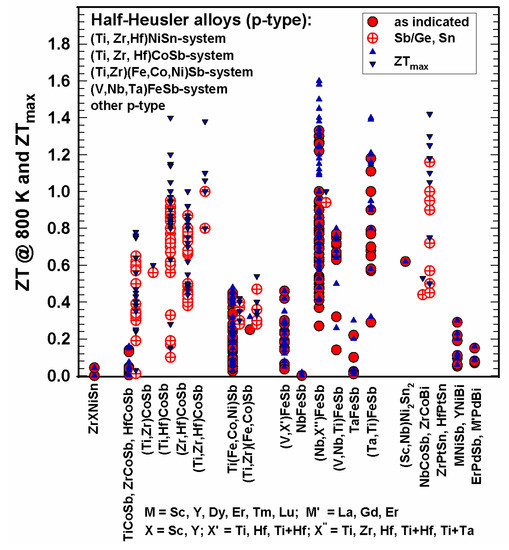
Figure 16. ZT at 800 K and ZTmax for the p-type HH alloys.
It is obvious that many more n-type than p-type alloys were investigated. As depicted in Figure 15, at 300 K, all ZTs are below 0.3; at 800 K (Figure 16), most ZTs are lower than 1; however, several half-Heuslers in the (NbX’’)FeSb series with X’’ = Ti, Zr, Hf, Zr and Hf, as well as Ti + Ta, reach ZT = 1.4 at 800 K; the values for ZTmax in some cases reach or even exceed 1.4 and go up to 1.6.
It can be seen in Figure 15 and Figure 16 that only data of two p-type compounds are available for the (Ti,Zr,Hf)NiSn-system, namely (Zr,Sc)NiSn [112] and (Zr,Y)NiSn [104] with rather low ZTs.
In the CoSb-based system, almost all compounds are substituted at the Sb-site by Sn, except for TiCoSb, which was also substituted by Ge [58]. Rausch et al. published in two separate works [110][111] rather high ZTs of the (Ti,Zr,Hf)CoSb1−xSnx, series: the highest ZTmax = 1.4 for Ti0.12Zr0.44Hf0.44CoSb0.8Sn0.2 at 963 K [111].
In the FeSb-based system, Yu et al. [140] achieved outstanding high peak ZT values (ZT = 1.2–1.6) for the series Ti0.2(Nb1−xTax)0.8FeSb; Zhu et al. gained ZT~1.4 at 1200 K for Hf0.12Nb0.88FeSb [158] and for Ti0.16Ta0.84FeSb [178].
Whereas many p-type half-Heuslers have ZTs < 1, the ZrCoBi-based half-Heuslers showed excellent thermoelectric performance, even more so for substituting at the Bi-site with ZT = 1.42 for ZrCoBi0.65Sb0.15Sn0.20 at 973 K as reported by Zhu et al. [159].
Also, for p-type half-Heusler alloys, some research groups tried to enhance ZT via additions. Kimura et al. [61] added Co and Ir to ZrNiSn and converted this way the n-type to a p-type half-Heusler alloy; however, ZTs were rather low, i.e., below 0.3. Mallick et al. [149] investigated (Hf0.7Ti0.3CoSb0.8Sn0.2)1−x(Cu1.98Ni0.04Te0.97Se0.03)x: for x = 0.25 they could enhance ZT = 0.15 (without the chalcogenide) to ZT = 0.63 at 1023 K, which corresponds an enhancement of 320%. Hsu et al. [93] were successful in producing nanostructured HfO2 during the ball-milling and spark–plasma–sintering process of Zr0.5Hf0.5CoSb0.8Sn0.2 and reached as highest ZT = 0.75. Xie et al. [183] enhanced ZT of Ti(Co,Fe)Sb with the addition of 1 atom percent nano inclusions of InSb by 450%; however, ZT = 0.33 is still very low.
4. Miscellaneous
On 8-electron half-Heusler alloys: Several authors have screened 8-electron half-Heusler alloys in DFT throughput calculations, identifying a series of compounds of interest in thermoelectrics. Vikram et al., in one publication [209], presented the TE properties of 21 half-Heusler alloys with a sum of 8 valence electrons (8-electron half-Heuslers); 6 of them showed ZTs between 0.8 and 1, such as LiSnAl, NaAlSn or LiAlGe. In another paper [210], he calculated the thermoelectric properties of a large number of ternary compounds of the type: group IA or IB element—group IIA or IIB element—group V element. From these results, he highlighted even ZTs such as ZT = 1.37 for RbPBa and ZT = 1.56 for AgPMg. Hoat et al. [211] also made theoretical investigations of the 8-electron half-Heusler alloy RbYSn, but they published only the power factors for the p- and n-types. So far, however, no experimental confirmation exists for the ZTs estimated from these DFT calculations.
On “double half-Heusler alloys”, etc.: Some authors have coined the term “double half-Heusler alloys”, “triple half-Heusler alloys”, etc. These terms are not without problems. Firstly, double a half is full, but the authors certainly did not want to discuss full-Heusler alloys. Secondly, a formula such as Ti2FeCoSnSb from a structural chemical point of view indicates a fully ordered compound, where Fe,Co and Sn,Sb atoms fully occupy separate two-fold sites in a crystallographic subgroup of the space group of the half-Heusler phase. As such a subgroup cannot be found among the HH face-centered cubic space group type, the structure, therefore, needs to be transferred into a suitable body-centered tetragonal space group (cubic setting a,a,a needs to be transferred to a tetragonal cell: a/2−−√,a/2−−√,𝑎) in order to find sites of two-fold multiplicity. Only if authors can prove the full atom order will the formula Ti2FeCoSnSb be proper. Similar arguments hold for “triple half-Heusler alloys“, etc.
This entry is adapted from the peer-reviewed paper 10.3390/cryst13071152
References
- Hu, T.; Yang, D.; Su, X.; Yan, Y.; You, Y.; Liu, W.; Uher, C.; Tang, X. Interpreting the combustion process for high-performance ZrNiSn thermoelectric materials. ACS Appl. Mater. Interfaces 2018, 10, 864–872.
- Yu, C.; Zhu, T.-J.; Shi, R.-Z.; Zhang, Y.; Zhao, X.-B.; He, J. High-performance half-Heusler thermoelectric materials Hf1−x ZrxNiSn1−ySby prepared by levitation melting and spark plasma sintering. Acta Mater. 2009, 57, 2757–2764.
- Yu, C.; Zhu, T.-J.; Xia, K.; Shen, J.J.; Yang, S.H.; Zhao, X. Reduced grain size and improved thermoelectric properties of melt spun (Hf, Zr) NiSn half-Heusler alloys. J. Electron. Mater. 2010, 39, 2008–2010.
- Karati, A.; Ghosh, S.; Mallik, R.C.; Shabadi, R.; Murty, B.S.; Varadaraju, U.V. Effect of processing routes on the microstructure and thermoelectric properties of half-Heusler TiFe0.5Ni0.5Sb1−xSnx (x = 0, 0.05, 0.1, 0.2) alloys. J. Mater. Eng. Perform. 2022, 31, 305–317.
- Bahrami, A.; Ying, P.; Wolff, U.; Perez-Rodriguez, N.; Schierning, G.; Nielsch, K.; He, R. Reduced lattice thermal conductivity for half-Heusler ZrNiSn through cryogenic mechanical alloying. ACS Appl. Mater. Interfaces 2021, 13, 38561–38568.
- Hasan, R.; Ur, S.-C. Thermoelectric and transport Properties of V1−xTixFeSb half-Heusler system synthesized by controlled mechanical alloying process. Electron. Mater. Lett. 2018, 14, 725–732.
- He, R.; Zhu, T.; Ying, P.; Chen, J.; Giebeler, L.; Kühn, U.; Grossman, J.C.; Wang, Y.; Nielsch, K. High-pressure-sintering-induced microstructural engineering for an ultimate phonon scattering of thermoelectric half-Heusler compounds. Small 2021, 17, 2102045.
- Shen, Q.; Zhang, L.; Chen, L.; Goto, T.; Hirai, T. Thermoelectric properties of ZrNiSn-based half-Heusler compounds. J. Mater. Sci. Lett. 2001, 20, 2197–2199.
- Xing, Y.; Liu, R.; Liao, J.; Zhang, Q.; Xia, X.; Wang, C.; Huang, H.; Chu, J.; Gu, M.; Zhu, T.; et al. High-efficiency half-Heusler thermoelectric modules enabled by self-propagating synthesis and topologic structure optimization. Energy Environ. Sci. 2019, 12, 3390–3399.
- Xing, Y.F.; Liu, R.H.; Sun, Y.Y.; Chen, F.; Zhao, K.P.; Zhu, T.J.; Bai, S.Q.; Chen, L.D. Self-propagation high-temperature synthesis of half-Heusler thermoelectric materials: Reaction mechanism and applicability. J. Mater. Chem. A 2018, 6, 19470–19478.
- Hu, T.; Cao, W.; Yang, D.; Yan, Y.; Cao, Y.; Zhang, T.; Su, X.; Liu, W.; Poudeu-Poudeu, P.; Tang, X. Ultra-fast fabrication of bulk ZrNiSn thermoelectric material through self-propagating high-temperature synthesis combined with in-situ quick pressing. Scripta Mater. 2019, 165, 140–144.
- Birkel, C.S.; Zeier, W.G.; Douglas, J.E.; Lettiere, B.R.; Mills, C.E.; Seward, G.; Birkel, A.; Snedaker, M.L.; Zhang, Y.; Snyder, G.J.; et al. Rapid Microwave Preparation of Thermoelectric TiNiSn and TiCoSb half-Heusler Compounds. Chem. Mater. 2012, 24, 2558–2565.
- Birkel, C.S.; Douglas, J.E.; Lettiere, B.R.; Seward, G.; Verma, N.; Zhang, Y.; Pollock, T.M.; Seshadri, R.; Stucky, G.D. Improving the thermoelectric properties of half-Heusler TiNiSn through inclusion of a second full Heusler phase: Microwave preparation and spark plasma sintering of TiNi1+xSn. Phys. Chem. Chem. Phys. 2013, 15, 6990–6997.
- Lei, Y.; Li, Y.; Xu, L.; Yang, J.; Wan, R.; Long, H. Microwave synthesis and sintering of TiNiSn thermoelectric bulk. J. Alloys Compd. 2016, 660, 166–170.
- Lei, Y.; Cheng, C.; Li, Y.; Wan, R.; Mang, M. Microwave synthesis and enhancement of thermoelectric figure of merit in half-Heusler TiNiSbxSn1−x. Ceram. Int. 2017, 43, 9343–9347.
- Rogl, G.; Zehetbauer, M.J.; Rogl, P.F. The effect of severe plastic deformation on thermoelectric performance of skutterudites, half-Heuslers and Bi-tellurides. Mater. Trans. 2019, 60, 2071–2085.
- Rogl, G.; Ghosh, S.; Wang, L.; Bursik, J.; Grytsiv, A.; Mallik, R.C.; Chen, X.-Q.; Zehetbauer, M.; Rogl, P. Half-Heusler alloys: Enhancement of ZT after severe plastic deformation (ultra-low thermal conductivity). Acta Mater. 2020, 183, 285–300.
- Rogl, G.; Rogl, P.F. How severe plastic deformation changes the mechanical properties of thermoelectric skutterudites and half-Heusler alloys. Front. Mater. 2020, 7, 600261.
- Browning, V.M.; Poon, S.J.; Tritt, T.M.; Pope, A.L.; Bhattacharya, S. Thermoelectric properties of the half-Heusler compound (Zr, Hf)(Ni, Pd) Sn. Proc. MRS Fall 1998, 545, 403.
- Cook, B.A.; Meisner, G.P.; Yang, J.; Uher, C. High temperature thermoelectric properties of MNiSn (M = Zr, Hf). In Proceedings of the Eighteenth International Conference on Thermoelectrics, Baltimore, MD, USA, 29 August 1999; pp. 64–67.
- Hohl, H.; Ramirez, A.P.; Goldmann, C.; Ernst, G.; Wölfing, B.; Bucher, E. Efficient dopants for ZrNiSn-based thermoelectric materials. J. Phys. Condens. Matter 1999, 11, 1697–1709.
- Uher, C.; Yang, J.; Hu, S.; Morelli, D.T.; Meisner, G.P. Transport properties of pure and doped MNiSn, M = Zr, Hf. Phys. Rev. B 1999, 59, 8615–8621.
- Shen, Q.; Chen, L.; Goto, T.; Hirai, T.; Yang, J.; Meisner, G.P.; Uher, C. Effects of partial substitution of Ni by Pd on the thermoelectric properties of ZrNiSn based half-Heusler compounds. Appl. Phys. Lett. 2001, 79, 4165–4172.
- Katayama, T.; Kim, S.W.; Kimura, Y.; Mishima, Y. The effects of quaternary additions on thermoelectric properties of TiNiSn-based half-Heusler alloys. J. Electron. Mater. 2003, 32, 1160–1165.
- Huang, X.Y.; Xu, Z.; Chen, L.D. The thermoelectric performance of ZrNiSn/ZrO2 composites. Solid State Commun. 2004, 130, 181–185.
- Katsuyama, S.; Matsushima, H.; Ito, M. Effect of substitution for Ni by Co and/or thermoelectric properties of half-Heusler ZrNiSn. J. Alloys Compd. 2004, 385, 232–237.
- Kawaharada, Y.; Uneda, H.; Muta, H.; Kurosaki, K.; Yamanaka, S. High temperature thermoelectric properties of NiZrSn half-Heusler compounds. J. Alloys Compd. 2004, 364, 59–63.
- Kawaharada, Y.; Kurosaki, K.; Muta, H.; Uno, M.; Yamanaka, S. High temperature thermoelectric properties of TiCoSb half-Heusler compounds. J. Alloys Compd. 2004, 384, 308–311.
- Kim, S.W.; Kimura, Y.; Mishima, Y. Enhancement of high temperature thermoelectric properties of intermetallic compounds based on a skutterudite IrSb3 and a half-Heusler TiNiSb. Sci. Technol. Adv. Mater. 2004, 5, 485–489.
- Kurosaki, K.; Muta, H.; Yamanaka, S. Thermoelectric properties of titanium-based half-Heusler compounds. J. Alloys Compd. 2004, 384, 51–56.
- Kurosaki, K.; Maekawa, T.; Muta, H.; Yamanaka, S. Effect of spark plasma sintering temperature on thermoelectric properties of (Ti, Zr, Hf)NiSn half-Heusler compounds. J. Alloys Compd. 2005, 397, 296–299.
- Muta, H.; Yamaguchi, T.; Kurosaki, K.; Yamanaka, S. Thermoelectric properties of ZrNiSn based half-Heusler compounds. In Proceedings of the Twentyfourth International Conference on Thermoelectrics, Clemson, SC, USA, 19 August 2005; pp. 339–342.
- Sakurada, S.; Shutoh, N. Effect of Ti substitution on the thermoelectric properties of (Zr,Hf)NiSn half-Heusler compounds. Appl. Phys. Lett. 2005, 86, 082105.
- Sekimoto, T.; Kurosaki, K.; Muta, H.; Yamanaka, S. Annealing effect on thermoelectric properties of TiCoSb half-Heusler compound. J. Alloys Compd. 2005, 394, 122–125.
- Sekimoto, T.; Kurosaki, K.; Muta, H.; Yamanaka, S. Thermoelectric properties of (Ti,Zr,Hf)CoSb type half-Heusler compounds. Mater. Trans. 2005, 46, 1481–1484.
- Sekimoto, T.; Kurosaki, K.; Muta, H.; Yamanaka, S. Thermoelectric and thermophysical properties of TiCoSb, ZrCoSb, HfCoSb prepared by SPS. In Proceedings of the Twentyfourth International Conference on Thermoelectrics, Clemson, SC, USA, 19 August 2005; pp. 335–339.
- Sakurada, S.; Shutoh, N. Thermoelectric properties of the Tix(Zr0.5Hf0.5)1−xNiSn half-Heusler compounds. J. Alloys Compd. 2005, 389, 204–208.
- Zhou, M.; Feng, C.; Chen, L.; Huang, X. Effects of partial substitution of Co by Ni on the high-temperature thermoelectric properties of TiCoSb-based half-Heusler compounds. J. Alloys Compd. 2005, 391, 194–197.
- Chen, L.D.; Huang, X.Y.; Zhou, M.; Shi, X.; Zhang, W.B. The high temperature thermoelectric performances of Zr0.5Hf0.5Ni0.8Pd0.2Sn0.99Sb0.01 alloy with nanophase inclusions. J. Appl. Phys. 2006, 99, 064305.
- Culp, S.R.; Poon, S.J.; Hickman, N.; Tritt, T.M.; Blumm, J. Effect of substitutions on the thermoelectric figure of merit of half-Heusler phases at 800 °C. Appl. Phys. Lett. 2006, 88, 042106.
- Kimura, Y.; Zama, A.; Mishima, Y. Thermoelectric properties of p-type half-Heusler compounds HfPtSn and ZrPtSn. In Proceedings of the Twentyfifth International Conference on Thermoelectrics, Vienna, Austria, 6 August 2006; pp. 115–119.
- Ono, Y.; Inayama, S.; Adachi, H.; Kajitani, T. Thermoelectric properties of doped half-Heuslers NbCoSn1−xSbx and Nb0.99Ti0.01CoSn1−xSbx. JPN J. Appl. Phys. 2006, 45, 8740–8743.
- Sekimoto, T.; Kurosaki, K.; Muta, H.; Yamanaka, S. Thermoelectric and thermophysical properties of ErPdX (X = Sb and Bi) half-Heusler compounds. J. Appl. Phys. 2006, 99, 103701.
- Sekimoto, T.; Kurosaki, K.; Muta, H.; Yamanaka, S. Thermoelectric properties of (Ti,Zr)CoSnxSb1−x half-Heusler compounds. In Proceedings of the Twentyfifth International Conference on Thermoelectrics, Vienna, Austria, 6 August 2006; pp. 128–131.
- Sekimoto, T.; Kurosaki, K.; Muta, H.; Yamanaka, S. Thermoelectric properties of Sn-doped TiCoSb half-Heusler compounds. J. Alloys Compd. 2006, 407, 326–329.
- Sekimoto, T.; Kurosaki, K.; Muta, H.; Yamanaka, S. Thermoelectric and thermophysical properties of TiCoSb-ZrCoSb-HfCoSb pseudo ternary system prepared by spark plasma sintering. Mater. Trans. 2006, 47, 1445–1448.
- Katsuyama, S.; Matsuo, R.; Ito, M. Thermoelectric properties of half-Heusler alloys Zr1−xYxNiSn1−ySby. J. Alloys Compd. 2007, 428, 262–267.
- Kim, S.-W.; Kimura, Y.; Mishima, Y. High temperature thermoelectric properties of TiNiSn-based half-Heusler compounds. Intermetallics 2007, 15, 349–356.
- Sekimoto, T.; Kurosaki, K.; Muta, H.; Yamanaka, S. Thermoelectric properties of half-Heusler Type LaPdBi and GdPdBi. Mater. Trans. 2007, 48, 2079–2082.
- Sekimoto, T.; Kurosaki, K.; Muta, H.; Yamanaka, S. High-thermoelectric figure of merit realized in p-type half-Heusler compounds: ZrCoSnxSb1−x. JPN J. Appl. Phys. 2007, 46, L673–L675.
- Wu, T.; Jiang, W.; Li, X.; Zhou, Y.; Chen, L. Thermoelectric properties of p-type Fe-doped TiCoSb half-Heusler compounds. J. Appl. Phys. 2007, 102, 103705.
- Culp, R.S.; Simson, J.W.; Poon, S.J.; Ponnambalan, V.; Edwards, J.; Tritt, T.M. (Zr,Hf)Co(Sb,Sn) half-Heusler phases as high-temperature (>700 °C) p-type thermoelectric materials. Appl. Phys. Lett. 2008, 93, 022105.
- Kimura, Y.; Tamura, Y.; Kita, T. Thermoelectric properties of directionally solidified half-Heusler compound NbCoSn alloys. Appl. Phys. Lett. 2008, 92, 012105.
- Xie, W.; Jin, Q.; Tang, X. The preparation and thermoelectric properties of Ti0.5Zr0.25Hf0.25Co1−xNixSb half-Heusler compounds. J. Appl. Phys. 2008, 103, 043711.
- Kimura, Y.; Ueno, H.; Mishima, Y. Thermoelectric properties of directionally solidified half-Heusler (Ma0.5Mb0.5)NiSn (Ma, Mb = Hf, Zr, Ti) alloys. J. Electron. Mater. 2009, 38, 934–939.
- Muta, H.; Kanemitsu, T.; Kurosaki, K.; Yamanaka, S. High-temperature thermoelectric properties of Nb-doped MNiSn (M = Ti, Zr) half-Heusler compound. J. Alloys Compd. 2009, 469, 50–55.
- Qiu, P.; Huang, X.; Chen, X.; Chen, L. Enhanced thermoelectric performance by the combination of alloying and doping in TiCoSb-based half-Heusler compounds. J. Appl. Phys. 2009, 106, 103703.
- Wu, T.; Jiang, W.; Li, X.; Bai, S.; Liufu, S.; Chen, L. Effects of Ge doping on the thermoelectric properties of TiCoSb-based p-type half-Heusler compounds. J. Alloys Compd. 2009, 467, 590–594.
- Kenjo, T.; Kimura, Y.; Mishima, Y. Phase stability and thermoelectric properties of half-Heusler compounds (Ti,M)NiSn (M = Zr, Hf). Mater. Res. Soc. Symp. Proc. 2010, 1218, 43–48.
- Kim, I.-H.; Kwon, J.-C.; Lee, Y.-G.; Yoon, M.-S.; Ryu, S.-L.; Kim, W.-G.; Ur, S.-C. Synthesis and thermoelectric properties of half-Heusler Zr-Ni-Sn alloy processed by mechanically alloying and hot-pressing. In Materials Science Forum; Trans Tech Publications Ltd.: Stafa-Zurich, Switzerland, 2010; Volume 658, pp. 33–36.
- Kimura, Y.; Tanoguchi, T.; Kita, T. Vacancy site occupation by Co and Ir in half-Heusler ZrNiSn and conversion of the thermoelectric properties from n-type to p-type. Acta Mater. 2010, 58, 4354–4361.
- Ouardi, S.; Fecher, G.H.; Balke, B.; Kozina, X.; Stryganyuk, G.; Felser, C. Electronic transport properties of electron- and hole-doped semiconducting C1bHeusler compounds: NiTi1-xMxSn (M = Sc, V). Phys. Rev. B 2010, 82, 085108.
- Zhu, T.J.; Xiao, K.; Yu, C.; Shen, J.J.; Yang, S.H.; Zhou, A.J.; Zhao, X.B.; He, J. Effect of yttrium doping on the thermoelectric properties of Hf0.6Zr0.4NiSn0.98Sb0.02 half-Heusler alloys. J. Appl. Phys. 2010, 108, 044903.
- Zou, M.; Li, J.F.; Guo, P.; Kita, T. Synthesis and thermoelectric properties of fine-grained VFeSb system half-Heusler compound polycrystals with high phase purity. J. Phys. D Appl. Phys. 2010, 43, 415403.
- Gelbstein, Y.; Tal, N.; Yarmek, A.; Rosenberg, Y.; Dariel, M.P.; Ouardi, S.; Balke, B.; Felser, C.; Köhne, M. Thermoelectric properties of spark plasma sintered composites based on TiNiSn half-Heusler alloys. J. Mater. Res. 2011, 26, 1919–1924.
- Joshi, G.; Yan, X.; Wang, H.; Liu, W.; Chen, G.; Ren, Z. Enhancement in thermoelectric figure-of-merit of an n-type half-Heusler compound by the nanocomposite approach. Adv. Energy Mater. 2011, 1, 643–647.
- Makongo, J.P.A.; Misra, D.K.; Zhou, X.Y.; Pant, A.; Shabetai, M.R.; Su, X.L.; Uher, C.; Stokes, K.L.; Poudeu, P.F.P. Simultaneous large enhancements in thermopower and electrical conductivity of bulk nanostructured half-Heusler alloys. J. Am. Chem. Soc. 2011, 133, 18843–18852.
- Makongo, J.P.A.; Misra, D.K.; Salvador, J.R.; Takas, N.J.; Wang, G.; Shabetai, M.R.; Pant, A.; Poudel, P.; Uher, C.; Stokes, K.L.; et al. Thermal and electronic charge transport in bulk nanostructured Zr0.25Hf0.75NiSn composites with full Heusler inclusions. J. Solid State Chem. 2011, 184, 2948–2960.
- Poon, S.J.; Wu, D.; Zhu, S.; Xie, W.; Tritt, T.M.; Venkatasubramanian, P.T.; Venkatasubramanian, R. Half-Heusler phases and nanocomposites as emerging high-ZT thermoelectric materials. J. Mater. Res. 2011, 26, 2795–2802.
- Schwall, M.; Balke, B. Niobium substitution in Zr0.5Hf0.5NiSn based Heusler compounds for high power factors. Appl. Phys. Lett. 2011, 98, 042106.
- Simonson, J.W.; Wu, D.; Xie, W.J.; Tritt, T.M.; Poon, S.J. Introduction of resonant states and enhancement of thermoelectric properties in half-Heusler alloys. Phys. Rev. B 2011, 83, 235211.
- Yan, X.; Joshi, G.; Liu, W.; Lan, Y.; Wang, H.; Lee, S.; Simonson, J.W.; Poon, S.J.; Tritt, T.M. Enhanced thermoelectric figure of merit of p-type half-Heuslers. Nano Lett. 2011, 11, 556–560.
- Douglas, J.E.; Birkel, C.S.; Miao, M.-S.; Torbet, C.J.; Stucky, G.D.; Pollock, T.M.; Seshadri, R. Enhanced thermoelectric properties of bulk TiNiSn via formation of a TiNi2Sn second phase. Appl. Phys. Lett. 2012, 101, 183902.
- Populoh, S.; Aguirre, M.H.; Brunko, O.C.; Galazka, K.; Lu, Y.; Weidenkaff, A. High figure of merit in (Ti,Zr,Hf)NiSn half-Heusler alloys. Scripta Mater. 2012, 66, 1073–1107.
- Xie, H.-H.; Mi, J.-L.; Hu, L.-P.; Lock, N.; Chirstensen, M.; Fu, C.-G.; Brummerstedt Iversen, B.; Zhao, X.-B.; Zhu, T.-J. Interrelation between atomic switching disorder and thermoelectric properties of ZrNiSn half-Heusler compounds. CrystEngComm 2014, 14, 4467–4471.
- Yan, X.; Liu, W.; Wang, H.; Chen, S.; Shiomi, J.; Esfarjani, K.; Wang, H.; Wang, D.; Chen, G.; Ren, Z. Stronger phonon scattering by larger differences in atomic mass and size in p-type half-Heuslers Hf1−xTixCoSb0.8Sn0.2. Energy Environ. Sci. 2012, 5, 7543–7548.
- Appel, O.; Schwall, M.; Mogilyansky, D.; Köhne, M.; Balke, B.; Gelbstein, Y. Effects of microstructural evolution on the thermoelectric properties of spark-plasma-sintered Ti0.3Zr0.35Hf0.35NiSn half-Heusler compound. J. Electron. Mater. 2013, 42, 1340–1345.
- Birkel, C.S.; Douglas, J.E.; Lettiere, B.R.; Seward, G.; Zhang, Y.; Pollock, T.M.; Seshadri, R.; Stucky, G.D. Influence of Ni nanoparticle addition and spark plasma sintering on the TiNiSn-Ni system: Structure, microstructure, and thermoelectric properties. Solid States Sci. 2013, 26, 16–22.
- Chen, S.; Lukas, K.C.; Liu, W.; Opeil, C.P.; Chen, G.; Ren, Z. Effect of Hf concentration on thermoelectric properties of nanostructured n-type half-Heusler materials HfxZr1−xNiSn0.99Sb0.01. Adv. Energy Mater. 2013, 3, 1210–1214.
- Downie, R.A.; MacLaren, D.A.; Smith, R.I.; Bos, J.W.G. Enhanced thermoelectric performance in TiNiSn-based half-Heuslers. Chem. Commun. 2013, 49, 4184–4186.
- Fu, C.; Xie, H.; Liu, Y.; Zhu, T.; Xie, J.; Zhao, X.B. Thermoelectric properties of FeVSb half-Heusler compounds by levitation melting and spark plasma sintering. Intermetallics 2013, 32, 39–43.
- Fu, C.; Liu, Y.; Xie, H.; Liu, X.; Zhao, X.; Snyder, J.G.; Xie, J.; Zhu, T. Electron and phonon transport in Co-doped FeV0.6Nb0.4Sb half-Heusler thermoelectric materials. J. Appl. Phys. 2013, 114, 134905.
- Schwall, M.; Balke, B. Phase separation as a key to a thermoelectric high efficiency. Phys. Chem. Chem. Phys. 2013, 15, 1868–1872.
- Xie, W.J.; Yan, Y.G.; Zhu, S.; Zhou, M.; Populoh, S.; Galazka, K.; Poon, S.J.; Weidenkaff, A.; He, J.; Tang, X.F.; et al. Significant ZT enhancement in p-type Ti(Co,Fe)Sb-InSb nanocomposites via a synergistic high-mobility electron injection, energy-filtering and boundary-scattering approach. Acta Mater. 2013, 61, 2087–2094.
- Xie, W.J.; Wang, H.; Pei, Y.; Fu, C.; Liu, X.; Snyder, J.G.; Zhao, X.; Zhu, T. Beneficial contribution of alloy disorder to electron and phonon transport in half-Heusler thermoelectric materials. Adv. Funct. Mater. 2013, 23, 5123–5130.
- Yan, X.; Liu, W.; Chen, S.; Wan, H.; Zhang, Q.; Chen, G.; Ren, Z. Thermoelectric property study of nanostructured p-type half-Heuslers (Hf,Zr,Ti)CoSb0.8Sn0.2. Adv. Energy Mater. 2013, 3, 1195–1200.
- Zou, M.; Li, J.F.; Kita, T. Thermoelectric properties of fine-grained FeVSb half-Heusler alloys tuned to p-type by substituting vanadium with titanium. J. Solid State Chem. 2013, 198, 125–130.
- Bartholome, K.; Balke, B.; Zuckermann, D.; Köhne, M.; Müller, M.; Tarantik, K.; König, J. Thermoelectric modules based on half-Heusler materials produced in large quantities. J. Electron. Mater. 2014, 43, 1775–1781.
- Downie, R.A.; Mac Laren, D.A.; Bos, J.-W.G. Thermoelectric performance of multiphase XNiSn (X = Ti, Zr, Hf) half-Heusler alloys. J. Mater. Chem. A 2014, 2, 6107–6114.
- Downie, R.A.; Popuri, S.R.; Ning, H.; Reece, M.J.; Bos, J.-W.G. Effect of spark plasma sintering on the structure and properties of Ti1−xZrxNiSn half-Heusler alloys. Materials 2014, 7, 7094–7104.
- Fu, C.; Zhu, T.; Pei, Y.; Xie, H.; Wang, H.; Snyder, G.J.; Liu, Y.; Liu, Y.; Zhao, X. High band degeneracy contributes to high thermoelectric performance in p-type half-Heusler compounds. Adv. Energy Mater. 2014, 4, 1400600.
- Gazka, K.; Populoh, S.; Xie, W.; Yoon, S.; Saucke, G.; Hulliger, J.; Weidenkaff, A. Improved thermoelectric performance of (Zr0.3Hf0.7)NiSn half-Heusler compounds by Ta substitution. J. Appl. Phys. 2014, 115, 183704.
- Hsu, C.-C.; Liu, Y.-N.; Ma, H.-K. Effect of the Zr0.5Hf0.5CoSb1−xSnx/HfO2 half-Heusler nanocomposites on the ZT value. J. Alloys Compd. 2014, 597, 217–222.
- Joshi, G.; He, R.; Engber, M.; Samsonidze, G.; Pantha, T.; Dahal, E.; Dahal, K.; Yang, J.; Lan, Y.; Kozinsky, B.; et al. NbFeSb-based p-type half-Heuslers for power generation applications. Energy Environ. Sci. 2014, 7, 4070–4076.
- Krez, J.; Schmitt, J.; Snyder, G.J.; Felser, C.; Hermes, W.; Schwind, M. Optimization of the carrier concentration in phase-separated half-Heusler compounds. J. Mater. Chem. A 2014, 2, 13513–13518.
- Misra, D.K.; Bhardwaj, A.; Singh, S. Enhanced thermoelectric performance of a new half-Heusler derivative Zr9Ni7Sn8 bulk nanocomposite: Enhanced electrical conductivity and low thermal conductivity. J. Mater. Chem. A 2014, 2, 11913–11921.
- Rausch, E.; Balke, B.; Ouardi, S.; Felser, C. Enhanced thermoelectric performance in the p-type half-Heusler (Ti,Zr,Hf)CoSb0.8Sn0.2 system via phase separation. Phys. Chem. Chem. Phys. 2014, 16, 25258–25262.
- Akram, R.; Zhang, Q.; Yang, D.; Zheng, Y.; Yan, Y.; Su, X.; Tang, X. Enhanced thermoelectric properties of La-doped ZrNiSn half-Heusler compound. J. Electron. Mater. 2015, 44, 3563–3570.
- Appel, O.; Zilber, T.; Kalabukhov, S.; Beerib, O.; Gelbstein, Y. Morphological effects on the thermoelectric properties of Ti0.3Zr0.35Hf0.35Ni1+δSn alloys following phase separation. J. Mater. Chem. C 2015, 3, 11653–11659.
- Chai, Y.W.; Oniki, T.; Kimura, Y. Microstructure and thermoelectric properties of a ZrNi1.1Sn half-Heusler alloy. Acta Mater. 2015, 85, 290–300.
- Chen, L.; Gao, S.; Zeng, X.; Mehdizadeh Dehkordi, A.; Tritt, T.M.; Poon, S.J. Uncovering high thermoelectric figure of merit in (Hf,Zr)NiSn half-Heusler alloys. Appl. Phys. Lett. 2015, 107, 041902.
- Fu, C.; Zhu, T.; Liu, Y.; Xie, H.; Zhao, X. Band engineering of high-performance p-type FeNbSb based half-Heusler thermoelectric materials for figure of merit ZT > 1. Energy Environ. Sci. 2015, 8, 216–220.
- Fu, C.; Bai, S.; Liu, Y.; Tang, Y.; Chen, L.; Zhao, X.; Zhu, T. Realizing high figure of merit in heavy-band p-type half-Heusler thermoelectric materials. Nat. Commun. 2015, 6, 8144–8151.
- Hattori, K.; Miyazaki, H.; Yoshida, K.; Inukai, M.; Nishino, Y. Direct observation of the electronic structure in thermoelectric half-Heusler alloys Zr1−xMxNiSn (M = Y and Nb). J. Appl. Phys. 2015, 117, 205102.
- He, R.; Kim, H.S.; Lan, Y.; Wang, D.; Chen, S.; Ren, Z. Investigating the thermoelectric properties of p-type half-Heusler Hfx(Zr,Ti)1−xCoSb0.8Sn0.2 by reducing Hf concentration for power generation. RSC Adv. 2015, 4, 64711–64716.
- Huang, L.; He, R.; Chen, S.; Zhang, H.; Dahal, K.; Zhou, H.; Wang, H.; Zhang, Q.; Ren, Z. A new n-type half-Heusler thermoelectric material NbCoSb. Mater. Res. Bull. 2015, 70, 773–778.
- Huang, L.; Wang, Y.; Shuai, J.; Zhang, H.; Yang, S.; Zhang, Q.; Ren, Z. Thermal conductivity reduction by isoelectronic elements V and Ta for partial substitution of Nb in half-Heusler Nb(1−x)/2V(1−x)/2TaxCoSb. RSC Adv. 2015, 5, 102469–102476.
- Li, S.; Zhao, H.; Li, D.; Jin, S.; Gu, L. Synthesis and thermoelectric properties of half-Heusler alloy YNiBi. J. Appl. Phys. 2015, 117, 205101–205108.
- Liu, Y.; Xie, H.; Fu, C.; Snyder, G.J.; Zhao, X.; Zhu, T. Demonstration of a phonon-glass electron-crystal strategy in (Hf,Zr)NiSn half-Heusler thermoelectric materials by alloying. J. Mater. Chem. A 2015, 3, 22716–22722.
- Rausch, E.; Balke, B.; Stahlhofen, J.M.; Ouardi, S.; Burkhardt, U.; Felser, C. Fine tuning of thermoelectric performance in phase-separated half-Heusler compounds. J. Mater. Chem. C 2015, 3, 10409.
- Rausch, E.; Balke, B.; Ouardi, S.; Felser, C. Long-term stability of (Ti,Zr,Hf)CoSb1−xSnx thermoelectric p-type half-Heusler compounds upon thermal cycling. Energy Technol. 2015, 3, 1217–1224.
- Schmitt, J.; Gibbs, Z.M.; Snyder, G.J.; Felser, C. Resolving the true band gap of ZrNiSn half-Heusler thermoelectric materials. Sci. Rep. 2015, 4, 6888.
- Xie, H.; Wang, H.; Fu, C.; Liu, Y.; Snyder, G.J.; Zha, X.; Zhu, T. The intrinsic disorder related alloy scattering in ZrNiSn half-Heusler thermoelectric materials. Nature Commun. Sci. Rep. 2014, 4, 6888.
- Akram, R.; Yan, Y.; Yang, D.W.; She, X.Y.; Zheng, G.; Su, X.L.; Tang, X.F. Microstructure and thermoelectric properties of Sb doped Hf0.25Zr0.75NiSn half-Heusler compounds with improved carrier mobility. Intermetallics 2016, 74, 1–7.
- Chai, Y.W.; Oniki, T.; Kenjo, T.; Kimura, Y. The effect of an isoelectronic Ti-Zr substitution on Heusler nanoprecipitation and the thermoelectric properties of a (Ti0.2Zr0.8)Ni1.1Sn half-Heusler alloy. J. Alloys Compd. 2016, 662, 566–577.
- Chauhan, N.S.; Bhardwaj, A.; Senguttuvan, T.D.; Pant, R.P.; Mallik, R.C.; Misra, D.K. A synergistic combination of atomic scale structural engineering and panoscopic approach in p-type ZrCoSb-based half-Heusler thermoelectric materials for achieving high ZT. J. Mater. Chem. C 2016, 4, 5766–5778.
- Chen, L.; Zeng, X.; Tritt, T.M.; Poon, S.J. Half-Heusler alloys for efficient thermoelectric power conversion. J. Electron. Mater. 2016, 45, 5554–5556.
- Fu, C.; Wu, H.; Liu, Y.; He, J.; Zhao, X.; Zhu, T. Enhancing the figure of merit of heavy-band thermoelectric materials through hierarchical phonon scattering. Adv. Sci. 2016, 3, 1600035.
- Gürth, M.; Rogl, G.; Romaka, V.V.; Grytsiv, A.; Bauer, E.; Rogl, P. Thermoelectric high ZT half-Heusler alloys Ti1−x−yZrxHfyNiSn. Acta Mater. 2016, 104, 210–222.
- He, R.; Huang, L.; Wang, Y.; Samsonidze, G.; Kozinsky, B.; Zhang, Q.; Ren, Z. Enhanced thermoelectric properties of n-type NbCoSn half-Heusler by improving phase purity. Appl. Mater. 2016, 4, 104804.
- He, R.; Kraemer, D.; Mao, J.; Zeng, L.; Jie, Q.; Lan, Y.; Li, C.; Shuai, J.; Kim, H.S.; Liu, Y.; et al. Achieving high power factor and output power density in p-type half-Heuslers Nb1−xTixFeSb. Proc. Natl. Acad. Soc. USA 2016, 113, 13576–13581.
- Huang, L.; Zhang, Q.; Yuan, B.; Lai, X.; Yan, X.; Ren, Z. Recent progress in half-Heusler thermoelectric materials. Mater. Res. Bull. 2016, 76, 107–112.
- Liu, Y.; Makongo, J.P.A.; Page, A.; Sahoo, P.; Uher, C.; Stokes, K.; Poudeu, P.F.P. Distribution of impurity states and charge transport in Zr0.25Hf0.75Ni1+xSn1−ySby nanocomposites. J. Solid State Chem. 2016, 234, 72–86.
- Rogl, G.; Grytsiv, A.; Gürth, M.; Tavassoli, A.; Ebner, C.; Wünschek, A.; Puchegger, S.; Soprunyuk, V.; Schranz, W.; Bauer, E.; et al. Mechanical properties of half-Heusler alloys. Acta Mater. 2016, 107, 178–195.
- Visconti, A.; Bernard-Granger, G.; Navone, C.; Leforestier, J.; Mingo, N. Microstructure investigations and thermoelectric properties of an n-type half-Heusler alloy sintered by spark plasma sintering. Scripta Mater. 2016, 123, 100–104.
- Zhang, H.; Wang, Y.; Huang, L.; Chen, S.; Dahal, H.; Wang, D.; Ren, Z. Synthesis and thermoelectric properties of n-type half-Heusler compound VCoSb with valence electron count of 19. J. Alloys Compd. 2016, 654, 321–326.
- Zhang, H.; Wang, Y.; Dahal, H.; Mao, J.; Huang, L.; Zhang, Q.; Ren, Z. Thermoelectric properties of n-type half-Heusler compounds (Hf0.25Zr0.75)1−xNbxNiSn. Acta Mater. 2016, 113, 41–47.
- Berry, T.; Ouardi, S.; Fecher, G.H.; Balke, B.; Kreiner, G.; Auffermann, G.; Schnelle, W.; Felser, C. Improving thermoelectric performance of TiNiSn by mixing MnNiSb in the half-Heusler structure. Phys. Chem. Chem. Phys. 2017, 19, 1543–1550.
- Berry, T.; Fu, C.; Auffermann, G.; Fecher, G.H.; Schnelle, W.; Serrano-Sanchez, F.; Yue, Y.; Liang, H.; Felser, C. Enhancing thermoelectric performance of TiNiSn half-Heusler compounds via modulation doping. Chem. Mater. 2017, 29, 7042–7048.
- Chen, L.; Liu, Y.; He, J.; Tritt, T.M.; Poon, S.J. High thermoelectric figure of merit by resonant dopant in half-Heusler alloys. AIP Adv. 2017, 7, 065208.
- He, R.; Zhu, H.; Sun, J.; Mao, J.; Reith, H.; Chen, S.; Schierning, G.; Nielsch, K.; Ren, Z. Improved thermoelectric performance of n-type half-Heusler MCo1−xNixSb (M = Hf, Zr). Mater. Today Phys. 2017, 1, 24–30.
- Huang, L.; Zhang, Q.; Wang, Y.; He, R.; Shuai, J.; Zhang, J.; Wang, C.; Ren, Z. The effect of Sn doping on thermoelectric performance of n-type half-Heusler NbCoSb. Phys. Chem. Chem. Phys. 2017, 19, 25683–25690.
- Kim, K.S.; Kim, Y.M.; Mun, H.; Kim, J.; Park, J.; Borisevich, A.Y.; Lee, K.H.; Kim, S.W. Direct observation of inherent atomic-scale defect disorders responsible for high performance Ti1−xHfxNiSn1−ySby half-Heusler thermoelectric alloys. Adv. Mater. 2017, 29, 170209.
- Lkhagvasuren, E.; Ouardi, S.; Fecher, G.H.; Auffermann, G.; Kreiner, G.; Schnelle, W.; Felser, C. Optimized thermoelectric performance of the n-type half-Heusler material TiNiSn by substitution and addition of Mn. AIP Adv. 2017, 7, 045010.
- Mao, J.; Zhou, J.; Zhu, H.; Liu, Z.; Zhang, H.; He, R.; Chen, G.; Ren, Z. Thermoelectric properties of n type ZrNiPb-based half-Heuslers. Chem. Mater. 2017, 29, 867–872.
- Rogl, G.; Sauerschnig, P.; Rykavets, Z.; Romaka, V.V.; Heinrich, P.; Hinterleitner, B.; Grytsiv, A.; Bauer, E.; Rogl, P. (V,Nb)-doped half Heusler alloys based on NiSn with high ZT. Acta Mater. 2017, 131, 336–348.
- Silpawilawan, W.; Kurosaki, K.; Ohishi, Y.; Muta, H.; Yamanaka, S. FeNbSb p-type half-Heusler compound: Beneficial thermomechanical properties and high temperature stability for thermoelectrics. J. Mater. Chem. C 2017, 5, 6677–6681.
- Tavassoli, A.; Failamani, F.; Grytsiv, A.; Rogl, G.; Heinrich, P.; Müller, H.; Bauer, E.; Zehetbauer, M.; Rogl, P. On the half-Heusler compounds Nb1−xxFeSb: Phase relations, thermoelectric properties at low and high temperature, and mechanical properties. Acta Mater. 2017, 135, 263–276.
- Visconti, A.; Navone, C.; Leforestier, J.; Mingo, N.; Bernard-Grange, G. Influence of the addition of HfO2 particles on the thermoelectric properties of an n-type half-Heusler alloy sintered by spark plasma sintering. J. Alloys Compds. 2017, 709, 36–41.
- Yu, J.; Fu, C.; Liu, Y.; Xia, K.; Aydemir, U.; Chasapis, T.C.; Snyder, G.J.; Zhao, X.; Zhu, T. Unique role of refractory Ta alloying in enhancing the figure of merit of NbFeSb thermoelectric materials. Adv. Energy Mater. 2017, 8, 1701313.
- Zeier, W.G.; Anand, S.; Huang, L.; He, R.; Zhang, H.; Ren, Z.; Wolverton, C.; Snyder, G.J. Using the 18-electron rule to understand the nominal 19-electron half-Heusler NbCoSb with Nb vacancies. Chem. Mater. 2017, 29, 1210–1217.
- Barczak, S.A.; Halpin, J.E.; Buckman, J.; Decourt, R.; Pollet, M.; Smith, R.I.; MacLaren, D.A.; Bos, J.-W.G. Grain-by-grain compositional variations and interstitial metals—A new route toward achieving high performance in half-Heusler thermoelectrics. ACS Appl. Mater. Interfaces 2018, 10, 4786–4793.
- Chauhan, N.S.; Bathula, S.; Vishwakarma, A.; Bhardwaj, R.; Gahtori, B.; Srivastava, A.K.; Saravanan, M.; Dhar, A. A nanocomposite approach for enhancement of thermoelectric performance in hafnium-free half-Heuslers. Materialia 2018, 1, 168–174.
- Chauhan, N.S.; Bathula, S.; Vishwakarma, A.; Bhardwaj, R.; Johari, K.K.; Gahtori, B.; Saravanan, M.; Dhar, A. Compositional tuning of ZrNiSn half-Heusler alloys: Thermoelectric characteristics and performance analysis. J. Phys. Chem. Solids 2018, 123, 105–112.
- Chauhan, N.S.; Bathula, S.; Vishwakarma, A.; Bhardwaj, R.; Gahtori, B.; Kumar, A.; Dhar, A. Vanadium-doping-induced resonant energy levels for the enhancement of thermoelectric performance in Hf-free ZrNiSn half-Heusler alloys. ACS Appl. Energy Mater. 2018, 1, 757–764.
- Chauhan, N.S.; Bathula, S.; Vishwakarma, A.; Bhardwaj, R.; Johari, K.K.; Gahtori, B.; Dhar, A. Facile fabrication of p- and n-type half-Heusler alloys with enhanced thermoelectric performance and low specific contact resistance employing spark plasma sintering. Mater. Lett. 2018, 228, 250–253.
- Hu, C.; Xia, K.; Chen, X.; Zhao, X.; Zhu, T. Transport mechanisms and property optimization of p-type (Zr,Hf)CoSb half-Heusler thermoelectric materials. Mater. Today Phys. 2018, 7, 69–76.
- Liu, Y.; Fu, C.; Xia, K.; Chen, X.; Zhao, X.; Zhu, T. Lanthanide contraction as a design factor for high-performance half-Heusler thermoelectric materials. Adv. Mater. 2018, 30, 1800881.
- Mallick, M.M.; Vitt, S. Enhancing the thermoelectric performance of a p-type half-Heusler alloy, HfCoSb by incorporation of a band-matched chalcogenide, Cu2Te. J. Mater. Chem. A 2018, 6, 14709–14716.
- Ren, W.; Zhu, H.; Zhu, Q.; Saparamadu, U.; He, R.; Liu, Z.; Mao, J.; Wang, C.; Nielsch, K.; Wang, Z.; et al. Ultrahigh power factor in thermoelectric system Nb0.95M0.05FeSb (M = Hf, Zr, and Ti). Adv. Sci. 2018, 5, 1800278.
- Rogl, G.; Yubuta, K.; Romaka, V.V.; Michor, H.; Schafler, E.; Grytsiv, A.; Bauer, E.; Rogl, P. High-ZT half-Heusler thermoelectrics, Ti0.5Zr0.5NiSn and Ti0.5Zr0.5NiSn0.98Sb0.02: Physical properties at low temperatures. Acta Mater. 2018, 166, 466–483.
- Shen, J.; Fu, C.; Liu, Y.; Zhao, X.; Zhu, T. Enhancing thermoelectric performance of FeNbSb half-Heusler compound by Hf-Ti dual doping. Energy Storage Mater. 2018, 10, 69–74.
- Silpawilawan, W.; Ohishi, Y.; Muta, H.; Yamanaka, S.; Kurosaki, K. Thermoelectric properties of p-type half-Heusler compounds FeNb0.9M0.1Sb (M = Ti, Zr, Hf). Mater. Trans. 2018, 59, 1030–1034.
- Tavassoli, A.; Grytsiv, A.; Rogl, G.; Romaka, V.V.; Michor, H.; Reissner, M.; Bauer, E.; Zehetbauer, M.; Rogl, P. The half- Heusler system Ti1+xFe1.33−xSb—TiCoSb with Sb/Sn substitution: Phase relations, crystal structures and thermoelectric properties. Dalton Trans. 2018, 47, 879–897.
- Xia, K.; Liu, Y.; Anand, S.; Snyder, G.J.; Xin, J.; Yu, J.; Zhao, X.; Zhu, T. Enhanced thermoelectric performance in 18-electron Nb0.8CoSb half-Heusler compound with intrinsic Nb vacancies. Adv. Funct. Mater. 2018, 28, 1705845.
- Yan, Y.; Geng, W.; Qiu, J.; Ke, H.; Luo, C.; Yang, J.; Uher, C.; Tang, X. Thermoelectric properties of n-type ZrNiSn prepared by rapid non-equilibrium laser processing. RSC Adv. 2018, 8, 15796–15803.
- Zhao, D.; Zou, M.; Bo, L.; Wang, Y. Synthesis and thermoelectric properties of Pd-doped ZrCoBi half-Heusler compounds. Materials 2018, 11, 728–737.
- Zhu, T.; Fu, C.; Zhao, X. High figure of merit p-type FeNbHfSb thermoelectric material and the preparation method thereof. United States Patent US2018/0331268A1, 15 November 2018.
- Zhu, H.; He, R.; Mao, J.; Zhu, Q.; Li, C.; Sun, J.; Ren, W.; Wang, Y.; Liu, Z.; Tang, Z.; et al. Discovery of ZrCoBi based half-Heuslers with high thermoelectric conversion efficiency. Nat. Commun. 2018, 9, 2497.
- Barczak, S.A.; Quinn, R.J.; Halpin, J.E.; Domosud, K.; Smith, R.I.; Baker, A.R.; Don, E.; Forbes, I.; Refson, K.; MacLaren, D.A.; et al. Suppression of thermal conductivity without impeding electron mobility in n-type XNiSn half-Heusler thermoelectrics. J. Mater. Chem. A 2019, 7, 27124–27134.
- Chauhan, N.S.; Bathula, S.; Gahtori, B.; Mahanti, S.D.; Bhattacharya, A.; Vishwakarma, A.; Bhardwaj, R.; Singh, V.N.; Dhar, A. Compositional tailoring for realizing high thermoelectric performance in hafnium-free n type ZrNiSn half-Heusler alloys. ACS Appl. Mater. Interfaces 2019, 11, 47830–47836.
- Du, N.V.; Rahman, J.U.; Meang, E.-J.; Lim, C.-H.; Shin, W.H.; Seo, W.-S.; Huy, P.T.; Kim, M.H.; Lee, S. Synthesis and thermoelectric properties of Ti-substituted (Hf0.5Zr0.5)1−xTixNiSn0.998Sb0.002 half-Heusler compounds. J. Alloys Compd. 2019, 773, 1141–1145.
- Ferluccio, D.A.; Halpin, J.E.; MacIntosh, K.L.; Quinn, R.J.; Don, E.; Smith, R.I.; MacLaren, D.A.; Bos, J.-W.G. Low thermal conductivity and promising thermoelectric performance in AxCoSb (A = V, Nb or Ta) half-Heuslers with inherent vacancies. J. Mater. Chem. C 2019, 7, 6539–6547.
- Gong, B.; Li, Y.; Liu, F.; Zhu, J.; Wang, X.; Ao, W.; Zhang, C.; Li, J.; Xie, H.; Zhu, T. Continuously enhanced structural disorder to suppress the lattice thermal conductivity of ZrNiSn-based half-Heusler alloys by multielement and multisite alloying with very low Hf content. ACS Appl. Mater. Interfaces 2019, 11, 13397–13404.
- Grytsiv, A.; Romaka, V.V.; Watson, N.; Rogl, G.; Michor, H.; Hinterleitner, B.; Puchegger, S.; Bauer, E.; Rogl, P. Thermoelectric half-Heusler compounds TaFeSb and Ta1−xTixFeSb (0 ≤ x ≤ 0.11): Formation and physical properties. Intermetallics 2019, 111, 106468.
- Huang, L.; Wang, J.; Mo, X.; Lei, X.; Ma, S.; Wang, C.; Zhang, Q. Improving the thermoelectric properties of the half-Heusler compound VCoSb by vanadium vacancy. Materials 2019, 12, 1637.
- Joshi, H.; Rai, D.P.; Hnamte, L.; Laref, A.; Thapa, R.K. A theoretical analysis of elastic and optical properties of half-Heusler MCoSb (M = Ti, Zr and Hf). Heliyon 2019, 5, e01155.
- Karati, A.; Mukherjee, S.; Mallik, R.C.; Shabadi, R.; Murty, B.S.; Varadaraju, U.V. Simultaneous increase in thermopower and electrical conductivity through Ta-doping and nanostructuring in half-Heusler TiNiSn alloys. Materialia 2019, 7, 100410.
- Karati, A.; Nagini, M.; Ghosh, S.; Shabadi, R.; Pradeep, K.G.; Mallik, R.C.; Murty, B.S.; Varadaraju, U.V. Ti2NiCoSnSb—A new half-Heusler type high-entropy alloy showing simultaneous increase in Seebeck coefficient and electrical conductivity for thermoelectric applications. Sci. Rep. 2019, 9, 5331–5343.
- Li, S.; Zhu, H.; Mao, J.; Feng, Z.; Li, X.; Chen, C.; Cao, F.; Liu, X.; Singh, D.J.; Ren, Z.; et al. N-type TaCoSn-based half-Heuslers as promising thermoelectric materials. ACS Appl. Mater. Interfaces 2019, 11, 41321–41329.
- Mallik, M.M.; Rajput, K.; Vitta, S. Increasing figure-of-merit of ZrNiSn half-Heusler alloy by minimal substitution and thermal conductivity reduction. J. Mater. Sci. Mater. Electron. 2019, 30, 6139–6147.
- Qiu, Q.; Liu, Y.; Xia, K.; Fang, T.; Yu, J.; Zhao, X.; Zhu, T. Grain boundary scattering of charge transport in n-type (Hf,Zr)CoSb half-Heusler thermoelectric materials. Adv. Energy Mater. 2019, 9, 1803447.
- Shen, J.; Wang, Z.; Chu, J.; Bai, S.; Zha, X.; Chen, L.; Zhu, T. Low contact resistivity and interfacial behavior of p-type NbFeSb/Mo thermoelectric junction. ACS Appl. Mater. Interfaces 2019, 11, 14182–14190.
- Shen, J.; Fan, L.; Hu, C.; Zhu, T.; Xin, J.; Fu, T.; Zhao, D.; Zhao, X. Enhanced thermoelectric performance in the n-type NbFeSb half-Heusler compound with heavy element Ir doping. Mater. Today Phys. 2019, 8, 62–70.
- Synoradzki, K.; Ciesielski, K.; Veremchuk, I.; Borrmann, H.; Skokowski, P.; Szymanski, D.; Grin, Y.; Kaczorowski, D. Thermal and electronic transport properties of the half-Heusler phase ScNiSb. Materials 2019, 12, 1723–1734.
- Xia, K.; Nan, P.; Tan, S.; Wang, Y.; Ge, B.; Zhang, W.; Anand, S.; Zhao, X.; Snyder, G.J.; Zhu, T. Short-range order in defective half-Heusler thermoelectric crystals. Energy Environ. Sci. 2019, 12, 1568–1574.
- Zhu, H.; Mao, J.; Feng, Z.; Sun, J.; Zhu, Q.; Liu, Z.; Singh, D.J.; Wang, Y.; Ren, Z. Understanding the asymmetrical thermoelectric performance for discovering promising thermoelectric materials. Sci. Adv. 2019, 5, eaav5813.
- Zhu, H.; Mao, J.; Li, Y.; Sun, J.; Wang, Y.; Zhu, Q.; Li, G.; Song, Q.; Zhou, J.; Fu, Y.; et al. Discovery of TaFeSb-based half-Heuslers with high thermoelectric performance. Nat. Commun. 2019, 10, 270–278.
- Bae, W.; Hwang, J.Y.; Kim, S.-I.; Jeong, H.M.; Kim, S.; Lim, J.-H.; Kim, H.S.; Lee, K.H. Thermoelectric transport properties of n-Type Sb-doped (Hf,Zr,Ti)NiSn half-Heusler alloys prepared by temperature-regulated melt spinning and spark plasma sintering. Appl. Sci. 2020, 10, 4963–4970.
- Chauhan, N.S.; Raghuvanshi, P.R.; Tyagi, K.; Johari, K.K.; Tyagi, L.; Gahtori, B.; Bathula, S.; Bhattacharya, A.; Mahanti, S.D.; Singh, V.N.; et al. Defect engineering for enhancement of thermoelectric performance of (Zr,Hf)NiSn-based n-type half-Heusler alloys. J. Phys. Chem. C 2020, 124, 8584–8593.
- Ciesielski, K.; Synoradzki, K.; Veremchuk, I.; Skokowski, P.; Szymański, D.; Grin, Y.; Kaczorowski, D. Thermoelectric performance of the half-Heusler phases RNiSb (R = Sc, Dy, Er, Tm, Lu): High mobility ratio between majority and minority charge carriers. Phys. Rev. Appl. 2020, 14, 054046.
- El-Khouly, A.; Novitskii, A.; Adam, A.M.; Sedegov, A.; Kalugina, A.; Pankratova, D.; Karpenkov, D.; Khovaylo, V. Transport and thermoelectric properties of Hf-doped FeVSb half-Heusler alloys. J. Alloys Compd. 2020, 820, 153413.
- El-Khouly, A.; Novitskii, A.; Serhiienko, I.; Kalugina, A.; Sedegov, A.; Karpenkov, D.; Voronin, A.; Khovaylo, V.; Adam, A.M. Optimizing the thermoelectric performance of FeVSb half-Heusler compound via Hf-Ti double doping. J. Power Sources 2020, 477, 228768.
- Fang, T.; Xia, K.; Nan, P.; Ge, B.; Zhao, X.; Zhu, T. A new defective 19-electron TiPtSb half-Heusler thermoelectric compound with heavy band and low lattice thermal conductivity. Mater. Today Phys. 2020, 13, 100200.
- Graziosi, P.; Kumarasinghe, C.; Neophytou, N. Material descriptors for the discovery of efficient thermoelectrics. ACS Appl. Energy Mater. 2020, 3, 5913–5926.
- Johari, K.K.; Bhardwaj, R.; Chauhan, N.S.; Gahtori, B.; Bathula, S.; Auluck, S.; Dhakate, S.R. Band structure modification and mass fluctuation effects of isoelectronic germanium-doping on thermoelectric properties of ZrNiSn. ACS Appl. Mater. 2020, 3, 1349–1357.
- Kang, H.B.; Poudel, B.; Li, W.; Lee, H.; Saparamadu, U.; Nozariasbmarz, A.; Kang, M.G.; Gupta, A.; Heremans, J.; Priy, S. Decoupled phononic-electronic transport in multi-phase n-type half-Heusler nanocomposites enabling efficient high temperature power generation. Mater. Today 2020, 36, 63–72.
- Karati, A.; Hariharan, V.S.; Ghosh, S.; Prasad, A.; Nagini, M.; Guruvidyathri, K.; Mallik, R.C.; Shabadi, R.; Bichler, L.; Murty, B.S.; et al. Thermoelectric properties of half-Heusler high-entropy Ti2NiCoSn1−xSb1+x (x = 0.5, 1) alloys with VEC > 18. Scripta Mater. 2020, 186, 375–380.
- Li, S.; Bai, F.; Wang, R.; Chen, C.; Li, X.; Cao, F.; Sui, J.; Liu, X.; Ren, Z.; Zhang, Q. Titanium doping to enhance thermoelectric performance of 19-electron VCoSb half-Heusler compounds with vanadium vacancies. Ann. Phys. 2020, 525, 1900440.
- Li, N.; Zhu, H.; He, W.; Zhang, B.; Cui, W.; Hu, Z.-Y.; Sang, X.; Lu, X.; Wang, G.; Zhou, X. Realizing both n- and p-types of high thermoelectric performance in Fe1-xNixTiSb half-Heusler compounds. J. Mater. Chem. C 2020, 8, 3156–3164.
- Pedersen, S.V.; Croteau, J.R.; Kempf, N.; Zhang, Y.; Butt, D.P.; Jaques, B.J. Novel synthesis and processing effects on the figure of merit for NbCoSn, NbFeSb, and ZrNiSn based half-Heusler thermoelectrics. J. Solid State Chem. 2020, 285, 121203.
- Serrano-Sanchez, F.; Luo, T.; Yu, J.; Xie, W.; Le, C.; Auffermann, G.; Weidenkaff, A.; Zhu, T.; Zhao, X.; Alonso, J.A.; et al. Thermoelectric properties of n-type half-Heusler NbCoSn with heavy-element Pt substitution. J. Mater. Chem. A 2020, 8, 14822–14828.
- Yang, X.; Jiang, Z.; Kang, H.; Chen, Z.; Guo, E.; Liu, D.; Yang, F.; Li, R.; Jiang, X.; Wang, T. Enhanced thermoelectric performance of Zr1−xTaxNiSn half-Heusler alloys by diagonal-rule doping. ACS Appl. Mater. Interfaces 2020, 12, 3773–3783.
- Yu, J.; Xing, Y.; Hu, C.; Huang, Z.; Qiu, Q.; Wang, C.; Xia, K.; Wang, Z.; Bai, S.; Zhao, X.; et al. Half-Heusler thermoelectric module with high conversion efficiency and high-power density. Adv. Energy Mater. 2020, 10, 2000888.
- Wang, R.-F.; Li, S.; Xue, W.-H.; Chen, C.; Wang, Y.-M.; Liu, X.-J.; Zhang, Q. Enhanced thermoelectric performance of n-type TiCoSb half- Heusler by Ta doping and Hf alloying. Rare Met. 2021, 40, 40–47.
- Zelenka, F.; Brož, P.; Vrestal, J.; Bursik, J.; Zemanova, A.; Rogl, G.; Rogl, P. Study of thermal stability of half-Heusler alloys TiFe1.33Sb and TixNb1−xFeSb (x = 0, 0.15) by differential thermal analysis and Knudsen effusion method. Calphad 2021, 74, 102292.
- Guo, S.; Anad, S.; Brod, M.K.; Zhang, Y.; Snyder, G.J. Conduction band engineering of half-Heusler thermoelectrics using orbital chemistry. J. Mater. Chem. A 2022, 10, 3051.
- Karati, A.; Ghosh, S.; Nagini, M.; Mallik, R.C.; Shabadi, R.; Murty, B.S.; Varadaraju, U.V. Thermoelectric properties of nanocrystalline half-Heusler high-entropy Ti2NiCoSn1−xSb1+x(x = 0.3, 0.5, 0.7, 1) alloys with VEC > 18. J. Alloys Compds. 2022, 927, 166578.
- Karati, A.; Mishra, S.R.; Ghosh, S.; Mallik, R.C.; Shabadi, R.; Murty, B.S.; Ramanujan, R.V.; Yadav, S.K.; Murty, B.S.; Varadaraju, U.V. Thermoelectric properties of a high entropy half-Heusler alloy processed by a fast powder metallurgy route. J. Alloys Compd. 2022, 924, 166108.
- Mesaritis, G.; Ioannou, I.; Delimitis, A.; Hatzikraniotis, E.; Gelbstein, Y.; Kyratsi, T. n-type (Zr,Ti)NiSn half-Heusler materials via mechanical alloying: Structure, Sb-doping and thermoelectric properties. J. Phys. Chem. Solids 2022, 167, 110735.
- Serrano-Sanchez, F.; Yao, M.; He, B.; Chen, D.; Gloskovskii, A.; Fedorov, A.; Auffermann, G.; Liu, E.; Burkhardt, U.; Fecher, G.H.; et al. Electronic structure and low-temperature thermoelectric transport of TiCoSb single crystals. Nanoscale 2022, 14, 10067.
- Yang, X.; Wang, Y.; Min, R.; Chen, Z.; Guo, E.; Kang, H.; Li, L.; Jiang, X.; Wang, T. Enhancement in thermoelectric properties of ZrNiSn-based alloys by Ta-Hf Co-doping. Acta Mater. 2022, 233, 117976.
- Barczak, S.A.; Kennedy, B.F.; da Silva, I.; Bos, J.-W.G. Mechanistic insights into the formation of thermoelectric TiNiSn from in situ neutron powder diffraction. Chem. Mater. 2023, 35, 3694.
- Chen, R.; Yan, Y.; Zhang, W.; Liu, F.; Kang, H.; Guo, E.; Chen, Z.; Wang, T. Enhanced thermoelectric properties of Zr0.85−xHfxNb0.15−yTayCoSb medium-entropy alloys: Tradeoff between “What to Alloy” and “How Much to Alloy”. Chem. Mater. 2023, 35, 2202.
- Ciesielski, K.; Synoradzki, K.; Szymański, D.; Tobita, K.; Berent, K.; Obstarczyk, P.; Kimura, K.; Kaczorowski, D. Half- Heusler phase TmNiSb under pressure: Intrinsic phase separation, thermoelectric performance and structural transition. Sci. Rep. 2023, 13, 1592.
- Liu, R.; Wang, C.; Huang, J.; Luo, P.; Liu, X.; Ye, S.; Dong, Z.; Zhang, J.; Luo, J. Preparation and thermoelectric properties of Sc-doped Ti1−xNiSb half-Heusler alloys. Acta Phys. Sin. 2013, 72, 20230035.
- Min, R.; Gao, Y.; Jiang, X.; Yang, X.; Li, L.; Kang, H.; Guo, E.; Chen, Z.; Wang, T. Enhancement in the thermoelectric performance of ZrNiSn-based alloys through extra Zr-rich nanoprecipitates with superstructures. Chem. Eng. J. 2023, 464, 142531.
- Verma, A.K.; Johari, K.K.; Dubey, P.; Candolfi, C.; Lenoir, B.; Walia, S.; Dhakate, S.R.; Gahtori, B. Coupling of electronic transport and defect engineering substantially enhances the thermoelectric performance of p-type TiCoSb HH alloy. J. Alloys Compds. 2023, 947, 169416.
- Vikram, B.S.; Barman, C.K.; Alam, A. Accelerated discovery of new 8-electron half-Heusler compound as promising energy and topological quantum materials. J. Phys. Chem. C 2019, 123, 12.
- Vikram, B.S.; Kangsabanik, J.; Alam, A. Accurate high-throughput screening of I-II-V 8-electron half-Heusler compounds for renewable-energy application. arXiv 2019, arXiv:1910.02984v1.
- Hoat, D.M.; Naseri, M. Electronic and thermoelectric properties of RbYSn half-Heusler compound with a 8 valence electrons: Spin-orbit coupling effect. Chem. Phys. 2020, 528, 110510.
This entry is offline, you can click here to edit this entry!
