1. Current State-of-the-Art Techniques and Technologies in Vascular Ageing
There are currently non-invasive methods and tools available to measure arterial stiffness. The calculation of indices, such as the augmentation index (AIx), ambulatory arterial stiffness index, and cardio-ankle vascular index (CAVI), and the measurement of Pulse Wave Velocity (PWV) are examples of current methodologies. Additionally, imaging methods such as ultrasound and MRI have been investigated over the years. Research has also been conducted utilising Laser Doppler Flowmetry (LDF) and near-infrared spectroscopy (NIRS). Researchers have examined the use of already-available instruments such as the Arteriograph device (TensioMed Ltd., Budapest, Hungary), the Mobil-O-Graph 24 h Pulse Wave Analysis (PWA) Monitor Device (I.E.M. GmbH, Stolberg, Germany), and more, including oscillometric devices, as well as computational approaches using algorithms and software programmes. More information on these subjects is covered later in the review, including their advantages and limitations.
1.1. The Recent Use of Measurements of Pulse Wave Velocity to Assess Arterial Stiffness
PWV is considered the gold standard for assessing arterial stiffness. PWV assesses the speed at which arterial pressure waves move through the aorta and large arteries. Recently, different techniques have been employed to analyse PWV in the assessment of arterial stiffness. Research has been conducted in areas linking arterial stiffness to body fat percentage (BFP), aortic valve replacement, children and adolescents with inflammatory bowel disease (IBD), and coronary stenosis. The use of impedance cardiography in assessing arterial stiffness using PWV has also been explored.
Gong et al. [
10] conducted a study to examine the relationship between BFP and arterial stiffness. Eligible patients were categorised into four groups based on gender and arterial stiffness, and carotid femoral PWV (cfPWV) was measured. Each patient’s BP, height, waist circumference, and body weight were also recorded. Given the relatively limited sample size, it was challenging to confirm a cause-and-effect relationship between BFP and cfPWV. PWV Tonometry-based devices were also utilised to measure the cfPWV prior to this investigation. Ji et al. [
11] used cfPWV measurements to assess arterial stiffness. The study focused on the operator’s placement, the distance being measured, and the tonometer position. Manual measurements were made of the distances between the suprasternal notch (SNN) and the remote detection site (femoral artery), the distance between the sternal notch and the proximal (carotid artery) detection point, and the distance between the femoral artery and the carotid artery detection point (cf-distance). Western nations make extensive use of cfPWV, and the study’s tonometry-based apparatus is frequently used to assess aortic PWV. The device allowed for the measurement of central BP; however, questions over the accuracy of doing so with non-invasive methods remain.
Cantürk et al. [
12] investigated the severity of aortic stenosis after an aortic valve replacement. The patients were between the ages of 43 and 75. PWV was measured at baseline and six months after having an aortic valve replaced. However, a limited sample size was employed, and the study’s methodology was different from that of earlier research, making comparison challenging. A larger investigation is needed for more conclusive results.
The arterial stiffness of children and adolescents with IBD has also been examined. Based on the carotid artery and the femoral artery, the Vicorder device (Skidmore Medical Limited, Bristol, UK) was used to take cfPWV measurements. A causal interpretation of the findings was constrained because it was a cross-sectional study of a relatively small and heterogeneous sample. Additionally, no comparison groups were available, meaning the outcomes had to be interpreted in relation to pre-determined reference values. Future research on the long-term effects of CVDs in patients with IBD should make use of bigger sample numbers [
13].
Liu et al. [
14] used multidetector computed tomography angiography to determine coronary stenosis using brachial-ankle PWV (baPWV). Although only elastic arterial stiffness should be recorded, one limitation of baPWV is that the parameter captures both muscle and elastic arterial stiffness. In another study, PWV was examined to determine whether it reflects central or peripheral arterial stiffness. However, one of the study’s shortcomings was that a longitudinal follow-up was not conducted to examine subsequent CVD occurrences. The results’ applicability to other populations is also uncertain despite the sample size being rather large [
15]. In another study, Yufu et al. [
16] measured the aortic PWA and percent mean pulse amplitude (%MPA). These tests were performed on 33 patients at the right brachial artery on both sides of the ankle. However, the study omitted the consideration of additional factors impacting %MPA beyond aortic stiffness, such as femoral stiffness.
Scudder et al. [
17] recorded dual impedance signals using a spot electrode arrangement on 78 adults aged 19 to 78. The pulse transit time (PTT), which was obtained by measuring the aortic flow onset and arrival times of peripheral pulse waveforms, was used to calculate PWV. PTT has an inverse relationship to PWV and represents the amount of time it takes for a pulse wave to travel a known distance. The study had drawbacks despite the authors’ claim that d-ICG is a reliable approach to measure arterial stiffness, reasonably inexpensive, and easy to use due to minimal expertise being required. Firstly, the sample size was small and comprised, mostly, young healthy adults. Secondly, because of the longer pulse trajectory through distal arteries, such as the tibial artery, d-ICG was unable to provide direct assessments of central aortic stiffness (as with most non-invasive measures of PWV). Furthermore, it was advised that specific software configurations needed to be changed in order to collect the whole signal range and use the first derivative to determine timing characteristics.
1.2. The Recent Use of Arterial Stiffness Index Calculations to Assess Arterial Stiffness
The use of indices for measuring arterial stiffness has been studied by numerous researchers. This section summarises the recent utilisation of different indices, including the CAVI, ambulatory arterial stiffness index, AIx, arterial velocity–pulse index (AVI), arterial pressure–volume index (API), compliance index (CI), arterial stiffness index (ASI), and ankle-brachial index (ABI).
In order to determine arterial stiffness, Miyoshi and Ito [
18] used the CAVI, which measured the distance from the origin at the aorta to the ankle and calculated the time it took for the pulse pressure wave to travel from the aortic valve to the ankle in order to obtain the PWV from the heart to the ankle. Additionally, the brachial artery in the upper arm was used to gauge BP. Following that, the Bramwell–Hill formula was applied to express the link between the PWV and change in volume. The fact that the CAVI can analyse arterial characteristics by splitting them into BP and arterial stiffness is one of its advantages over other methods for measuring arterial stiffness. Additionally, it measures the ascending aorta, suggesting that the arterial stiffness measurement may be more closely related to cardiac function. The CAVI has the potential to be helpful in clinical settings because of its relative simplicity and flexibility, though more research is needed.
Souza-Neto et al. [
19] evaluated the ambulatory arterial stiffness index for the measurement of arterial stiffness in heart transplant patients. It was determined that the ambulatory arterial stiffness index presented a non-invasive way to indicate hypertension. However, the accuracy was questioned due to the study’s small sample size. Moreover, the index was not compared with standard methods such as PWV or AIx. In rheumatoid arthritis (RA) patients, Klocke et al. [
20] used radial PWA to determine AIx. The subjects were between the ages of 18 and 50, and the results were contrasted with that of a healthy control group. Despite this, validation is still needed from larger research that might examine further elements of the illness. Investigations into known physiological factors that can affect the AIx are also necessary. As an illustration, it was stated that AIx was lower in men and that it negatively correlated with height and heart rate and positively correlated with age and peripheral BP; however, these results must be investigated further.
1.3. The Recent Use of Imaging Techniques to Assess Arterial Stiffness
1.3.1. Ultrasonography
One of the key techniques for assessing vascular age is ultrasound, an acoustical imaging modality, which uses high-frequency sound waves. Researchers have employed ultrasound to assess arterial stiffness, yielding promising results. However, ultrasound methods tend to be expensive and require expertise to operate.
Naessen et al. [
25] conducted a study involving 30 healthy individuals (median age, 62; range, 27 to 82), 19 patients with pulmonary arterial hypertension (median age, 53; range, 27 to 84), and 14 patients with left ventricular heart failure with a reduced ejection fraction (median age, 67; range, 48 to 82). The healthy subjects were non-smokers and had no prior history of heart or arterial disorders. Additionally, the subjects were not taking any medications that would have impacted the arterial wall. The study disproved the common belief that vascular changes in pulmonary arterial hypertensions are only related to lung vasculature.
Li et al. [
26] utilised ultrasound imaging techniques to assess arterial stiffness in patients with acute ischemic stroke (AIS) using real-time shear wave elastography to measure longitudinal elasticity modulus. With this technology, 50,000 images could be captured every second. Furthermore, radio frequency ultrasonography technology was used to calculate the PWV of the bilateral carotid arteries. The results demonstrated that shear wave elastography can be used in vascular applications. Future research is necessary to evaluate risk factors and assign various weights to arterial stiffness in longitudinal and circumferential directions because the study was unable to analyse all deviations.
Age-dependent elasticity variations in the common carotid artery elasticity served as the foundation for the comparison between conventional and ultrasonographic strain measures in a study conducted by Bjällmark et al. [
27]. The evaluation involved 10 younger subjects, between the ages of 25 and 28, and 10 older subjects, between the ages of 50 and 59. The conclusion drawn was that two-dimensional (2D) strain imaging exhibited greater accuracy compared to traditional measurements. However, concerns arose regarding the stiffness indices, as these were derived from BP and lumen diameter measurements obtained at different sites, casting doubt on the accuracy of the variables.
1.3.2. Magnetic Resonance Imaging
MRI, which uses magnetic fields to create images, has also been investigated by researchers for the assessment of arterial stiffness.
The study conducted by Kang et al. [
28] used cardiac MRI to calculate the pulmonary artery distensibility index to assess pulmonary artery stiffness. However, the study had certain limitations. Firstly, despite the disease being rare, the subject group was small. Secondly, among the thirty-five patients under observation, only three were noted to have severe pulmonary regurgitation (PR), which can suggest that the pulmonary artery distensibility index would have been overestimated.
The impact of age on turbulent blood flow was assessed by Ha et al. [
29] using four-dimensional (4D) flow MRI. All subjects experienced turbulent flow in the aorta. However, this was based on a small sample size of twenty healthy males aged between 67 and 74 and twenty-two healthy males aged between 20 and 26. Although MRI does not expose patients to radiation, some may experience claustrophobia, rendering it inappropriate for a general evaluation of vascular ageing.
1.4. Laser Doppler Flowmetry and Near-Infrared Spectroscopy
The medical technique of LDF uses the concept of Doppler shift, which is the change in the frequency of light (in this case, laser). Sorelli et al. [
30] assessed the vascular ageing using the Periflux 5000 LDF system (Perimed, Järfälla, Sweden). On the right hallux pulp of the individuals, microvascular perfusion was recorded. A supervised classifier was trained and validated using over 20,935 models of pulse waves. Although using LDF is less expensive than using other imaging techniques, it can have signal processing and motion artefact issues [
43].
NIRS is an analytical technique that uses a broad spectrum of near-infrared light to illuminate the region of interest and measures the light that is absorbed, transmitted, reflected, or scattered. Age-related metabolic and microvascular function changes were assessed by Rogers et al. [
31] using NIRS vascular occlusion testing. NIRS signals were recorded from 17 younger and 17 middle-aged and older women. The Framingham risk calculator was used to determine a 10-year risk. Due to the cross-sectional nature of the study, it was not possible to evaluate the causal temporal relationship between age and the results. Additionally, the thickness of the adipose tissue was not assessed, which might have reduced the absolute NIRS signals. Finally, the melanin levels were not considered, which might have affected the NIRS signal.
1.5. The Use of Existing Devices to Assess Arterial Stiffness
Commercial devices which measure arterial stiffness do exist. These devices include the Mobil-O-Graph 24 h PWA Monitor Device, SphygmoCor-Px System (AtCor Medina, Sydney, Australia), VP-1000 system (Omron Healthcare, Hoffman Estates, IL, USA), EndoPAT 2000 system (Itamar Medical, Franklin, MA, USA), PeriScope (M/S Genesis Medical Systems, Hyderabad, India), Form PWV/ABI vascular diagnostic device (Omron Healthcare, Kyoto, Japan), SonoSite 180 Plus (SonoSite Inc., Washington, DC, USA), Anteriograph, and NICOM (Cheetah Medical, Portland, OR, USA).
The Mobil-O-Graph 24 h PWA Monitor Device was used by Silva et al. [
32] to evaluate the link between body composition and arterial stiffness. Dual-energy X-ray absorptiometry on a Hologic bone densitometry machine (Model Discovery A, Waltham, MA, USA) was used to obtain the body compositions of the participants. However, the study was constrained because it was carried out in a single location with community elders, lacking applicability to a broad and diverse population. Additionally, the study ignored the individuals’ usage of medications such as anti-hypertensives, which would have affected the central circulation parameters.
Although there are instruments that can distinguish between healthy and unhealthy vessels, no device is ideal. Perrault et al. [
33] compared the measurement capabilities of the SphygmoCor-Px System, the VP-1000 system, and the EndoPAT 2000 system in healthy subjects ranging in age from 23 to 71. The outputs of the instruments differed numerically, making it difficult to compare the outcomes. Furthermore, because there is a lack of knowledge regarding changes to the parameters in relation to illness progression, it makes it difficult to track disease progression or the efficacy of a particular intervention. Markakis et al. [
34] evaluated the SphygmoCor-Px System and the Mobil-O-Graph 24 h PWA Monitor Device in terms of feasibility. Invasive and non-invasive measurements were performed within 24 h of admission and again 48 hours later for comparison purposes on patients experiencing hemodynamic shock in intensive care units (ICUs). It was concluded that non-invasive procedures can be used as part of an additional monitoring method while invasive techniques are more trustworthy. However, the results of the study are questioned because of the small sample size. The SphygmoCor-Px has also been used in studies to assess vascular ageing by acquiring the PWV. Costa et al. [
35] used the SphygmoCor-Px in a study conducted on in arterial hypertension individuals. Chi-square analysis was performed as the primary statistical analysis. Despite the small size representing a community and the requirement for a larger size, the study was able to demonstrate its ability to measure arterial stiffness non-invasively using a gold-standard instrument.
Sridhar et al. [
36] used the PeriScope to measure arterial stiffness by obtaining the PWV of 988 healthy controls and 2988 who had a high risk of developing CVD. Using an oscillometric approach, the PeriScope simultaneously assessed the cfPWV and baPWV. It was concluded that those with a higher risk of developing CVD had a higher PWV than the healthy control group. In another study, Komine et al. [
37] used an oscillometric BP device to evaluate arterial stiffness. An inflatable cuff was used to assess the BP of the individuals and the Form PWV/ABI vascular diagnostic device was used to obtain the baPWV and cfPWV. The SonoSite 180 Plus was used in the study to obtain images using ultrasound. It should be noted that the study did have restrictions. For instance, the oscillometric cuff pressure was used to take an indirect measurement of arterial volume. Between the brachial blood vessel and cuff, the size of the muscle and fat has unknown effects on the arterial volume. To determine whether the technique could be utilised to measure arterial stiffness when illnesses are present, more research is needed. In a more recent study, Hoffmann et al. [
38] used a oscillometric BP monitor to assess early vascular ageing biomarkers in cosmonauts, aged between 41 and 51 (7 males and 1 woman), undergoing long-term space flights. To summarise, it was found that the cosmonauts had not undergone any clinically significant changes despite comparisons to the baseline measurements (represented by 65 to 90 days prior to the flight). Long-term flights in deep space should reportedly be looked upon in the future. Due to the study’s limited sample size, it is recommended to conduct a follow-up examination several years later. The current follow-up duration in the study was deemed too short to adequately identify any delayed onset of vascular diseases.
1.6. The Recent Use of Computational Algorithms to Assess Arterial Stiffness
Over the years, researchers have created various computational algorithms to predict arterial stiffness. Computational algorithms navigate around the challenges associated with gathering extensive in vivo datasets along with the associated time and costs [
44]. Kostis et al. [
41] predicted arterial stiffness from pulse pressure using an algorithm. To test whether arterial age predicted stroke better than chronological age, two indices of arterial stiffness were created by the algorithm and adjusted for specified demographics. The study was constrained, nevertheless, because the algorithms had been demographically adjusted and hence could not be applied to other datasets. As a result, the approach could not be used with different datasets that included, for instance, different age and gender groupings. Having said that, and according to the authors, the approach may be used to design and carry out new randomised clinical trials.
To assess local arterial stiffness, a semi-automatic vendor-independent software was created by Negoita et al. [
42] using a Vivid E95 ultrasound (GE Healthcare, Illinois, US) to collect images. The edges of the luminal arterial walls (M-mode) and blood velocity were determined by the software, and diameter and velocity waveforms were extracted from the ultrasound images. The study was assessed on healthy volunteers aged between 22 and 32, with four of them being females. The technique was vendor-independent; therefore, it could be used to analyse ultrasound images of diameter and velocity recorded on any ultrasound machine as long as they have been saved in the Digital Imaging and Communications in Medicine (DICOM) format.
2. Using Photoplethysmography for Arterial Stiffness Assessment
PPG is a widely used non-invasive optical technique. It aids in studying and monitoring pulsations associated with changes in blood volume in a peripheral vascular bed. Over the last thirty years, the number of published articles on PPG has significantly increased, covering both basic and applied research. Throughout these publications, PPG has been praised as a non-invasive, low-cost, and simple optical technique for measuring physiological parameters applied at the surface of the skin.
The popularity of this topic can be attributed to the realisation that PPG has important implications for a wide range of applications. Amongst many, it aids in blood oxygen detection, cardiovascular assessment, and vital sign monitoring. In addition, the significant contribution of PPG in wearable devices has exponentially elevated the popularity and usability of PPG.
Currently, there exists a large body of literature that contributes new knowledge on the relationship between PPG pulse morphology, PWA, and pulse feature extraction with the physiological status of peripheral blood vessels. This encompasses aspects such as ageing, stiffness, BP and compliance, and microvascular disease, amongst others. There are also significant efforts in the utilisation of the PPG for the detection of heart arrhythmias such as Atrial Fibrillation (AF). Researchers are continuing to strive to combine the PPG sensory capabilities of wearables, such as smartwatches, with Artificial Intelligence (AI) in delivering ubiquitous health monitoring solutions that go beyond the current available heart rate wearables [
45].
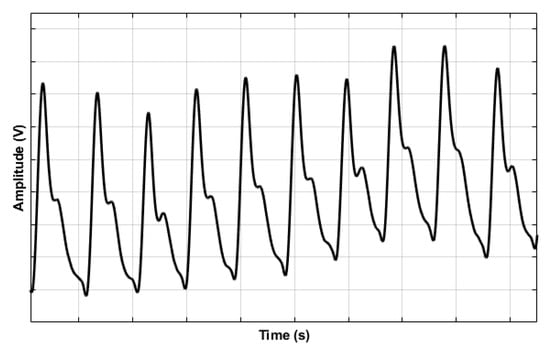
PPG sensors comprise Light Emitting Diode(s) (LEDs) and photodector(s). The emitted light, which is made to transverse the skin, is reflected, absorbed, and scattered in the tissue and blood. The modulated light level, which emerges, is measured using a suitable photodetector. For example, it is possible for the hand to be directly transilluminated where the light source, usually in the broad region of 450 nm to 960 nm, is on one side of the skin and the detector is on the other side. This method, also called the transmission mode, is limited to areas such as the finger, the ear lobe, or the toe. However, when light is directed into the skin, a proportion is backscattered, emerging near the light source. The light source and the photodetector can be positioned side by side. This method, also called the reflection mode, allows measurements on virtually any skin area. The intensity of reflected and backscattered light reaching the photodetector in either reflection or transmission mode is measured. The variations in the photodetector current are assumed to correlate to blood volume changes beneath the probe. These variations are electronically amplified and recorded as a voltage signal called the photoplethysmogram (
Figure 4) [
45].
Figure 4. An example photoplethysmogram depicting the systolic and diastolic peaks with a dicrotic notch [
45].
The PPG signal can be impacted by a number of variables such as temperature variations, the measurement site, perfusion status, and motion artefacts. As mentioned earlier, the transmittance or reflectance mode of the PPG sensor can differ depending on the anatomical measurement site, as shown in
Figure 5. Thus, the wavelength of the light source(s) must be accounted for depending on the mode and distance that the light must penetrate. For example, red and infrared light reaches deeper than green light. Peripheral vasoconstriction can cause low-quality signals while good skin contact has demonstrated high-quality signals [
46,
47].
Figure 5. PPG sensor configuration modes. Transmittance mode configuration (top image) shows light source (LED) and photodetector (PD) placed on opposite sides of the body site. In reflectance mode (bottom image), the light source (LED) and photodetector (PD) are adjacent.
Understanding the constraints of PPG monitoring holds significance. Since PPG detects light, it faces drawbacks such as susceptibility to interference from ambient sources, impacting measurement accuracy. Motion artifacts also pose challenges [
48], though utilising post-processing algorithms can mitigate the interferences. Additionally, variations in skin tones can impact the signal as PPG relies on light–tissue interactions. Considering these factors is crucial when developing PPG-based sensors for experiments, whether in vivo or in vitro.
2.1. The Recent Use of Photoplethysmography in Studies to Assess Arterial Stiffness
The evaluation of arterial stiffness using PPG has recently become popular. Many researchers have attempted to understand arterial stiffness using PPG in in vivo settings. Some in vivo research focuses on specific conditions including pregnancy, obesity, and diseases such as CAD. Studies have also compared PPG-based devices to one another and to other modalities to assess the viability of using PPG-based devices. The topics will be discussed in further detail below.
2.2. Existing Photoplethysmography-Based Devices to Assess Arterial Stiffness
PPG is a well-established optical technology; many researchers have adopted or developed new PPG-based devices, such as through research based at university laboratories. Some researchers have conducted in vivo studies to distinguish between healthy and unhealthy patients bilaterally (such as between healthy and PAD subjects) or by obtaining pulse waveforms from one measuring site, such as the left index finger. This section will introduce novel and existing PPG-based devices in further detail.
One of the earliest PPG research studies was conducted by Allen and Murray [
49] on a group of healthy people. Firstly, PPGs were recorded from the right (R) and left (L) sides of six peripheral sites (that is, L and R ears, L and R thumbs, and L and R toes). To validate the electronic matching of right-to-left channels, a set of validation data was first gathered. Secondly, the healthy volunteers provided a set of physiological data derived from PPGs. These were the root mean square error (RMSE), which measured the differences between the right and left side, and cross-correlation analysis, which measured the degree of similarity. Allen and Murray [
49] found that in healthy individuals, the right and left sides of the body were highly correlated, as perhaps expected. This work paved the way for further research that was conducted by Bentham et al. [
50]. While it was already proven that in healthy individuals the PPGs from the right and left were highly correlated, Bentham et al. [
50] obtained multi-site finger and toe PPG recordings from 43 healthy control patients and 31 PAD subjects to carry out another bilateral study. Beat-to-beat normalisation amplitude variability and pulse arrival time (PAT) were assessed in the frequency domain using magnitude-squared coherence (MSC) and in the time domain using two statistical techniques. When the results from the two subject groups were analysed, patients with PAD had a different signal on one side of the body compared to the other, unlike the healthy subjects. The work conducted by Bentham et al. [
50] highlighted the possibility of distinguishing between healthy and PAD subjects. The clinical demographic dataset that was gathered for the study was nonetheless limited, and only a few fundamental variability variables were investigated in terms of PWA.
Brillante et al. [
51] used PPG to non-invasively measure arterial stiffness from the left index finger in healthy people ranging in age from 18 to 67. The research focused on the impacts of categories such as age, gender, and race on different indices including stiffness index (SI) and reflection index (RI). Analyses based on simple correlation, Spearman’s correlation, and multivariate regression were performed. Although the study concluded comparisons between the different categories and the indices, the study’s sample of healthy adults over 65 was underrepresented. Similar to the study by Brillante et al. [
51], where it was found that there were no differences between genders in terms of arterial stiffness measurements, the results obtained by Jannasz et al. [
52] supported the notion that gender had no bearing on the likelihood of developing atherosclerosis. It should be emphasised, nevertheless, that the results were primarily focused on female participants, which may have influenced the findings. In another study conducted by Tąpolska et al. [
53], the subjects were separated according to age, gender, and weight. The Pulse Trace PCA 2 device (Micro Medial, Rochester, UK) was used by placing a reader on the index finger to evaluate SI using PPG techniques. Although it was concluded that SI was more useful than RI, both can be used in clinical practice.
The work carried out by Tanaka et al. [
54] using PPG signals taken from an occluded finger has made it possible to take measurements of the small artery and arteriole in the future. The study used Bland–Altman plots to evaluate the degree of agreement between the finger arterial stiffness index (FSI) and finger arterial elasticity index (FEI). Regression analysis, linear analysis, and bi-logarithmic analysis were used. The work has provided confidence in measuring arterial stiffness in smaller vessels.
2.3. Use of Photoplethysmography on Specific Conditions
Researchers have implemented PPG-based techniques to assess arterial stiffness in patients with specific health conditions, such as CAD, heart transplantation, diabetes, hypertensive, and obesity, and high-risk patients. Pregnancy and cerebral pulsatility have also been investigated by researchers. The topics will be discussed in further detail.
Zekavat et al. [
58] evaluated the association of ASI with BP and CAD. Multivariable COX proportional hazards and additive linear regression were among the analysis models used. The results led to a lack of confidence that PPG-derived ASI could predict CAD risk, leaving a gap for future research. Arterial stiffness changes in heart transplant patients have been compared by Sharkey et al. [
59]. The study was conducted on 20 children with heart transplantation and on a healthy control group of 161 children. Data were collected bilaterally from the ear lobes, index fingers, and great toes. The PPG signal collected from the children with heart transplants was normalised and compared to the normalised PPG signal from the control group. For statistical analysis, multivariate (that is, binary logistic regression (BLR)) and univariate analyses (that is, the Mann–Whitney U test) were performed. This study suggested the possibility to measure arterial stiffness at different body sites. Research has also been conducted on diabetic patients whereby there is a possibility to distinguish between diabetic and non-diabetic individuals using an arterial stiffness monitoring system based on PPG technology [
60]. Furthermore, the second derivative of PPG has been investigated as a potential indicator of arterial stiffness. In a study conducted on 260 patients, it was found that the arterial stiffness progression differed in the diabetic and non-diabetic stages [
61].
The second derivate of a PPG signal and the PWV were compared in a study by Bortolotto et al. [
62] that examined vascular ageing evaluation in hypertensive participants. The study involved 524 patients with hypertension and 140 with atherosclerosis alteration, which included coronary heart disease, peripheral vascular disease, and abdominal aortic aneurysm. The second derivative of the PPG was suggested as a potential tool for assessing vascular ageing in hypertensives. The length of the vascular segment may have been overstated by the PWV approach, which should be considered despite the fact that PWV was a better indicator of the presence of atherosclerosis alteration than the second derivative of PPG.
Korneeva and Drapkina [
63] investigated the possibility of using PPG on obese patients with high BP by assessing arterial stiffness. The main objective was to provide statins, namely atorvastatin and rosuvastatin, to these patients and track the development of vascular stiffness. In an additional effort, Drapkina and Ivashkin [
64] used a PPG device attached to a finger to conduct a pulse wave study on arterial stiffness in obese and high-BP patients. Prior to this research, Drapkina [
65] used a finger PPG device to examine arterial stiffness in high-risk patients with high BP. The study was carried out similarly to that by Korneeva and Drapkina [
63], albeit for high-risk patients. Both sets of results supported one another, noting that high-risk or obese patients had increased arterial stiffness.
Other circumstances, such as pregnancy-related circumstances, have also been analysed using PPG. The study conducted by Wowern et al. [
66] involved PPG signals being collected from the left index fingers of healthy pregnant women. For analysis, linear and polynomial mixed effects were used to account for gestational age, and analysis of variance (ANOVA) and analysis of covariance (ANCOVA) were used to account for age influences. Yet, there was uncertainty and a lack of trust in the ability to identify pathological haemodynamic changes during pregnancy, thus postulating the necessity to investigate pathological changes that can occur during pregnancy.
In two independent acute interventions (a cold pressure test and one involving mild lower-body negative pressure), Lefferts et al. [
67] investigated the effects of cerebrovascular pulsatility in terms of acute increases in arterial stiffness in middle-aged and young adults. A mean BP reading was acquired using PPG for continuous BP monitoring. Cerebrovascular hemodynamics at rest, during the cold pressure test, and during the lower-body negative pressure intervention were evaluated in 15 middle-aged people between the ages of 47 and 61 and in 15 young adults with genders matched to the middle-aged. The measurements, however, were not evaluated constantly, resulting in a little variation in the timings of the measurements. The middle-aged adult group also included a small number of participants who had CVD risk factors, such as obesity and anti-hypertensive medication usage, which could have improved validity but affected the findings. Future research should involve older subjects, as the study only focused on those under 61 years of age.
2.4. Comparing Current Photoplethysmography-Based Instruments and Other Measurement Methods
While some researchers have used custom-made PPG-based instruments for their work, others have compared several existing instruments. Complior (Alam Medical, Saint-Quentin-Fallavier, France), PulsePen (DiaTecne, Milan, Italy), and PulseTrace (GP Supplies, Borehamwood, UK) are the three devices that have been compared. PPG and measurement indices that gauge arterial stiffness, such the ABI, ASI, SI, and AIx, have also been examined. Additionally, imaging PPG (iPPG) and contact PPG (cPPG) have been compared.
Salvi et al. [
68] compared current commercial PPG devices, namely Complior, PulsePen, and PulseTrace. In contrast to Complior and PulsePen, which used aortic PWV based on the interval between carotid and femoral pressure waves, PulseTrace was evaluated using SI measures. There remains a need to standardise PWV measurements and establish a reference value by contrasting various devices. Djeldjli et al. [
69] compared iPPG with cPPG. The experiment was based on healthy participants. Two probes were used to record the signals for the cPPG, one on the right earlobe and the other on the index finger. The study’s small sample size and primary focus on a certain age range and skin type limited the results to this application alone. Large-scale population testing is necessary to assess the impact of the measuring site on the measurements.
Kock et al. [
70] compared the ABI to PPG measurements for arterial stiffness in elderly patients. Many analysis models were used, such as bivariate and multivariate linear regression, the Shapiro–Wilk test to analyse residuals, and winsorisation. Measures of central tendency and data dispersion were used to denote quantitative variables, whereas absolute frequencies and percentages were used to represent qualitative variables. It was concluded that the ABI did not relate to PPG indicators, and more research is needed to establish standardised procedures for vascular assessment. In another study, using a fingertip PPG device, Murakami et al. [
71] compared the ASI to the well-known baPWV. Through statistical analyses such as the non-parametric Wilcoxon rank sum test, Receiver Operating Characteristic (ROC) curve, and the Area under the Curves (AUCs), the instrument was shown to be capable of measuring arterial stiffness in accordance with baPWV. To ascertain the possibility of distinguishing between subjects with high and low cardiovascular risk, Clarenbach et al. [
72] compared the SI acquired through PPG to the AIx obtained through radial tonometry. The study involved 62 individuals who had either chronic obstructive pulmonary disease (COPD) or obstructive sleep apnea, and 21 healthy volunteers served as controls. The subjects were between the ages of 18 and 75. Whilst both devices were successful, the SI acquired from the PPG device could further distinguish between intermediate and high-risk people, rendering it more effective in clinical settings.
2.5. The Use of Photoplethysmography in Computational Models
Researchers have incorporated PPG into computational models to predict vascular health, as well as analysing incident and reflected waves from the PPG waveform. The advantages and disadvantages of using PPG in computational models are discussed.
Machine learning (ML) and deep learning (DL) were applied to the PPG signals of a database in a study conducted by Dall’Olio et al. [
73]. The approach involved pre-processing data on the raw PPG signals, through steps such as detrending, demodulating, and denoising. The DL employed the entire signal to predict healthy vascular ageing (by bypassing the feature extraction stage), whereas the ML relied on known extracted features from the PPG signal. For DL, it was possible to bypass the feature extraction stage as several convolutional neural networks (CNNs) were applied to the entire PPG signal as an input. Although CNNs with 12 hidden layers or fewer showed good performance, more complicated structures cannot be trained on a common laptop; subsequent research should explore more complex structures using a feasible technique. Due to the black-box approach being used, the study was restricted in its ability to compare its findings to those of other ML methodologies. In a study conducted by Shin et al. [
74], DL was applied to the PPG pulses of individuals ranging in age from 20 to 80. DL offers an advantage over manually recognising features during the assessment of vascular ageing since it has the potential to produce features from PPG waveforms automatically. It is anticipated that more databases will become accessible in the future, resulting in the DL approach performing better in the assessment of vascular ageing. Nonetheless, the employment of computational models in wearable technology raises additional issues such as the computing power that may affect the ability to obtain an immediate diagnosis. Resolving computation model issues, such as determining the optimal number of hidden layers or the trade-off between the number of parameters and the volume of training data, is crucial [
73].
Park and Shin [
75] evaluated vascular ageing using an artificial-neural-network-based regression model to analyse incident and reflected waves from a PPG waveform. Their study report claimed that a trustworthy single PPG-based technique for assessing arterial stiffness had not yet been developed. The Gaussian mixture model was used to deconstruct each waveform into incident and reflected waves after the recorded PPG signals were segmented for each beat. Since the measurements were based on nasal PPG rather than the more typical finger PPG measurements, it was challenging to generalise the findings. It is unclear how this has an impact on the findings. Future research is needed to understand the effects of various measurement sites. Assessing the model’s performance in relation to risk factors that hasten vascular illnesses such as atherosclerosis, which were not considered in the study, is imperative.
In recent years, researchers have also shown interest in remote health monitoring, particularly through wearables [
76]. This is driven by the ageing population, projected to increase by 10% in the next five years [
77]. Remote PPG (rPPG), monitoring cardiovascular activity via facial video, has gained attention. Despite being labelled non-invasive and low-cost, rPPG faces challenges such as a low signal-to-noise (SNR) ratio. Lian et al. [
78] proposed employing signal processing methods to enhance rPPG by reducing noise and improving accuracy. This involved data fusion, region of interest selection, and heart rate estimation. Furthermore, rPPG attracts attention for fatigue detection. Zhao et al. [
79] utilised CNN for rPPG-based learning fatigue classification through multi-source feature fusion. However, the study used a self-collected dataset and lacked confirmation on enhancing fatigue detection accuracy with a larger sample size using DL. Previous research explored rPPG for estimating blood oxygen saturation (SpO
2). Casalino et al. [
80] credited rPPG as being portable, enabling continuous SpO
2 monitoring. However, while rPPG is gaining popularity, it has not yet been applied rigorously in any large studies relating to vascular ageing.
2.6. Combining Photoplethysmography with Other Modalities and Using Photoplethysmography to Assess Novel Developments
Some researchers have attempted to fuse PPG with other modalities, such as an electrocardiogram (ECG), to overcome some of the current drawbacks. In the same respect, the novel device known as the single continuous passive leg movement (sPLM) has been assessed as a possible screening technique using PPG technology.
By combining multi-site PPG and ECG, Perpetuini et al. [
81] performed an in vivo assessment of vascular stiffness. Ten ECG leads and eight PPG probes were used to collect signals. Signals could be simultaneously gathered from numerous places using various PPG probes. The ECG served as a reference for single-pulse PPG evaluation and averaging. Pressure cuffs were offered to ensure robust optode-to-skin connection. Given that the PPG–ECG system could record back-reflection signals at a significant inter-optode distance, it was hypothesised that PPG signals could be collected from large arteries. Additionally, numerous sites were monitored at once due to the large number of probes used. However, the results were not always interpretable when collecting multiple PPG signals, and significant computing resources may be required [
82].
This entry is adapted from the peer-reviewed paper 10.3390/s23249882