The detection of photovoltaic panels from images is an important field, as it leverages the possibility of forecasting and planning green energy production by assessing the level of energy autonomy for communities. This entry proposes an automatic approach that can detect photovoltaic panels conforming to a properly formed significant range of colours extracted according to the given conditions of light exposure in the analysed images. The significant range of colours was automatically formed from an annotated dataset of images, and consisted of the most frequent panel colours differing from the colours of surrounding parts. Such colours were then used to detect panels in other images by analysing panel colours and reckoning the pixel density and comparable levels of light.
1. Introduction
The integration of renewable energy sources, such as solar power harnessed through photovoltaic panels, within the context of a smart grid has contributed to diminished reliance on conventional fossil fuel-based power generation facilities
[1][2]. Photovoltaic (PV) systems are one of the most promising low-carbon energy generation methods
[3]. PV energy production has grown rapidly over the last decade, at a rate of more than 35% annually
[4]. At the end of 2022, the world’s cumulative installed PV capacity was 1055.03 GW, compared to 589.43 GW in 2019, almost doubling in three years
[5].
Estimating the total installed PV capacity and power generation can enhance the ability of policymakers and stakeholders to evaluate progress in terms of sustainability, quantify the actual benefits of green energy, and consider potential future installations
[6]. Aerial and satellite images have been analysed to recognise PV panels by means of approaches using machine learning (ML), i.e., convolutional neural networks (CNN) and deep learning methods. However, ML tools require a large amount of labelled datasets for their training to be effective, and the related effort to build datasets and perform training is costly and time consuming. Further approaches have focused on analysing the physical absorption and reflection characteristic of PV panels to identify them from airborne images
[7][8]. The related results show that the identification of shapes and areas of PV panels is not very accurate. In addition, spectral detection is sensitive to the thresholds selected for the spectral bands of the different sensors.
This entry presents an approach that identifies PV panels by means of a deterministic algorithm that analyses the colours of the pixels forming the panels. The proposed approach first analyses images to reveal potential intermingling between PV panel colours and surrounding colours, which mostly affects images having a high level of colour saturation. Second, pixel colours in selected PV panels of labelled images are collected and filtered by excluding the colours typical of background or portions surrounding PV panels. Colour tones commonly found in very dark portions (shadows, ground, etc.) as well as very bright portions (roads, roofs, etc.) are excluded from the colours characteristic of PV panels. The resulting colour selection is a set that properly characterises PV panel colours. This set is then used to analyse colours in unlabelled images and detect PV panels. Additionally, for the selected colours that appear in analysed images, their density is evaluated when considering whether a portion of an image contains PV panels.
2. Proposed Approach
The main strategy of the proposed approach is to scan the colours of a small number of annotated aerial images and extract from them a set of characterising PV panel (cPV) colours. Then, these selected colours are used as a reference to detect the location of PV arrays in other (unannotated) aerial images. The approach resembles and extends the methodology presented in
[9][10], where colour analysis and mobile tile-based detection were employed to automatically determine the green and urban areas in an image and trace the boundaries between them.
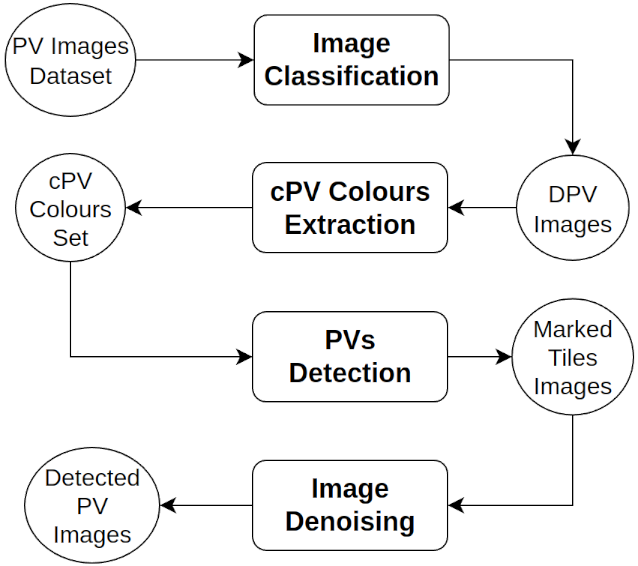
The figure below shows the high-level view of the four main phases of the proposed approach, consisting of: (i) classification, used to identify images featuring Detectable PV (DPV) panels, i.e., those exhibiting colours different enough from the colours of roofs, roads, ground, etc.; (ii) extraction of cPV colours from DPV images; (iii) detection of PVs in unannotated images using a sliding window that marks tiles on the panels’ surface; and (iv) denoising to filter the previous results.
2.1 Classification
The image classification phase comprises three steps: (i) label assessment; (ii) pixel colour extraction and filtering; and (iii) colour analysis and classification.The label assessment step aimed to reveal the accuracy of the pre-existing PV panel annotations in the initial dataset
[11], as the detection results could be misleading if the annotations are not accurate. For this reason, inaccurate labels were identified and the corresponding images were manually removed.
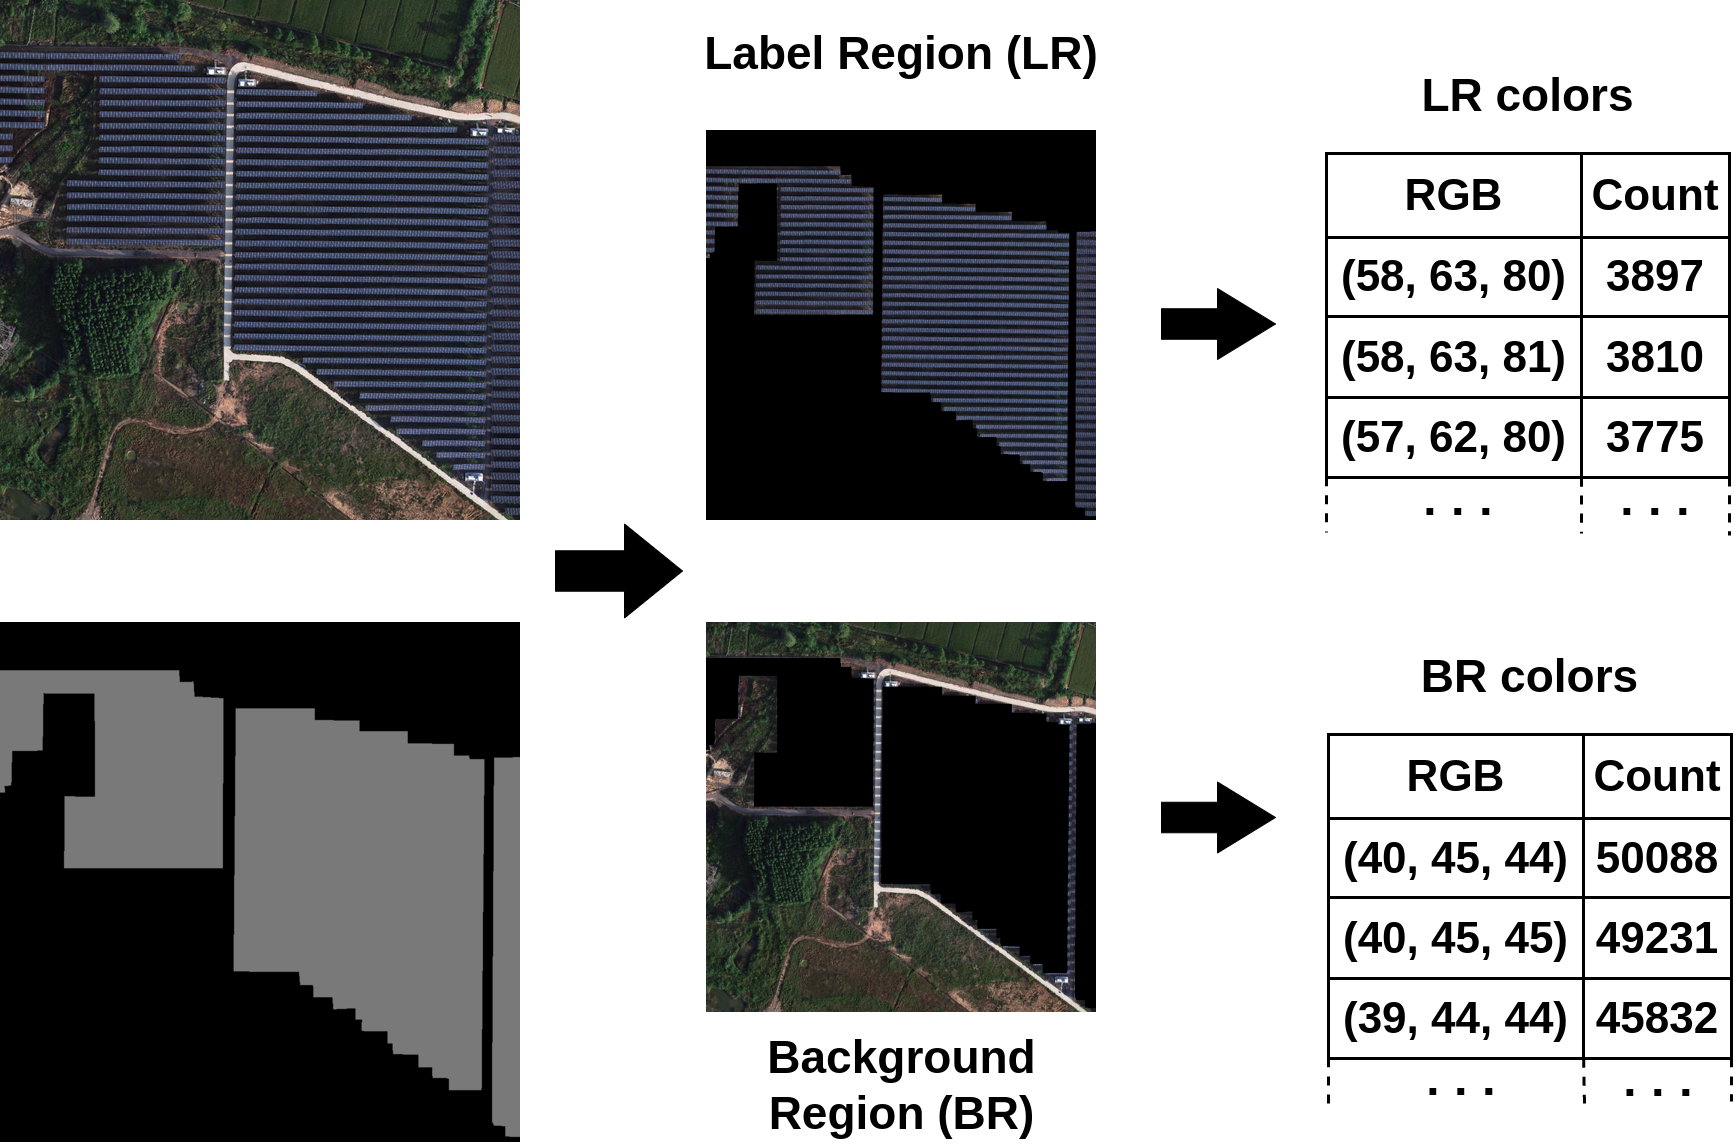
In general, labels in the dataset encompass a region that includes PV panels along with a significant portion of the surrounding area, such as terrain, vegetation, shadows, and so on. As a consequence, dataset labels cannot be reliably employed to guide the extraction of PV colours. For this reason, a strategy was devised to analyse the colours within the area enclosed by labels and automatically exclude the subset of colours that are also commonly encountered outside the annotated area. The strategy operates as follows. Initially, dataset labels are used to partition each image into two regions: the Label Region (LR) and its complement, referred to as the Background Region (BR). Subsequently, the RGB colour components of the pixels are collected and the colour count for each region is computed, indicating the total number of pixels displaying every colour in each of the two regions. This information is aggregated from all images in the dataset and used to build two sets: LR colours and BR colours (see figure below). Then, for each colour within the intersection of the two sets, a comparison is performed between the corresponding counts. If the ratio between the BR count and the LR count exceeds a threshold, that colour is characterised as a background colour and is removed from the LR set. The outcome of this filtering operation is a subset denoted as PV Panel (PVP) colours.
The analysis of the PVP colour sets collected from several images revealed significant colour variations, possibly due to differences in illumination conditions and/or PV panel materials. Three classes of PV panels have been identified, based on the properties of their prominent colours: (i) dark panels, which are typically found in images captured in low-light conditions; (ii) grey–white panels, whose shades can result from the panel material or from sunlight reflecting off the panel surface; (iii) detectable panels (DPV), that includes all images that do not fall into the previous two classes. A strategy was developed to automate the classification of the dataset’s images into such three classes. The strategy is as follows: for each image, the LR colour set is selected and its intersection with the PVP colour set is determined, resulting in the image-specific PVP colour set (iPVP). The iPVP set comprises all PVP colours found within that particular image along with their respective counts.
To assess the amount of dark pixels, RGB coordinates of the iPVP colours are converted into the HSL (Hue, Saturation, Lightness) colour space. Next, the lightness component is evaluated; if a colour falls below a threshold, it is designated as dark. If the aggregated count of dark colours surpasses a predetermined fraction of the total iPVP set counts, then the image is classified as dark.
To evaluate the amount of pixels displaying white or grey shades, the fact that such colours can be described as having low saturation is leveraged. Consequently, colours in the iPVP set are transformed into the HSV (Hue, Saturation, Value) colour space, which in the researchers' analysis enables better classification based on saturation compared to the HSL space. Similar to the previous step, the count of all colours with a saturation component below a threshold is aggregated. If this combined count exceeds a predetermined fraction of the total counts of the iPVP set, the image is classified as belonging to the grey–white class. Images not categorised as either dark or grey–white are automatically classified as DPV images.
2.2 Characterising PV (cPV) Colours Extraction
The goal of this phase is to extract colours from DPV images and isolate the characterising PV (cPV) colours. Similar to the image classification phase, each DPV image is partitioned into a Label Region (LR) and its complementary Background Region (BR). Then colours are aggregated and their respective counts for all images, which are recorded separately for each region, resulting in sets for the LR colours and BR colours. Next, background colours are removed by evaluating the ratio between the BR count and LR count for all colours within the intersection of the two sets. As a result of these operations, the PVP colour set is obtained.
A further filtering process is applied to the PVP colour set with the objective of excluding both dark and low saturation colours. The reason is that, as illustrated earlier, these colours are not representative of PV panels. Again, this assessment uses thresholds for the lightness component in the HSL colour space and the saturation component in the HSV colour space.
2.3 PVs Detection
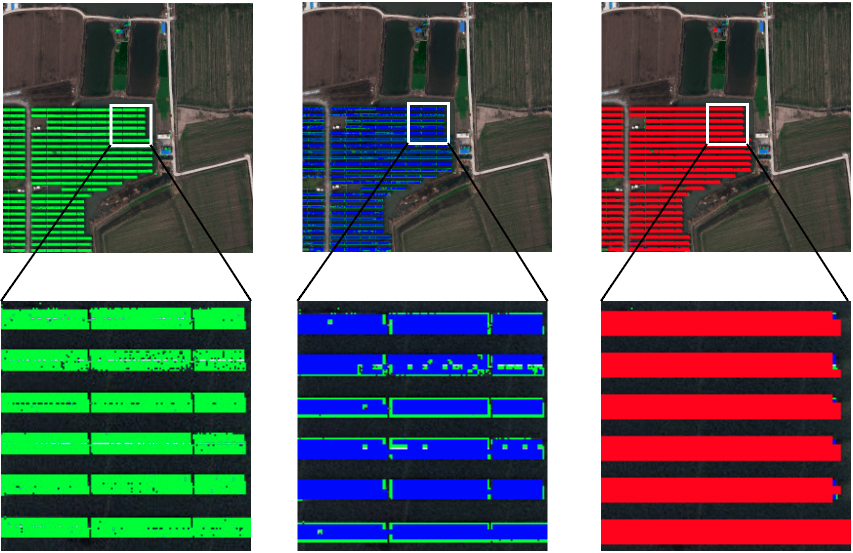
Initially, PV images are analysed and all pixels with a colour contained in the cPV set are identified and marked. Then the detection of PV panels in the images is further refined by evaluating the colours within the area of a moving square window. Depending on the features of PV installations, multiple passes with progressively larger windows can greatly enhance the effectiveness of PV detection. A different marking colour is used in each refinement run because each successive run assesses the marked colours within an increasingly larger area. If a window in a subsequent refinement iteration contains marked pixels but their cumulative count is not sufficient to trigger the threshold, this indicates that a significant number of pixels within the window do not feature cPV colours. Consequently, it is very likely that the previously marked pixels actually correspond to incorrect detections. In this case, the window is not coloured. An example of detection results is shown in the figure below.
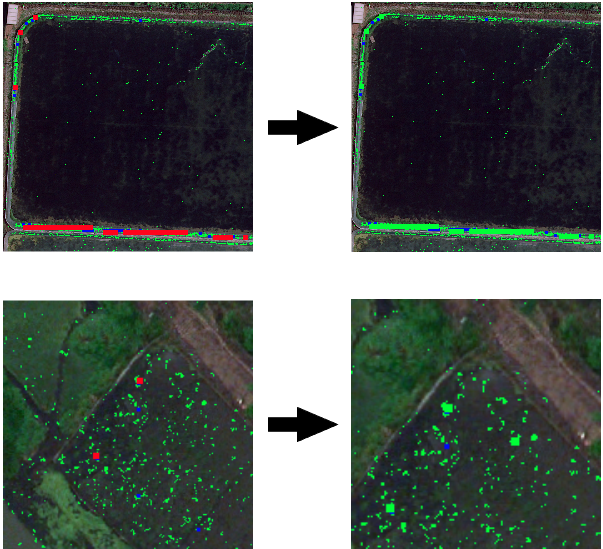
2.4 Image Denoising
Pixels displaying cPV colours might be found in background regions, although less frequently than for actual PV panels. Occasionally, the count of such pixels is sufficient to trigger the moving window threshold, leading to incorrect detections. To address noise, i.e., occurrences of cPV pixels outside of actual panels, it is observed that panel surfaces typically contain large clusters of marked tiles. Conversely, incorrect detections in the surroundings often result in isolated coloured pixels or short coloured stripes. Leveraging this observation, the strategy for identifying and eliminating noise involves evaluating the surroundings of a coloured stripe. To achieve this, the same methodology of the moving window is applied, adapting it for the denoising task. The figure below displays example results of image denoising.
3. Conclusions
This research presents an approach that accurately detects the parts of images showing photovoltaic panels. First, the proposed approach automatically classifies images according to the brightness and saturation of their colours and selects those images having appropriate brightness and saturation levels. This step is automatic and does not require annotated images. Second, the colours characterising photovoltaic panels are gathered by comparing panel colours to the colours of the background/surroundings. This step uses a small number of annotated images to discover the panel colours. Third, detection of photovoltaic panels is automatically performed on images using the obtained PV-characterising colours and their densities without the need for any previous analysis or or annotation. By comparing colour sets, the proposed approach is able to automatically exclude false positives and false negatives by quantifying colour densities within tiles.
To validate the effectiveness of the approach, experiments were performed using an open-source dataset of aerial images containing photovoltaic panels. The results showed that the proposed approach can accurately and consistently identify photovoltaic panels, achieving high precision and recall values. Notably, unlike many CNN methods, the approach is capable of identifying both the areas and the actual precise surfaces of PV panels, offering a dual identification capability.
Thanks to the initial classification phase used in the proposed approach, datasets for different regions can be analysed successfully, e.g., images that have been captured at different times of the day with a specific light can be detected and separated from others, then a subset of the whole set can be automatically identified for PV detection. Moreover, the automatic extraction of distinctive pixel colours characteristic of PV panel models specific to a given region provides a level of tuning, flexibility, and versatility when applying the approach to images with widely varying colours of panels and surrounding areas. Finally, the proposed approach exhibits a fast execution time, as no training phase is required, and works well without a dataset of annotated images, as the gathered representative colours can be used for other regions.
A more detailed comparison with the state of the art, along with a description of the experiments conducted and their results, can be found in the related paper.
This entry is adapted from the peer-reviewed paper 10.3390/technologies11060174