Your browser does not fully support modern features. Please upgrade for a smoother experience.
Please note this is an old version of this entry, which may differ significantly from the current revision.
Subjects:
Oncology
Next-generation sequencing (NGS) has taken on major importance in clinical oncology practice. With the advent of targeted therapies capable of effectively targeting specific genomic alterations in cancer patients, the development of bioinformatics processes has become crucial. Thus, bioinformatics pipelines play an essential role not only in the detection and in identification of molecular alterations obtained from NGS data but also in the analysis and interpretation of variants, making it possible to transform raw sequencing data into meaningful and clinically useful information.
- bioinformatics
- clinical oncology
- pipeline
- next-generation sequencing (NGS)
1. Introduction
Progress in next-generation sequencing (NGS), including an increase in its accessibility and cost effectiveness, has enabled comprehensive genetic testing in many cancer centers and transformed cancer treatment. In particular, NGS has permitted the advancement of precision oncology focused on identifying genetic changes in tumors that include single-nucleotide variants (SNVs), copy number variations (CNVs), small insertions and deletions (indels), structural variants (SVs), and microsatellite instability (MSI) [1,2]. Such valuable insights into the molecular characteristics of tumors provided by NGS have made it an essential tool for the diagnosis and treatment of cancer [3].
Robust and reliable bioinformatics pipelines able to organize, interpret, and accurately identify these molecular alterations from within sequencing datasets are crucial in the treatment decision-making process. The robustness ensures that the pipeline can handle variations in the data and produce consistent results, while the reproducibility ensures that the same results can be obtained when the pipeline is run multiple times. In addition, the comprehensive traceability and understanding of how the pipeline works ensure that others are able to reproduce the results. To this end, a well-designed and well-documented bioinformatics pipeline can provide reliable and accurate guidance for oncologists.
2. Workflow Management
In clinical oncology, the rapid evolution of high-throughput sequencing technologies has increased data generation, necessitating robust and efficient bioinformatic pipelines for analysis. Command-line tools [4,5] offer a flexible and efficient means to handle these data. These tools enable bioinformaticians to construct intricate pipelines that encompass various stages of analysis. The command-line interface, with its text-based interaction, allows for precise control over parameters, facilitating the customization and optimization of workflows to suit the specific requirements of clinical oncology research. However, command-line tools rely solely on text-based interfaces, requiring users to input commands in a terminal or console, while workflow management tools commonly provide users with a graphical or text-based interface to design workflows, offering a more visually intuitive experience. Workflow management tools [6] also ensure the automation and standardization of the bioinformatics process and allow the user to define the order, parameters, and input data for a sequence of tools. They directly take care of the correct execution and documentation of the intermediate steps. Several workflow managers are available, including Snakemake and Nextflow, among others [7,8,9,10,11]. Such systems help bioinformaticians save time, reduce errors, and ensure the accuracy and reliability of their analyses. In cancer genomics, a bioinformatics pipeline is executed by the workflow manager such as that described in Figure 1 and comprises different steps: (i) quality control, (ii) adapter trimming, (iii) alignment, (iv) variant calling, (v) variant annotation, (vi) variant filtering, (vii) CNV calling, (viii) MSI status calling, and (ix) interface generation.
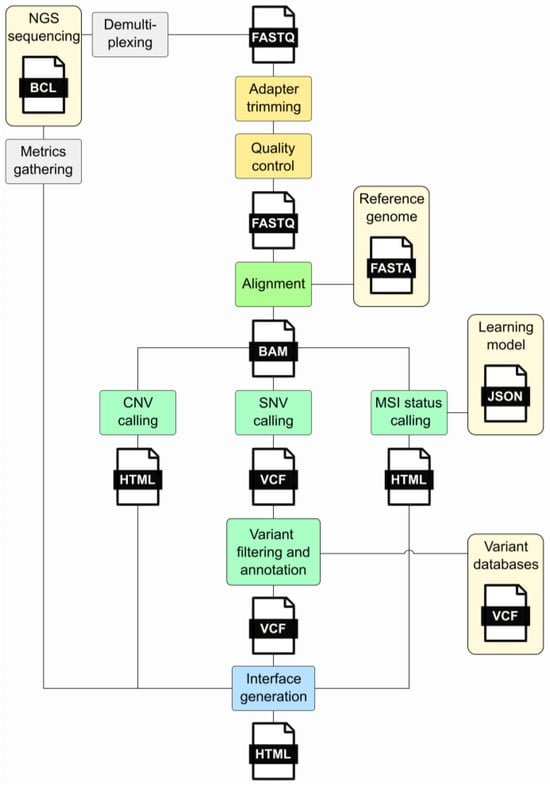
Figure 1. Major steps of an NGS bioinformatics pipeline. This diagram illustrates the processes forming the pipeline and the files generated during its execution. The gray segments denote processes that exist independently of the pipeline. Light yellow signifies external prerequisites, while yellow represents the initial pipeline stages involving FastQ processing. The alignment stage is highlighted in green, while light green indicates the analyses conducted, encompassing SNV, CNV, and MSI status calling. The final step, interface generation, is illustrated in blue. Acronyms: FASTQ—a text-based file storing nucleotide sequences and corresponding quality scores; BAM—Binary Alignment Map; VCF—Variant Call Format; CNV—Copy Number Variation; SNV—Single-Nucleotide Variant; MSI—Micro Satellite Instability.
An up-to-date compilation of available tools for each step of the pipeline is provided in Table 1. It is important to mention that the Broad Institute provides a Genome Analysis Toolkit (GATK) [12], which contains a wide variety of tools designed for variant discovery and genotyping that covers the steps described in Figure 1. Moreover, the nf-core community project [13] has assembled a curated collection of analysis pipelines constructed with Nextflow including a somatic variant calling workflow, SAREK [14,15], available at “https://nf-co.re/sarek/3.4.0 (accessed on 1 December 2023)”. Nf-core offers portable and reproducible analysis pipelines and the support of an active community.
Galaxy [16] and Taverna [17] are both noteworthy platforms in the field of bioinformatics analysis. Galaxy, as an open-source platform, offers a web-based interface for analyzing high-throughput genomics data, especially NGS data. It accommodates users with varying levels of bioinformatics expertise, allowing them to create, execute, and share workflows for diverse bioinformatics analyses. Featuring a user-friendly graphical interface, Galaxy is accessible to a broad audience, providing tools and workflows for tasks such as sequence alignment, variant calling, and various genomic analyses. The platform emphasizes reproducibility, enabling users to systematically save and share their analyses. Taverna serves as a distinct workflow management system designed for various scientific applications, including bioinformatics. It facilitates the design and execution of workflows, providing a flexible environment for scientific analysis and automation. Additionally, Tavaxy [18] shortens the workflow development cycle by incorporating workflow patterns to streamline the creation process. It facilitates the reuse and integration of existing (sub-) workflows from Taverna and Galaxy, while also supporting the creation of hybrid workflows.
Noteworthy, private solutions also exist. For example, the DRAGEN secondary analysis pipeline ensures all the steps from sequencing files to annotated and filtered genetic alterations. It was recently benchmarked, and the authors claim its value in a preprint that came out this year [19].
Table 1. List of commonly used bioinformatic tools.
| Process | Tools | References |
|---|---|---|
| Workflow managers | Nextflow, Snakemake | [7,8] |
| Quality control | fastp, FastQC *, Picard, MultiQC | [20,21,22,23] |
| Adapter trimming | fastp, trimmomatic, cutadapt *, BBDuk | [20,24,25,26] |
| Reads alignment | BWA *, Bowtie, HISAT2, STAR | [27,28,29,30] |
| Variant calling | HaplotypeCaller, freebayes, mutect2, verdict * | [31,32,33,34] |
| Variant filtering | dbSNP, 1000G, GnomAD * | [35,36,37] |
| Variant annotation | VEP *, MobiDetails, ANNOVAR, SnpEff | [38,39,40,41] |
| CNV calling | CNV-LOF, CoverageMaster, CNV-RF, DeepCNV, CNV_IFTV, HBOS-CNV, CNV-MEANN, ControlFREEC, ifCNV *, mcna | [42,43,44,45,46,47,48,49,50,51] |
| MSI status calling | MIAmS *, MSIsensor, MSIdetect, deltaMSI | [52,53,54,55] |
* Used in in-house bioinformatics pipeline.
3. FastQ Processing
3.1. Quality Control
NGS sequencing produces binary base call sequence files (BCL) that are demultiplexed into FASTQ format sequencing files for each sample. The FASTQ format is a text-based format designed to store nucleotide sequences, along with their corresponding quality scores (Figure 2A). The initial stage of all bioinformatics pipelines is to assess the quality of the data. Indeed, sequence quality control is an essential step in the analysis of NGS data, which are generated in large volumes and can be prone to various types of errors, such as sequencing errors, adapter contamination, and sample cross-contamination. Sequence quality control aims to ensure that the sequencing data are accurate, reliable, and free from technical artifacts that could affect downstream analysis. It aims to identify low-quality bases, sequence bias, and over-representation of certain sequences. Quality assessment can be performed using tools such as fastp [20] or FastQC [21], a flexible and widely used tool for quality control, developed at the Babraham Institute to assess the quality of sequencing data in fastq files. This tool is robust, can be used on all operating systems, and offers both a graphical user interface and a command line interface. It is commonly incorporated by bioinformaticians as a quality control step in customized pipelines. The latest versions of FastQC include Picard [22], a tool developed by the Broad Institute that can manage SAM, BAM, and VCF files and perform quality control at different stages of the bioinformatics pipeline. An example of good and bad sequence quality profiles (i.e., the mean quality value across each base position in the read) obtained using FastQC is provided in Figure 3A. Moreover, MultiQC [23] consolidates data from various QC tools to create a cohesive report, complete with interactive plots, spanning multiple samples.
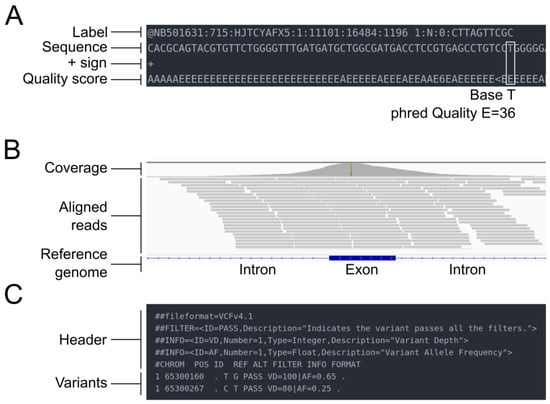
Figure 2. Overview of the different file types mentioned in the pipeline. (A) FASTQ file. (B) SAM/BAM file. (C) VCF file.
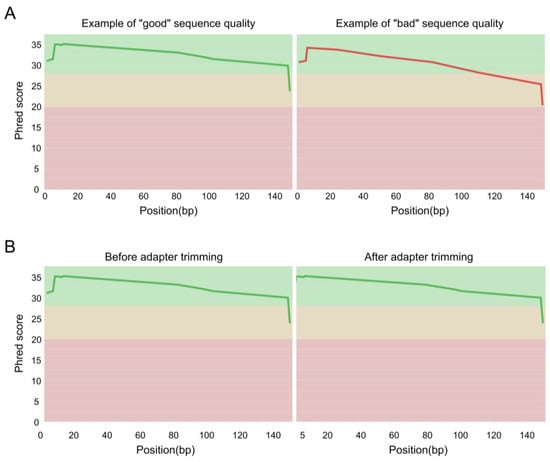
Figure 3. FastQC mean quality scores. (A) Examples of “good” and “bad” sequence quality. (B) Overview of the adapter trimming impact.
3.2. Adapter Trimming
Another preprocessing step is the adapter trimming, which involves removing adapter sequences, low-quality reads, and contaminating sequences from the raw sequencing data. The most widely used tools for data preprocessing are fastp [20], Trimmomatic [24], Cutadapt [25], and BBDuk [26]. In Figure 3B, we present quality profiles obtained using FastQC, illustrating the impact of adapter trimming with Cutadapt.
4. Alignment of the Nucleotide Sequence on a Reference Genome
After adapter trimming, the next step is to align the reads to a reference genome. The Genome Reference Consortium introduced the latest human reference genome, GRCh38 [56], in 2017, followed by subsequent improvements, the latest being GRCh38.p14 in March 2022, which remarkably reduced the number of gaps in the assembly to 349 compared to the initial version’s approximately 150,000 gaps. Notably, these gaps were predominantly found in regions like telomeres, centromeres, and long repetitive sequences. Last year, the Telomere-to-Telomere (T2T) Consortium presented the first fully assembled reference genome [57], T2T-CHM13, eliminating all gaps.
The alignment step is performed by read mapper software, which assigns a location on the reference genome to each read based on its sequence. Since the reads do not contain information about their location in the genome, the mapper infers this information by comparing the read sequence to the reference genome. Essentially, it checks which parts of the reference genome match the sequences in the reads, determining where these reads originated in the genome. However, this seemingly straightforward task is computationally intensive and time-consuming because the software must meticulously compare each read to the entire reference genome and assign a precise position for it. The computational demand arises from the need for high accuracy and reliability in determining the origin of each read, a fundamental step in understanding the genetic information contained within the sequenced sample. There are many different read mappers available, each with its own strengths and weaknesses. Common examples include BWA [27] for genome and Bowtie2 [28] for transcriptome. These tools employ a Burrows–Wheeler transform, a computational method invented by Michael Burrows and David Wheeler in 1994. This method involves rearranging character strings into sequences of similar characters, which offers significant computational benefits. Indeed, strings with repeated characters are easily compressible using techniques like move-to-front transform and run-length encoding. Various aligners employ distinct strategies; for instance, HISAT2 [29] is a graph-based genome alignment tool. The utilization of a graph-based approach allows leveraging theoretical advancements in computer science, resulting in a rapid and memory-efficient search algorithm. In transcriptome alignment, STAR [30] is also widely employed, using the Maximal Exact (Unique) Match concept for seed searching, it proves particularly advantageous for aligning long reads (>200 bp), such as those generated by third-generation sequencing.
The results of the read mapping step are usually provided in SAM format files, which can be converted to BAM format for more efficient storage and processing. SAM/BAM files can be accessed through the Integrative Genomics Viewer (IGV), allowing visualization of the reads (Figure 2B). The BAM files undergo different modifications during the alignment post-processing step, which includes tasks such as sorting, marking duplicate reads, and recalibrating base quality scores. The goal of these post-processing steps is to improve the accuracy and reliability of the final variant calls.
After the read mapping step, the resulting SAM/BAM files are sorted according to their genomic coordinates. This sorting is important because downstream analysis often relies on the order of the aligned reads. PCR duplicates are then commonly removed using tools such as Picard [22,58] or SAMtools [5]. PCR duplicates are identical copies of the same genomic fragment and can be introduced during sample preparation and PCR amplification steps. They can bias the analysis and lead to overrepresentation of certain regions of the genome. However, it is important to note that duplicated reads can also be biological copies originating from the same genomic location of chromosomes of different cells. For deep-coverage targeted sequencing approaches the probability of a duplicate read to be a biological copy increases with coverage, and therefore, the removal of duplicates is typically not performed in these cases.
This entry is adapted from the peer-reviewed paper 10.3390/cimb45120608
This entry is offline, you can click here to edit this entry!