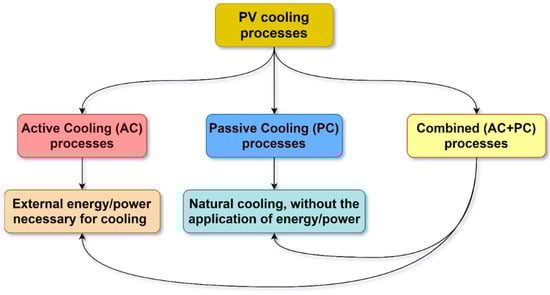
Therefore, to improve the overall performance of a PV system, the efficiency of each panel needs to be considered. As the PV panel’s working efficiency decreases with the increase in ambient temperature, the working PV cell/panel temperature also rises. Therefore, concerned scientists and researchers around the globe are working on various technologies to minimize the overheated PV panel’s operating temperature to be more efficient.
Another passive cooling system is the heat pipe (HP) system, and HP is a heat transfer device that uses the concept of thermal conductivity and phase change (latent enthalpy) phenomenon. The system contains fluid capable of removing heat from the source, and then the heat is transmitted to the other end of the system to the thermal energy dissipater.
3. Floating PV Cooling Procedures and Evaporation Reduction Evaluation
The FPV systems have become a proven success and have been designed, developed, and installed worldwide. As reported in Offshore Engineer magazine, there is about 2 GW global installed capacity of FPV, which can be found in 2020 [
69]. According to the research of Wook Mackenzie, FPV installation capacity will rise to 6 GW [
70]; notably, China and India will be the leaders.
The idea to build PV plants over water bodies was mainly born from the desire to overcome the significant social and technical cons related to ground-based PV plants, of which a few critical problems could be highlighted:
- (i)
-
Lack of availability of projectable land: Many PV floating projects were built on the waterbody because of a shortage of cultivable lands. As done in the Napa Valley Project in the USA [
71].
- (ii)
-
Natural Disaster: Earthquakes or tsunamis can potentially destroy any traditional power plant (like the Fukushima Daiichi Accident/nuclear disaster, Japan WNA 2023) and bring havoc to humankind. Notably, green energy sources reduce risks, and interestingly, in the last few years, Japan has had FPV installed to transform its water bodies into energy production fields [
72].
- (iii)
-
Problem of water evaporation: With the application of FPV on water bodies, it is possible to reduce the loss of water (also potable) due to evaporation [
26].
- (iv)
-
Negative temperature coefficient: Notably, the efficiency of PV panels decreases with the rise of its operation temperature [
15].
Many installation technologies have been experimented with and used for mounting FPV systems; mainly, these can be categorized based on the kind of floats and panels used and already have been mentioned in Sahu et al. [
73].
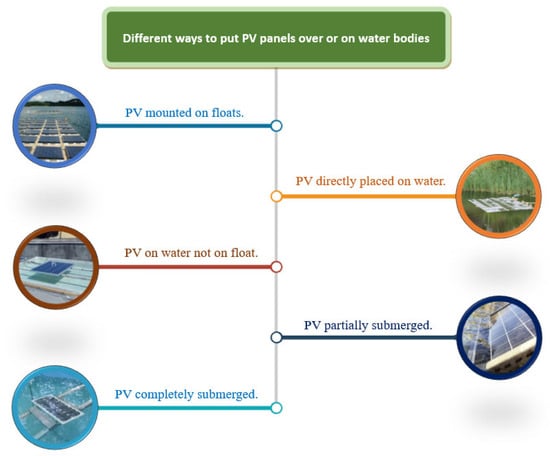
A PV panel(s) can be placed over or on water bodies in many ways, as shown in Figure 20.
Figure 20. Passive cooling schemes: PV placed over or on water bodies.
Notably, there are many significant advantages of FPV or putting solar PV panels on or over water surfaces, as reported below:
- (a)
-
Increase of panel efficiency and overall production efficiency: The panel’s negative temperature coefficient or the rise in operational temperature of a PV panel can be reduced or checked under control by passive water cooling [
26] or through active cooling by spring water on the hot panel.
- (b)
-
Water evaporation reduction: Because of the shadowing effect, the water evaporation reduces; thus, water losses can be checked, and the precious water can be used for local use. Majumder et al. [
26] reported 30% of water evaporation reduction by covering 17% of the total water surface area.
- (c)
-
Dual positive effect: The panel’s efficiency improves; therefore, the electricity production increases, whereas the water evaporation also reduces [
26].
- (d)
-
Agricultural less land use: By putting solar panels on or over unused water bodies, reservoirs, lakes, water treatment plant reservoirs, and agricultural reservoirs, it is possible to minimize the use of the precious land needed for agriculture or other crucial human use. FPV could be ideal for those countries which are smaller in size and have agriculturally based economies [
74].
- (e)
-
Early morning production: According to (NRG 2010), due to the mitigation effect, the panels start producing earlier in the winter season. Particularly during winter, the panels (the plant) start producing earlier because the panels defrost 1 h before than in normal conditions.
- (f)
-
Water Quality improvement: It has been claimed [
73] that water quality improves due to photosynthesis and algae growth reduction.
- (g)
-
Reduction in deforestation: By minimizing the PV plants’ land use [
73].
- (h)
-
CO
2 reduction: Some case studies have shown that FPV encourages carbon dioxide reduction [
75].
3.1. FPV Efficiency Increment
One can achieve the efficiency of the FPV panels or the system as a whole through passive and/or active cooling. For an FPV system, water in the water bodies is used as a cooling medium, while the same water body acts as a heat sink. Many FPV installation procedures are reported in the literature, with different types of floats and structures used, with various PV panel tilt angles, and, most interestingly, the way of putting/placing PV panels (as shown in Figure 20).
3.1.1. PV Mounted on Floats
Notably, the first FPV system was installed on the “Aichi ike” balancing reservoir in Japan [
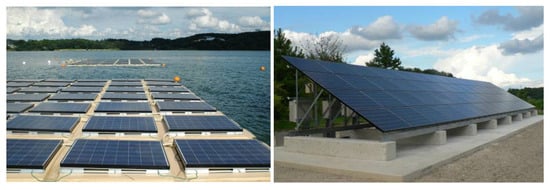
58]. The authors built two FPV systems and prepared the floats with foamed polystyrene boards and plastic connectors. The panels of the FPV system were placed with a tilt angle of 1.3°, while the panels in the case of the land-based system (
Figure 21) have a tilt angle much greater than the FPV system. One of the FPV plants was equipped with an active cooling system, and water was sprayed at an interval of 10 min for 1 min (from morning 8:00–17:00). As highlighted, the FPV systems received 15% less total radiation to the ground-mounted plant. Interestingly in the summer months (May, June, and August), both FPV plants showed better performance than the land-based plant, while August is the only exception for FPV without active cooling. During the total experimental period, the FPV with an active cooling system had a higher yield than the F PV subjected to passive cooling. Notably, in August 2007, the maximum temperature drop of 25 °C was noticed due to water cooling. The generated electric power obtained was 6.8 kWh more for the water-cooled system when compared with the not-cooled system.
Figure 21. FPV versus land-based system. Reproduced with permission from [
58].
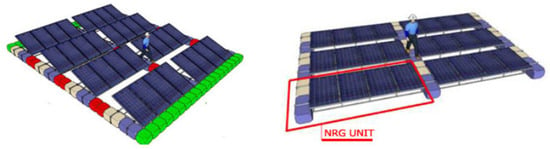
An Italian company NRG Island claimed that their design and technology of the FPV plant (
Figure 22) could produce an estimated amount of 5–20% more electricity during summer than that of a ground-mounted plant. This is due to the cooling effect, as the panels have lower working temperatures. Another advantage, as reported by the company, is that during winter, in the FPV, the panels start producing electricity early as they defrost (Italian condition) about 1 h before the panels are installed in normal condition (ground-mounted or roof-top), Therefore, both in summer as well as in winter, the increase in the PV efficiency can be noticed [
76].
Figure 22. FPV installation scheme developed by NRG Island company in 2010 [
76].
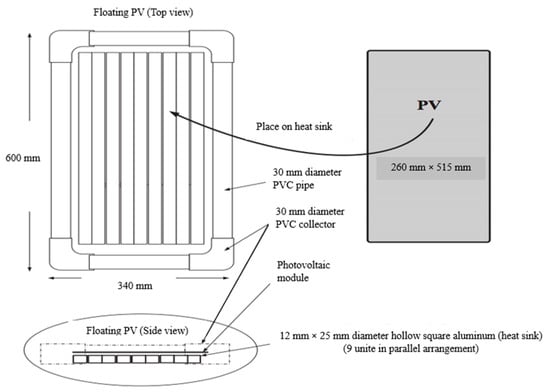
Figure 23 presents an FPV with an aluminum heat sink [
77]. PVC pipes were used to build a float, and the PV panel was placed on it. The heat transfer mechanism was constructed using nine hollow square aluminum blocks, and they were attached under the PV panel with adhesive material. The aluminum block and adhesive material used are good conductors of heat. Notably, the aluminum is non-corrosive. The authors tested three different solar radiation ranges for the PV system placed on water. They reported temperature drop and efficiency increment in the range of 1.2–4.0 °C and 0.15–0.19%, 1.4–5.5 °C and 0.05–0.18%, and 1.8–5.6 °C and 0.59–0.76% when the FPV system subjected under 417 W/m
2, 667 W/m
2 and 834 W/m
2 solar radiation for a time interval of 15–60 min. The percentage of power and efficiency increased by 3.61%, 3.79%, 2.88%, 2.82%, and 14.55% and 14.58%, respectively, at previously mentioned solar radiations.
Figure 23. FPV with an aluminum heat sink [
77].
The same research group [
78] conducted a similar experiment; however, the floating structure, the aluminum heat sink, and the PV panel size were bigger than their previous work. The authors found about a 15.5% increase in the produced energy for the two-hour test. Notably, the optimum temperature drop of 25 °C was observed with the radiation of 1000 W/m
2, while there was a 0.49% drop in efficiency with the increase of 1 °C.
Innovative floating tracking cooling concentrating (FTCC) systems studied by Cazzaniga et al. [
79], reported an increase in the annual energy yield by over 30% compared to a land-based system.
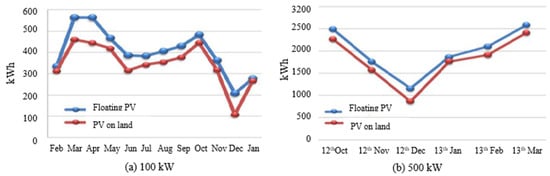
Choi 2014 [
80] compared the performance of two FPV plants (100 kW and 500 kW) with a ground stand-alone plant (1 MW). For both FPV systems, the PV tilt angle was 33°, while the tilt angle of the ground plant was 30° but all with similar radiation and ambient temperature conditions. As highlighted, the FPV system has shown 11% better generation efficiency than the overland PV system; notably, this performance improvement was due to the passive water-cooling effect, which helped lower the PV working temperature (
Figure 24).
Figure 24. FPV plants energy production gain due to passive water cooling [
80].
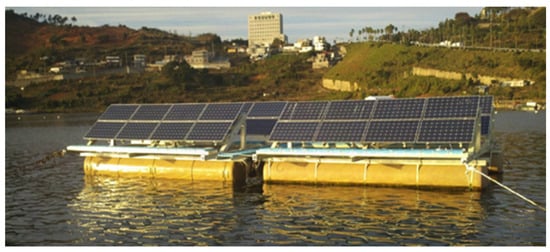
The performance of the FPV system (
Figure 25) has been compared with a land-based PV system by Lee et al. [
81]. The authors used pultruded fiber-reinforced polymeric plastic (PFRP) to build the structural parts. Direct comparison between these two systems has demonstrated an energy increment of approximately 25%.
Figure 25. PV panels mounted on fiber-reinforced polymeric plastic structures placed on a floating system [
81].
A tracking FPV (100 kW) has been designed and fabricated by Yoo et al. [
82]. The performance of the tracking FPV has been evaluated by comparing it with a land-based system (100 kW), and about 11.97 MWh more energy was produced by the tracking FPV.
Yadav et al. [
83] constructed an FPV system and compared its performance with a land-based system. The PV panels were subjected to a solar intensity between 125–945 W/m
2. The generating efficiency of the FPV system is about 0.79% when compared with a land-based system.
Durković et al. [
84] have proposed a solution by tracking FPV to generate electricity for a nearby aluminum plant. The proposal for tracking sun azimuth and reflectors enables the system to have about 27.68% (FPV) + 4.32% (reflector) more energy production.
Kamuyu et al. [
85] compared the FPV and rooftop systems. They reported the FPV system could produce more energy by about 21% annually, notably when module temperatures of both systems are below 40 °C.
3.1.2. PV Directly Placed on Water
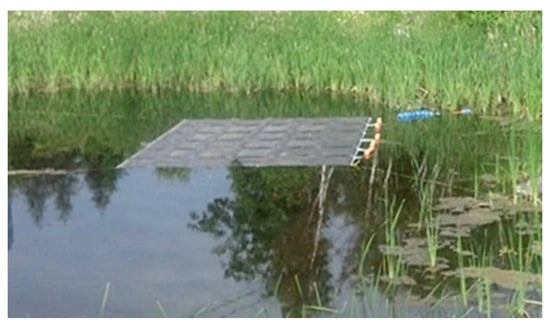
Figure 26 presents another innovative type of FPV system without any metallic structure [
86]. Interestingly, in this case, the water body has been performed as a heat sink; as highlighted by the authors, no improvement in terms of output was noted.
Figure 26. Innovative PV system on the water surface [
86].
3.1.3. PV on Water but Not Float
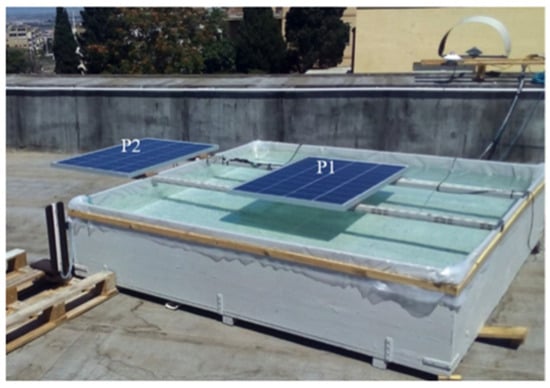
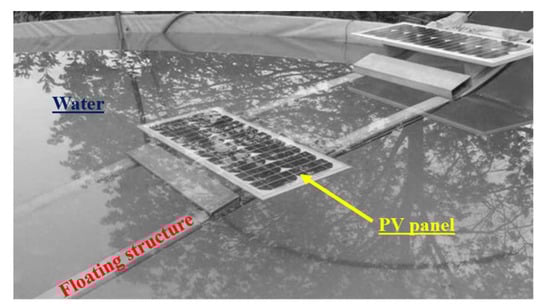
While Majumder et al. [
26] have studied the performance of PV panels by placing the panel above water,
Figure 27 presents the PV installation scheme. Notably, the air between the water surface and the panel helped cool down the temperature of the panel. Due to the natural water-cooling process, a relative improvement in efficiency of 17% has been reported.
Figure 27. PV panel P1 placed above the water, and panel P2 placed at ambient condition [
26].
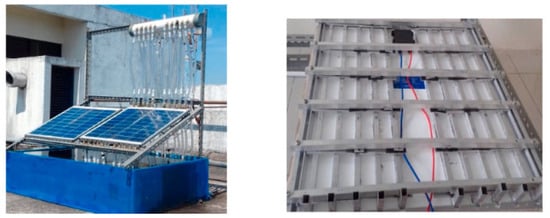
Sutanto et al. [
87] performed the experiment on two sets of FPV systems, one equipped with a thermosiphon cooling mechanism (
Figure 28). They found the efficiency increment of the FPV and FPV with thermosiphon systems to be equal to 4.52% and 7.86%, respectively.
Figure 28. PV on water equipped with thermosiphon cooling mechanism proposed by [
87].
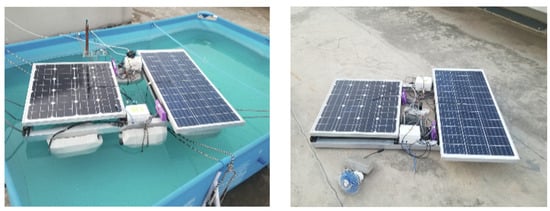
Figure 29 depicts an FPV system that increased its efficiency by 20–28% due to water cooling [
88]. Due to the cooling effect, PV front and back temperatures decreased by 2% to 4% and 5% to 11%, respectively.
Figure 29. FPV system versus land-based PV system by [
88].
3.1.4. PV Partially Submerged
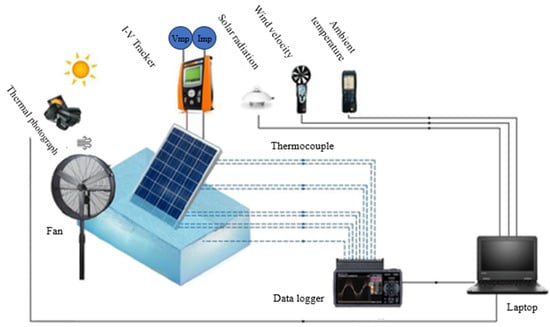
An important example of combined (active and passive) FPV cooling (
Figure 30) was provided by Elminshawy et al. [
29], where the wind condition was simulated using a fan. The performance of normal FPV and partially submerged (10% inside water is the submerged ratio) FPV have been evaluated. The authors measured when partially submerged FPV was subjected to various wind speed conditions. The partially submerged (10%) FPV was found to be 11% more efficient when compared with normal FPV. Also, its output power rose with the increase in wind speed, i.e., 20.28% at 15 km/h.
Figure 30. Passive and active cooling of the FPV system [
29].
Elminshawy et al. [
89] studied three FPV panels: the reference normal FPV, another submerged FPV, and the last submerged-finned FPV. The aluminum U-shaped fins were attached at the back of the third panel (
Figure 31) to act as a passive heat sink, and by submerging 20% of the PV panel inside water, the operating temperature, and the electrical efficiency of it found to be equal to 19.07% and 24.02%, respectively.
Figure 31. Partially submerged FPV [
89].
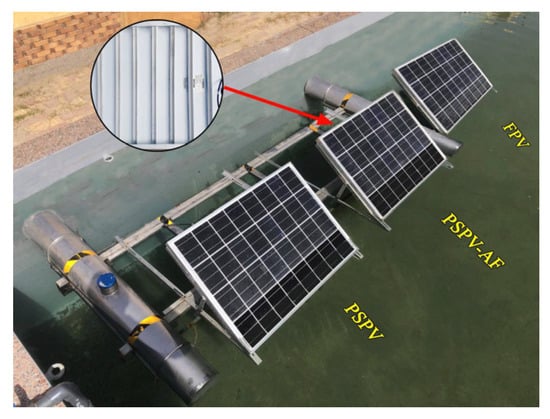
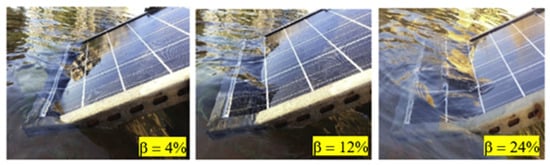
Elminshawy et al. [
90] studied a partially submerged FPV system (
Figure 32). During this campaign, 4%, 12%, and 24% of the PV panels were submerged in water. The reference ground-mounted FPV panels were mounted with a tilt angle of 25°. Results showed that the partially-submerged-FPV system performs better with a 12% submerged ratio for efficiency increment and PV operating temperature reduction. Due to the passive cooling effect, the electricity production and efficiency improved to the ground-mounted panel by 27.31% and 12.20%, respectively.
Figure 32. Partially submerged FPV proposed by [
90].
A partially-submerged-FPV system was studied by Elminshawy et al. [
91]; however, in this case, the ground-based PV and partially submerged FPV panels were placed at 15° tilt angle, while the PV submerged percentages were chosen as 5%, 10%, and 20% respectively. The authors reported that the partially submerged FPV working temperature reduced approx. 7.9 °C to 10.5 °C when the submerged ratio changed from 5% to 20%, the efficiency gain was reported at 15.6%, 28.4%, and 8.20% at submerged ratios of 5%, 10% and 20%, respectively.
3.1.5. PV Completely Submerged
The performance of a submerged PV system (
Figure 33) has been studied by Lanzafame et al. [
92]. The authors submerged the PV panels (technologies crystalline and thin film) inside water up to 50 cm; at this maximum depth, power production was reduced by 20% and 10%, respectively, for both technologies. At the same time, authors have reported that efficiency improvements were observed from 10% to 20% of PV panels submerged in shallow water.
Figure 33. Completely submerged PV panel.
3.1.6. Mathematical Model
A mathematical model was developed by Tina et al. [
93] to evaluate the performance of bifacial and monoracial PV modules installed on the water surface. The model was validated using the experimental data. The authors reported that the production due to passive and active cooling was 3% and 9.7% more for bifacial systems, while 2.6% and 9.5% for monofacial systems, respectively.
A study has been conducted by Liu et al. [
94], and the finite element model has demonstrated a difference of 3.5 °C in operating temperature between the FPV cell and a land-based cell. While the probability of efficiency increment of the FPV system is around 1.58–2.00% when compared with the land-based system.
While Sukarno and Kim [
95] measured the local temperature trends in four locations of a lake (two in the lake, ground, and dam structure), the authors used this to predict the efficiency and yearly yield of the FPV system. They found the FPV efficiency to be 6.08% higher than the ground-based system.
3.2. FPV Evaporation Reduction
Water evaporation is one of the reasons why scientists, researchers, and various private and public agencies have started studying and analyzing the possibilities of putting PV panels on water bodies. Water evaporation can be minimized significantly when the panels are directly placed on or over the water bodies. Of course, the reduction value is directly proportional to the area covered by the PV system.
In most cases, the impact of the FPV on the evaporation rate has been estimated by calculating the value. Notably, Santos et al. [
96] various models like the Penman-Monteith model, Hargreaves–Samani model, Valiantzas model, Linacre (1993) and Linacre (1977) models to estimate the water evaporation and, details about these methods can be found in [
97,
98,
99,
100], respectively.
On the other hand, very little information or experimental data is available in the literature related to water evaporation.
Table 3 presents various studies conducted experimentally and analytically to evaluate the water evaporation reduction from the water basin when the water’s surface or water body is covered with PV system(s).
Table 3. Evaporation reduction due to FPV system application.
| References |
Type of Study |
FPV Project Information |
Result |
| Majumder et al. [26] |
Experimental |
17% of the total water surface area was covered using the PV panel (0° tilt angle) and compared with similar un-covered water surface area. |
30% reduction rate |
| Abdelal, Q. [101] |
Experimental |
The water surface area is almost completely covered with a PV panel (27° tilt angle) and compared with a similar un-covered water surface area. |
60% reduction |
| Mittal et al. [102] |
Numerical |
Covering 5%, 10%, 15% and 20% of the four lakes were considered. |
5–20% of evaporation reduction annually. |
| Cazzaniga et al. [103] |
Numerical |
Covering 10% of the water’s surface area was considered. |
Reduced evaporation by 6% to 18%. |
| Scavo et al. [104] |
Numerical |
10% of the basin is covered with FPV |
Water reduction ranges from 7% to 19%. |
| Nagananthini et al. [105] |
Numerical |
Covering 30% of the reservoir surface area was considered. |
Annual water saving bout 42,732 m3. |
| Elhamid et al. [106] |
Numerical |
Total water information annually is 12 × 109 m3.
For this study, 25%, 50%, 75%, and 100% of the lake was considered to be coved. |
Annual water saving 2.1 × 10⁹ m3, 4.2 × 10⁹ m3, 7.0 × 10⁹ m3 and 8.4 × 10⁹ m3, respectively. |
| Santos et al. [96] |
Numerical |
0.015% (existing FPV) up to 0.57% (estimated), total covering of the lake by FPV. |
Up to about 60%. |
| Bei et al. [107] |
Numerical |
Covering approx. 33% of the total lake area. |
Annual avg. suppression efficiency is 58%. |
| Abdelgaied et al. [108] |
Numerical |
50% of the lake is covered with FPV |
Approx. 62%/year of the evaporation reduction. |
| Muñoz et al. [74] |
Numerical |
25% of the total water surface area |
Annual water evaporation saving of 8.4 × 10⁹ m3. |